
POLLUTION DIARY
HISTORIC DATA - YEAR 1
-- 22nd FEBRUARY 2019 to END FEBRUARY 2020 --
Return to Current Year (March 2021-February 2022)
(the small overlap of data for February is deliberate to aid reading/switching screens)
Explore Year 2 - after which Flow 1 was replaced with Flow 2 Device
- The Pollutants: I record four out of the five most toxic air pollutants associated with vehicles. I don't measure Ammonia (NH3).
- The Flow device: this measured as 90-95% accurate when compared with professional static monitors. Most of my data comes from one point close to the new Blind Company on Greenstreet/A2. The advantage of the Flow device is that it can measure "on the move". This allows me to create maps in real time in different stretches of road/lane around Greenstreet and show how pollution spreads a long way into our communities.
- Air Quality Indicators: These are based on EU, USA, and WHO thresholds for harmful pollutants over 1 hour, 24 hours, and a year.
- There are no known "safe levels" of PM2.5. This very fine form of pollution has many impacts, depending on the mix and size of particles (soot? soot binding to toxins? minerals? metals? organic compounds? ozone?)
- You will notice that pollution episodes can spread overnight.
AIR QUALITY INDICATOR (AQI) USED ON THIS SITE
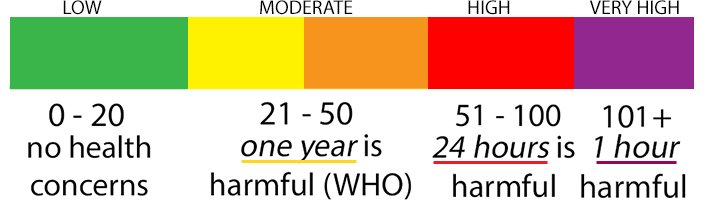
(Bear in mind, there are no known lower safety levels for PM2.5)
NOTE: The static measurements that I have been making are taken along the A2 but West of the AQMA5.
Bear in mind that the measurements made by SBC have only relatively recently been relevant once they responded to Lynsted with Kingsdown Parish Council's criticism that SBC 'diffusion tubes' were sited unrealistically high above the heads of pedestrians.
SBC also fails to test for the more harmful PM2.5, PM10, and VOCs.
The appearance is that SBC would rather NOT know how much physical harm their decisions on planning have on our DAILY lives!
Data - February 2019 - February 2020
| Toxic Pollution Levels | Exceedances (time and duration) | |||||||
| Date | PM2.5 | PM10 | NO2 | VOCs | Daily Average |
High (24 hours or more) |
Very High + (1 hour or more) |
Graphs, Maps and Comments |
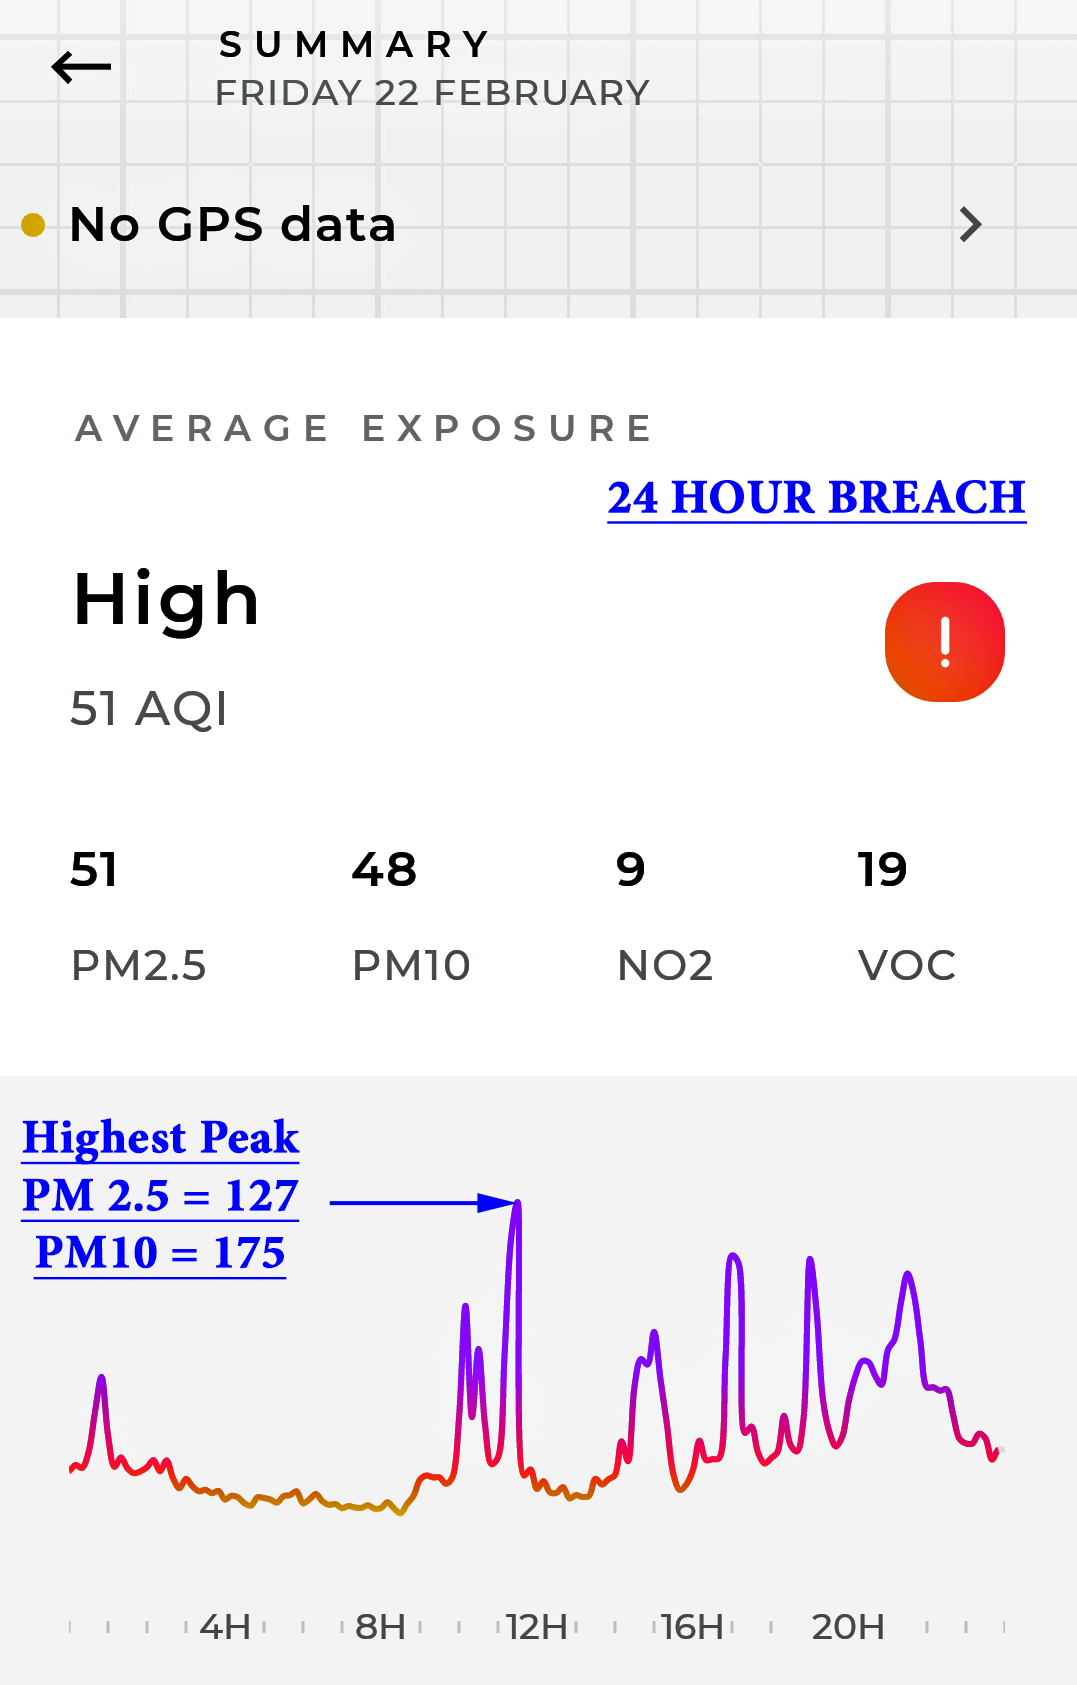
| 22 February 2019 | 51 | 48 | 9 | 19 | HIGH |
Exceedance | Exceedance:- 20.55pm - 21.55pm - PM2.5 & PM10 - |
Graph; Wind SW to SE |
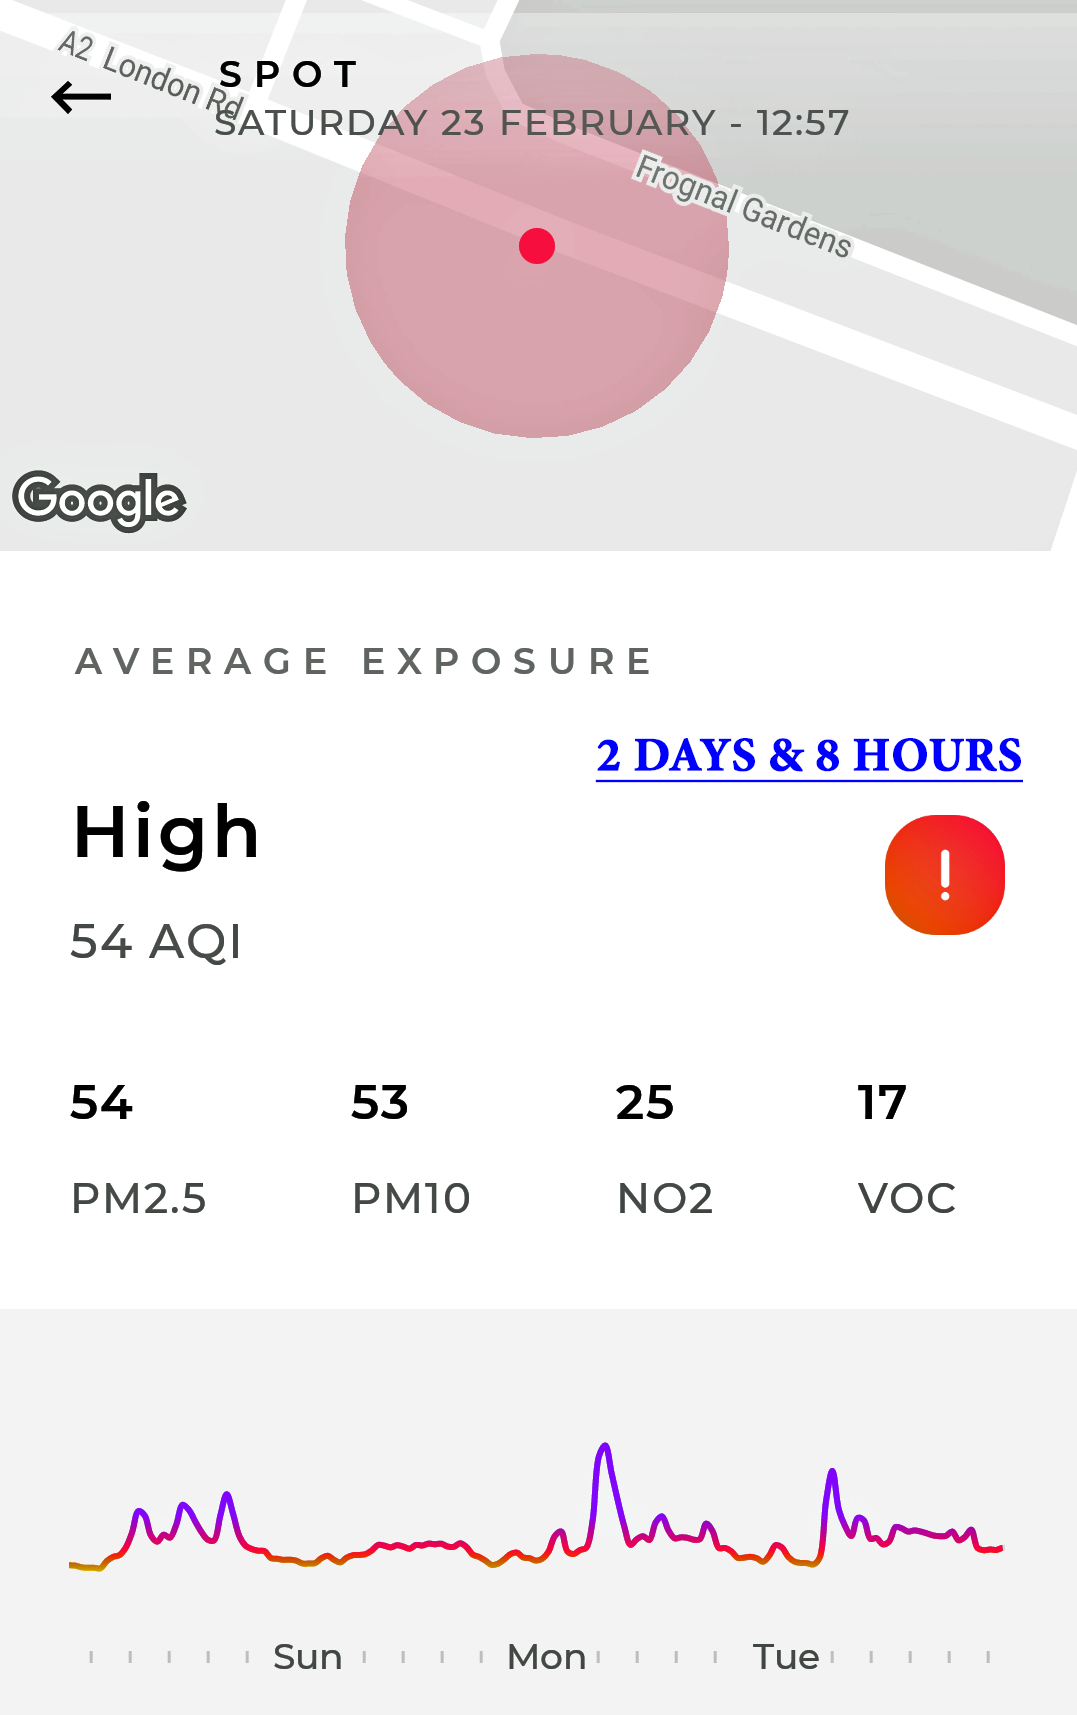
| 22 (13.00pm) - 25 (10.54am) February | 54 | 53 | 25 | 17 | HIGH | Exceedance over 2 days and 8 hours | Graph; Wind SW to SE | |
| 24 February | 52 | 49 | 16 | 18 | HIGH | |||
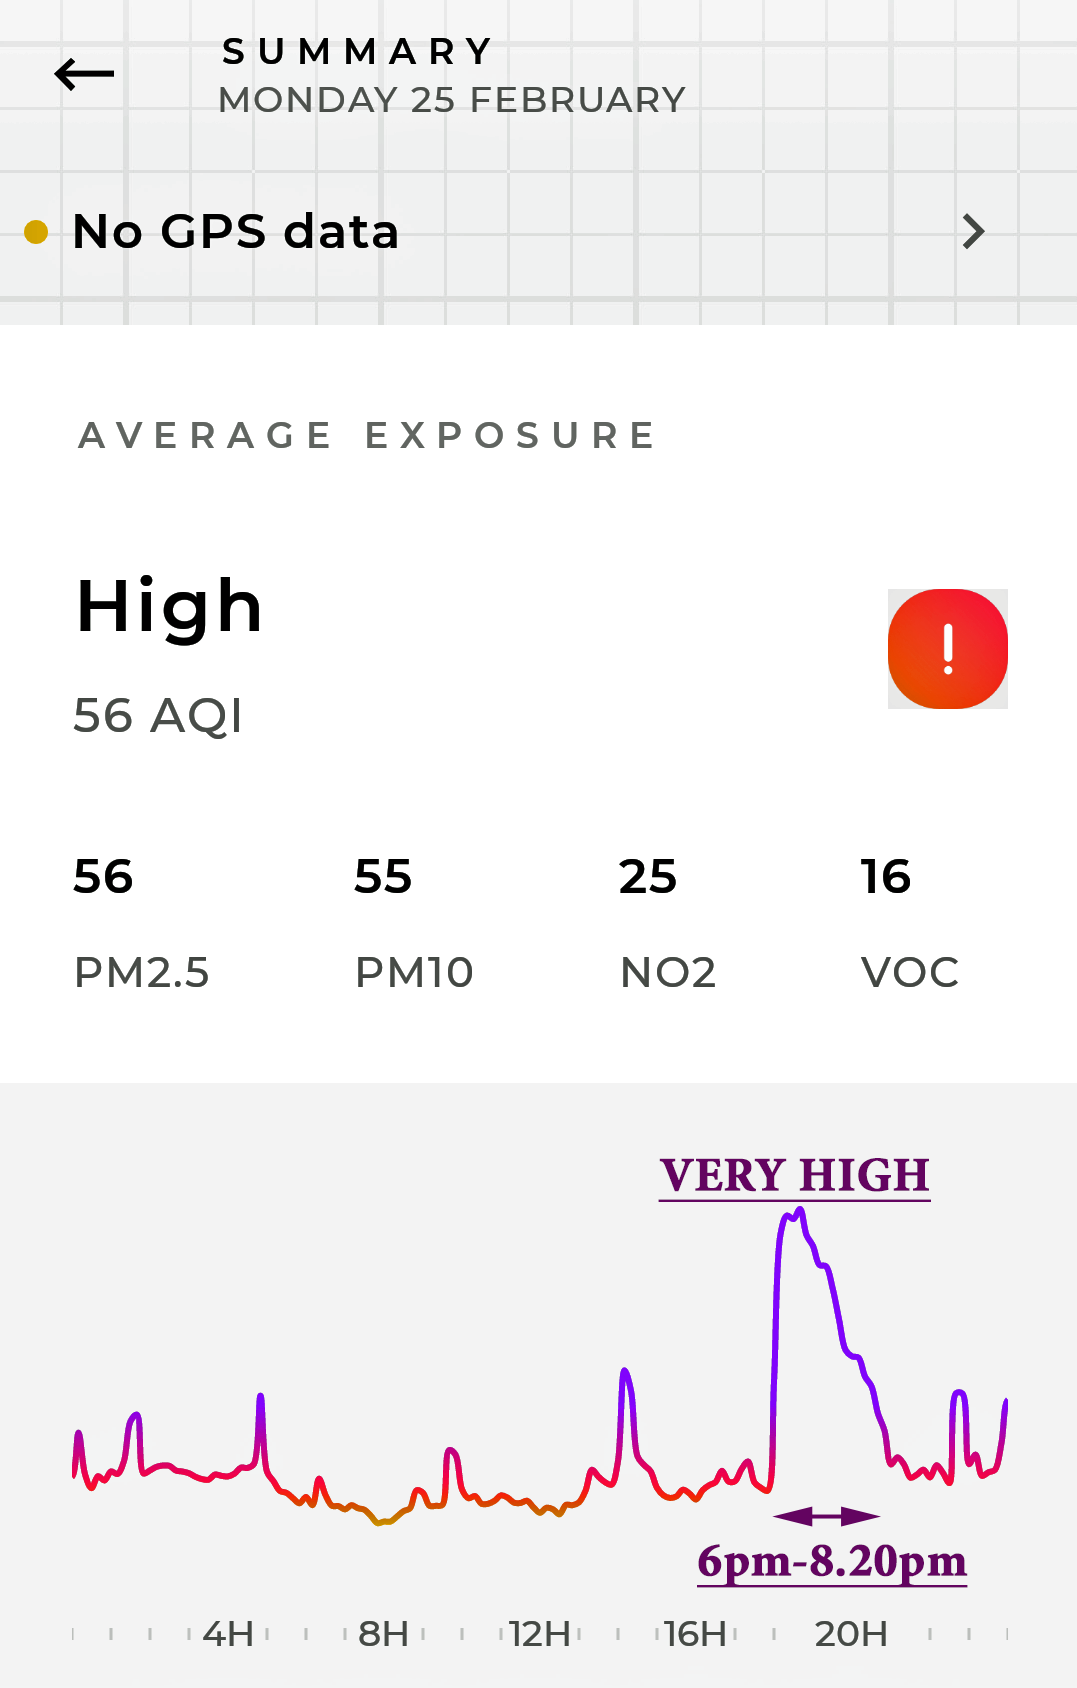
| 25 February | 56 | 55 | 25 | 16 | HIGH | Exceedance | Exceedance:-
18.00pm - 20.20pm - PM2.5 & PM10 - |
Graph; Wind SE |
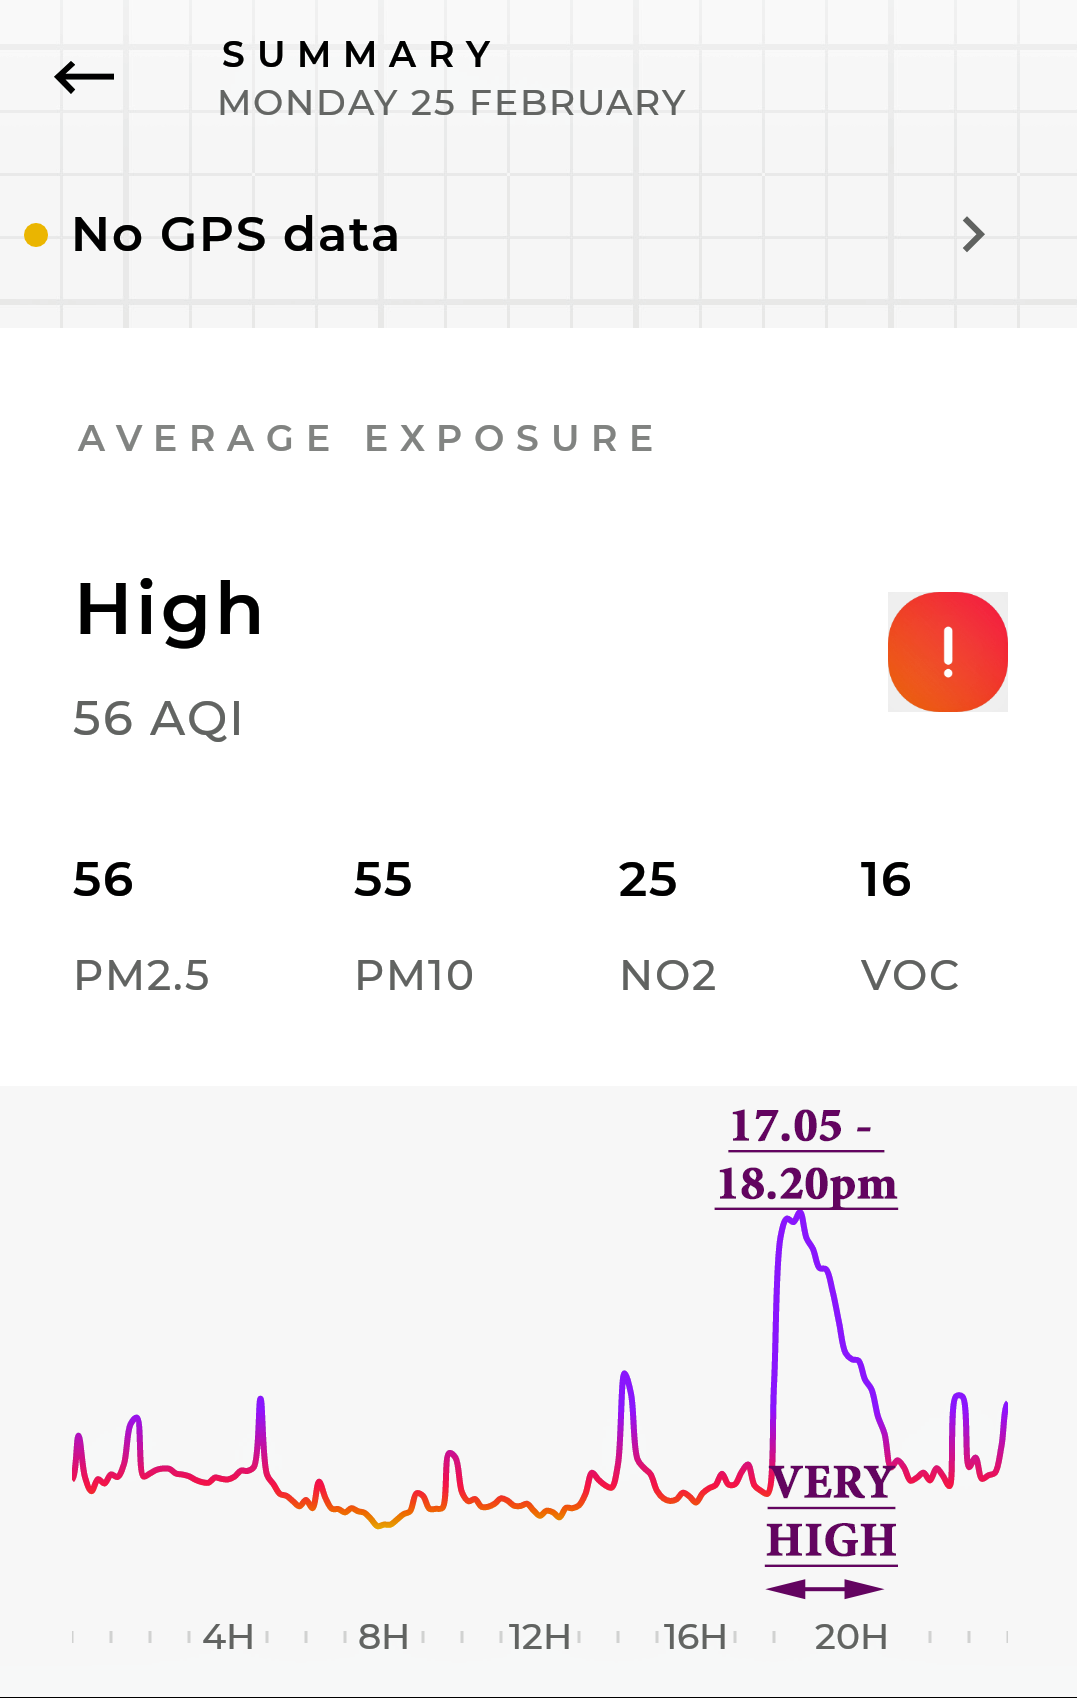
| 26 February | 56 | 58 | 27 | 17 | HIGH | Exceedance | Exceedance:- 17.05pm - 18.20pm - PM2.5 & PM10 - |
Graph; Wind SE - E - SE |
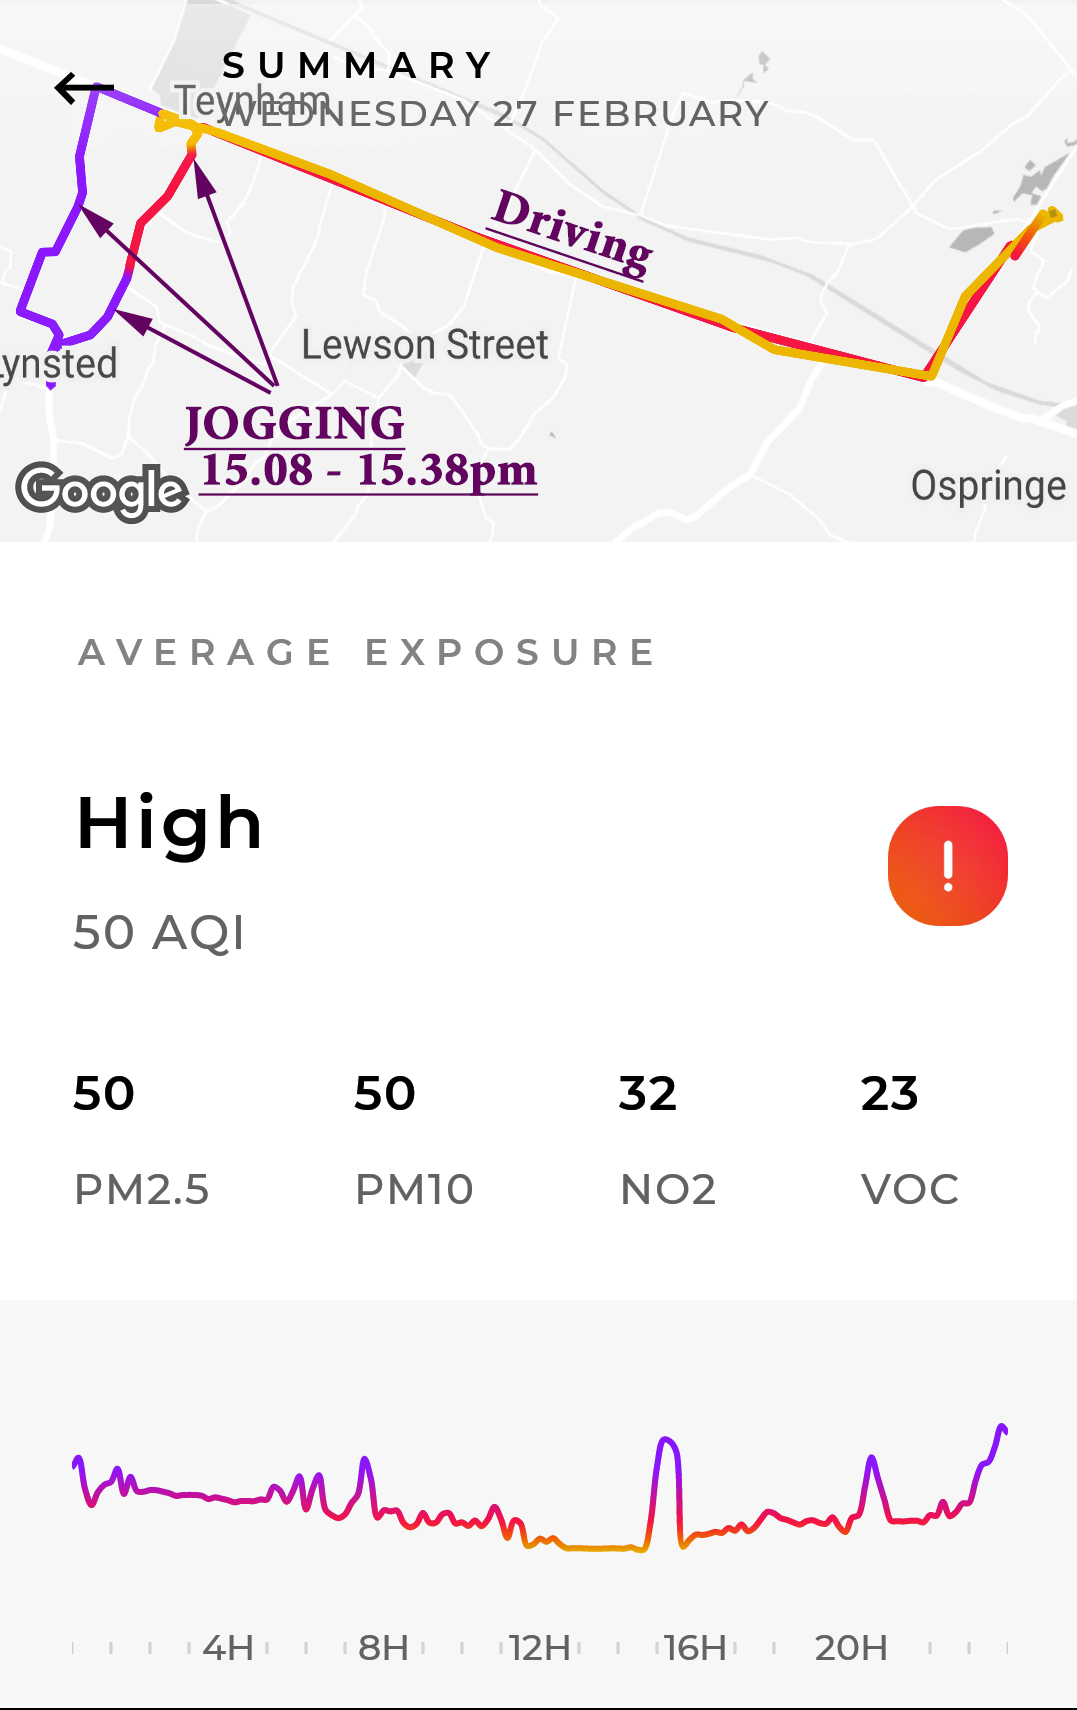
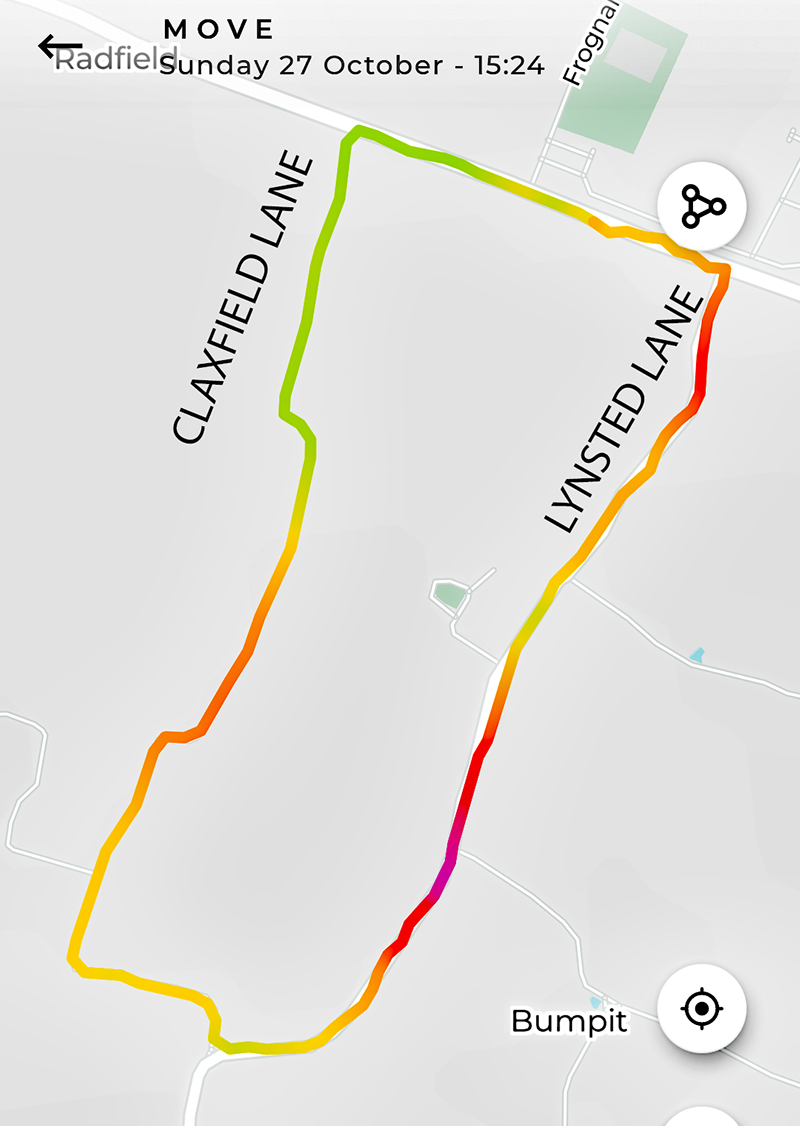
| 27 February | 50 | 50 | 32 | 23 | HIGH | Exceedance | Graph with map; Wind S - SW | |
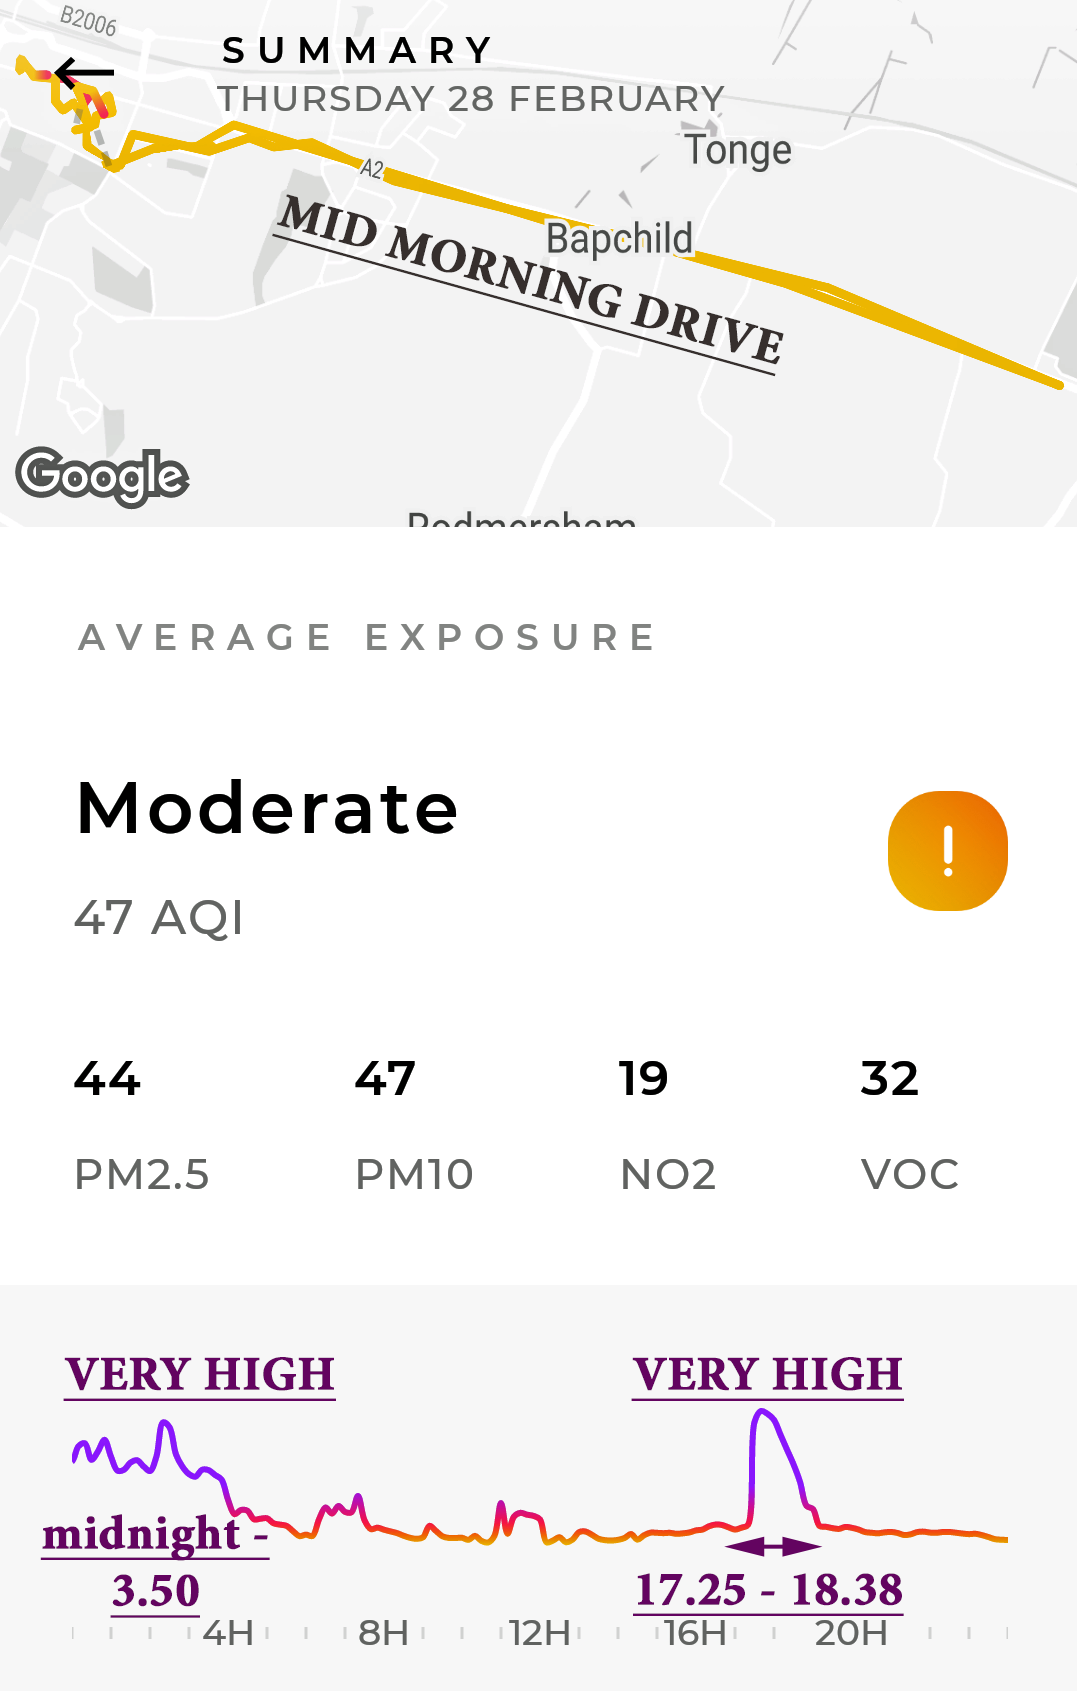
| 28 February | 44 | 47 | 19 | 32 | MODERATE | Exceedances:-
Midnight - 03.50am - PM2.5 & PM10 - 17.25 -18.38 - PM2.5 & PM10 - |
Graph & map; Heavy overnight traffic. Wind SW - W | |
| MARCH 2019 | ||||||||
| Toxic Pollution Levels | Exceedances (time and duration) | |||||||
| Date | PM2.5 | PM10 | NO2 | VOCs | Daily Average |
High (24 hours or more) |
Very High + (1 hour or more) |
Graphs, Maps and Comments |
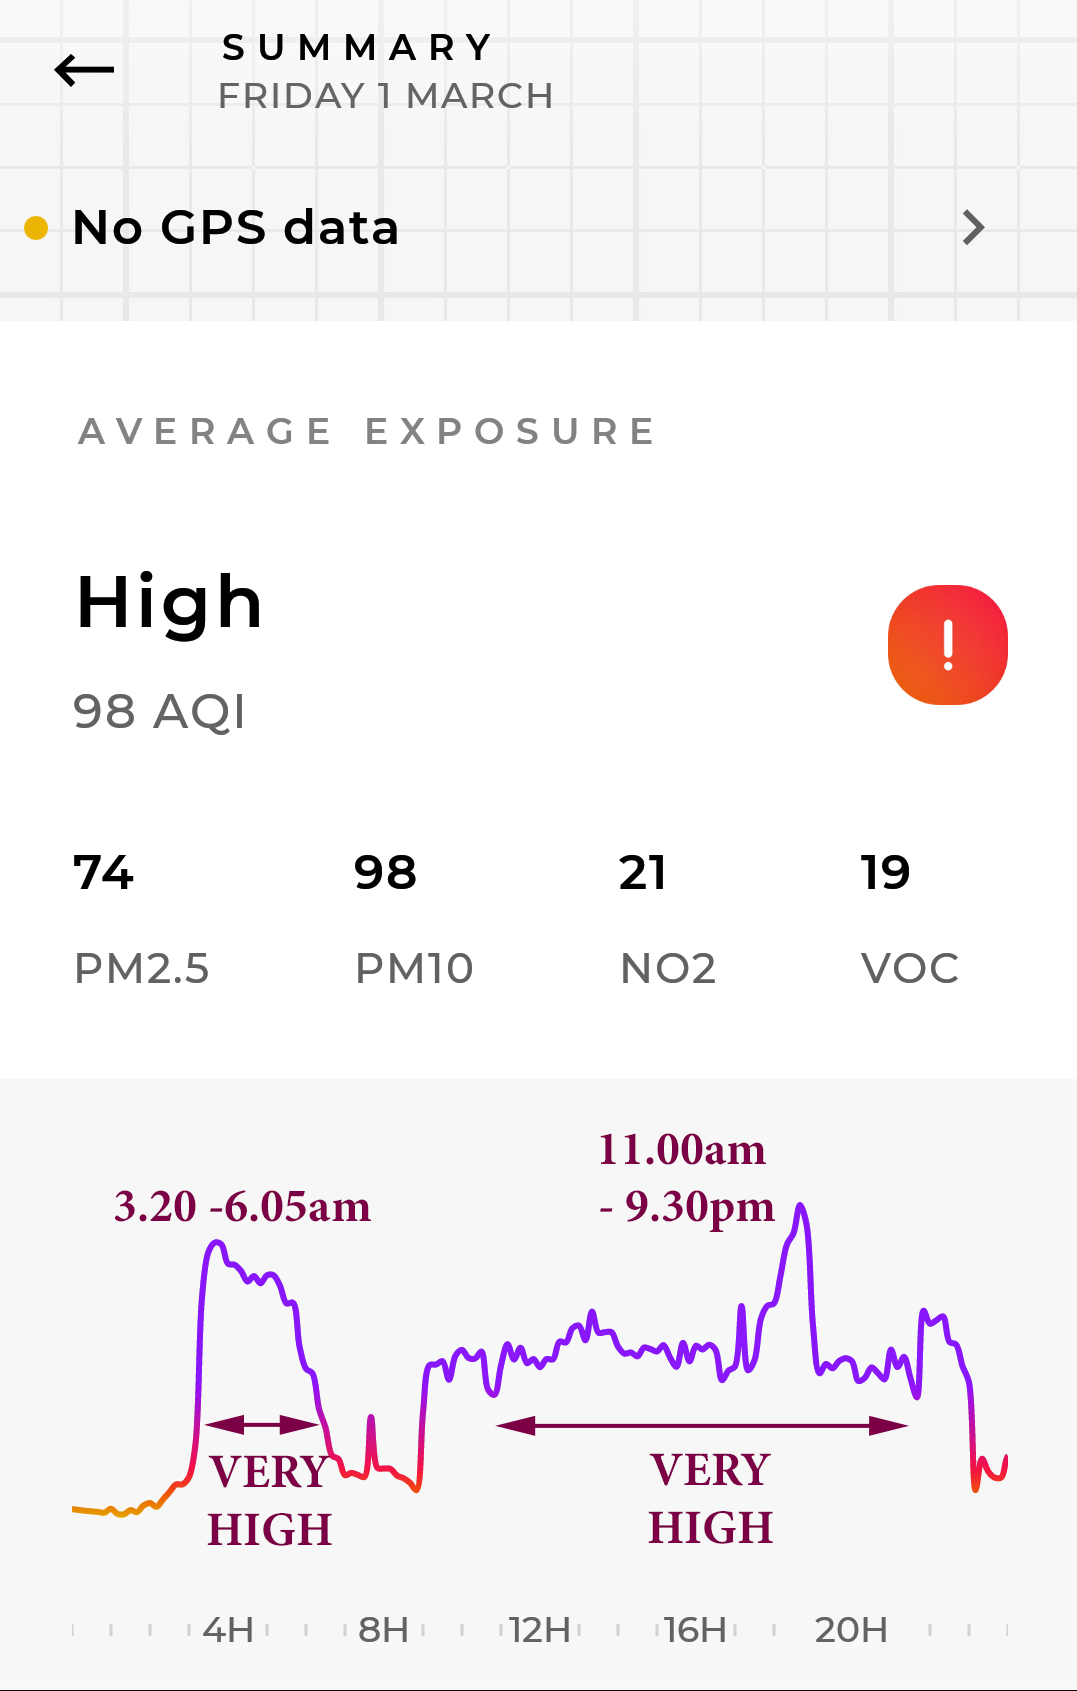
| 1 March | 74 | 98 | 21 | 19 | HIGH | Exceedance | Exceedances:- 03.20am - 06.05am - PM2.5 - PM10 - 11.00 am - 21.30pm - PM2.5 & PM10 - |
Graph; Heavy traffic. Wind veering NW - SW. Rain 2.30mm |
| 2 March NO DATA | - | - | - | - | - | NO DATA | ||
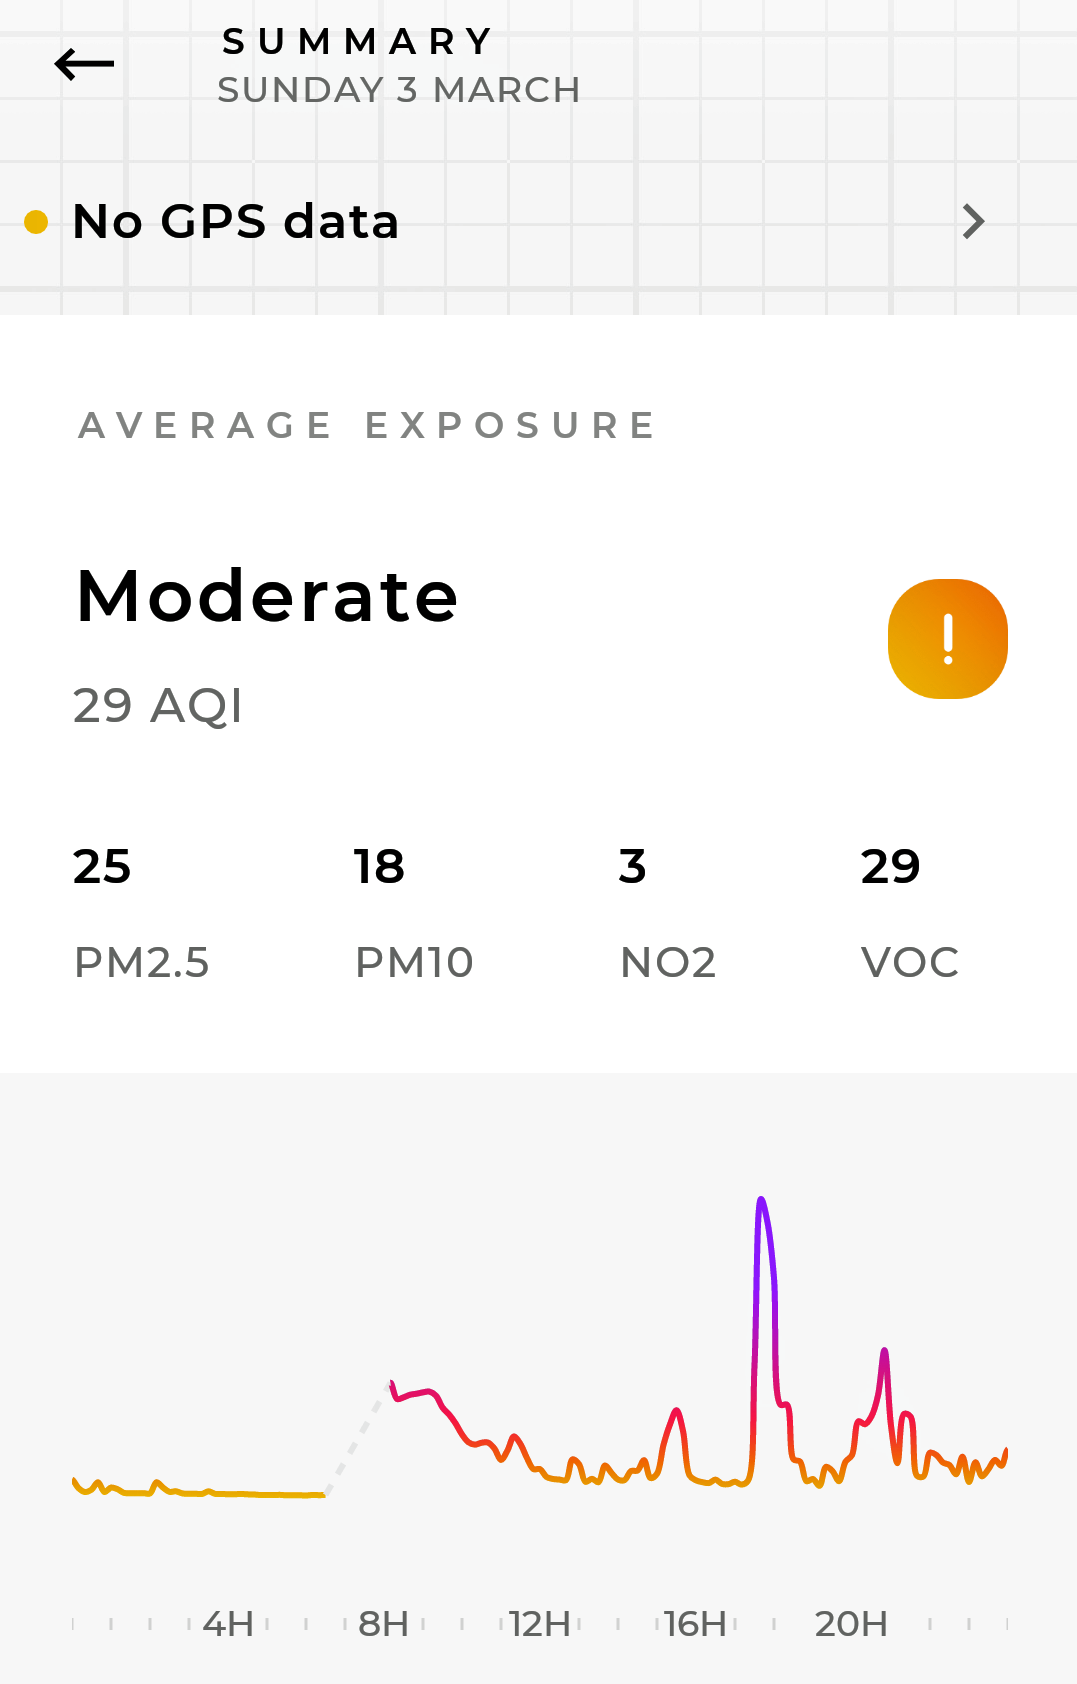
| 3 March | 25 | 18 | 3 | 29 | MODERATE | Graph; Wind SW; Rain all day 14mm. | ||
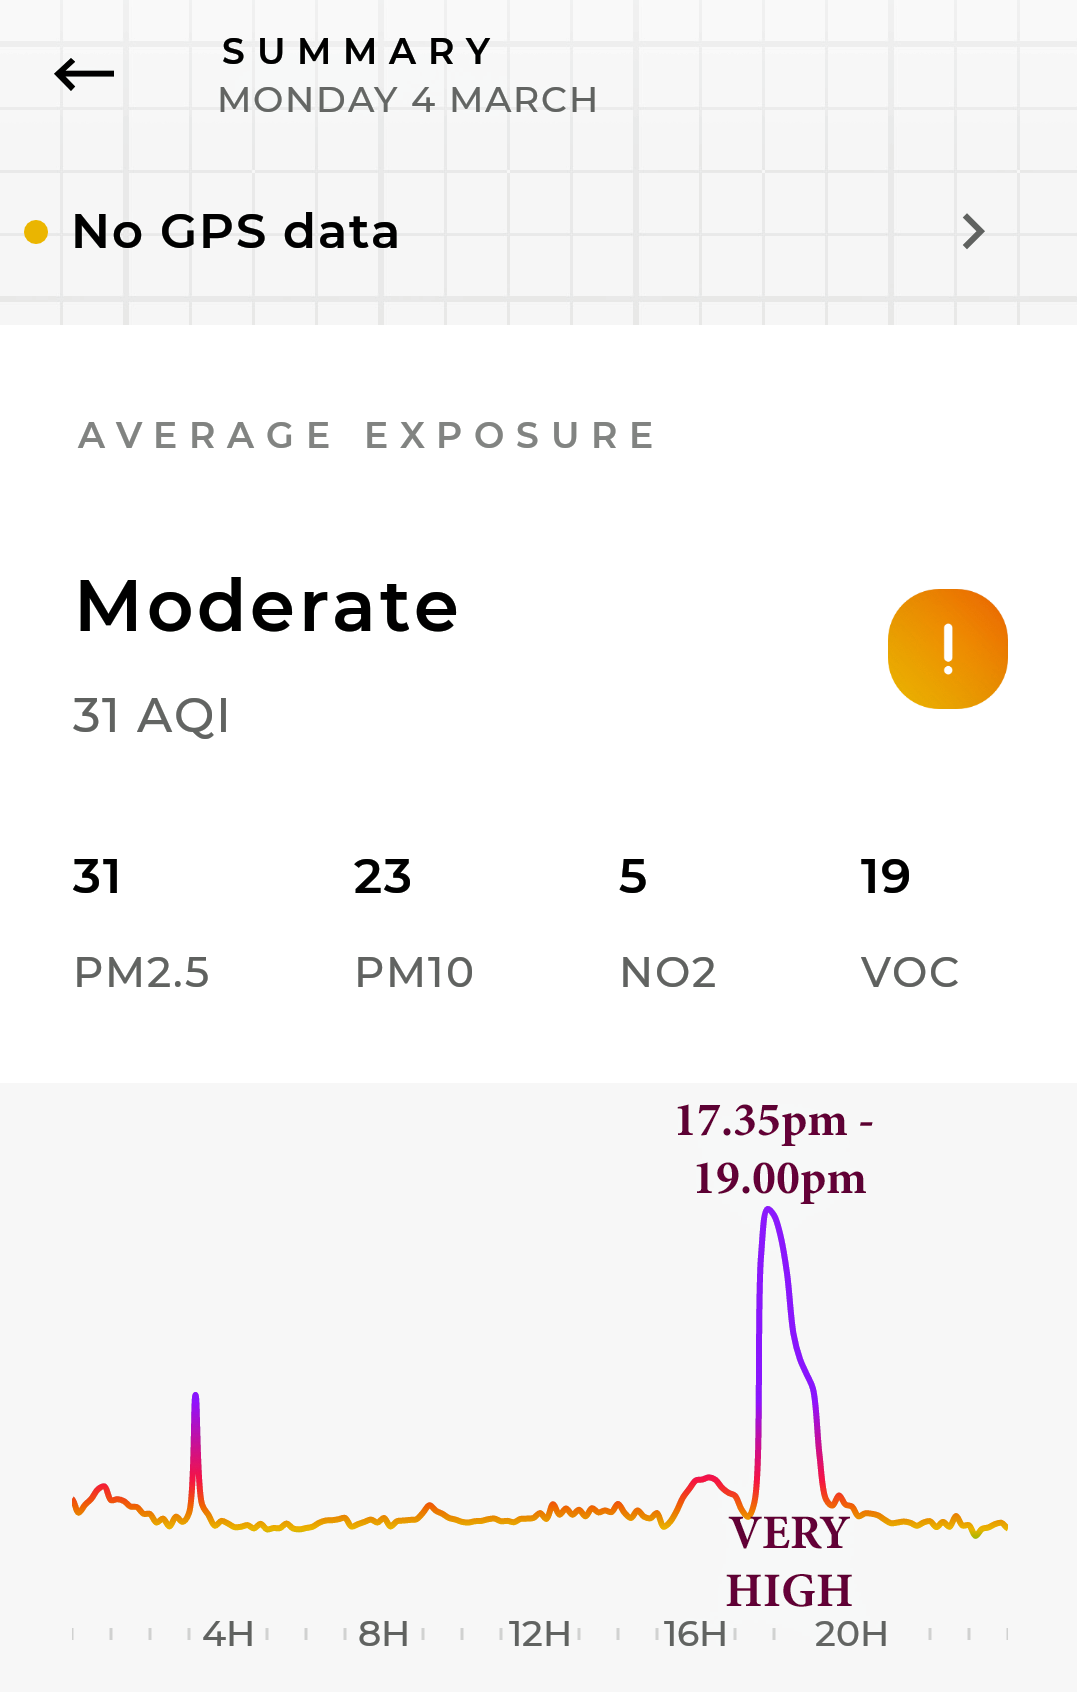
| 4 March | 31 | 23 | 5 | 19 | MODERATE | Exceedance:- 17.36pm - 18.53pm - PM2.5 & PM10 - |
Graph; Wind SW - WSW; Rain all day 13.2mm | |
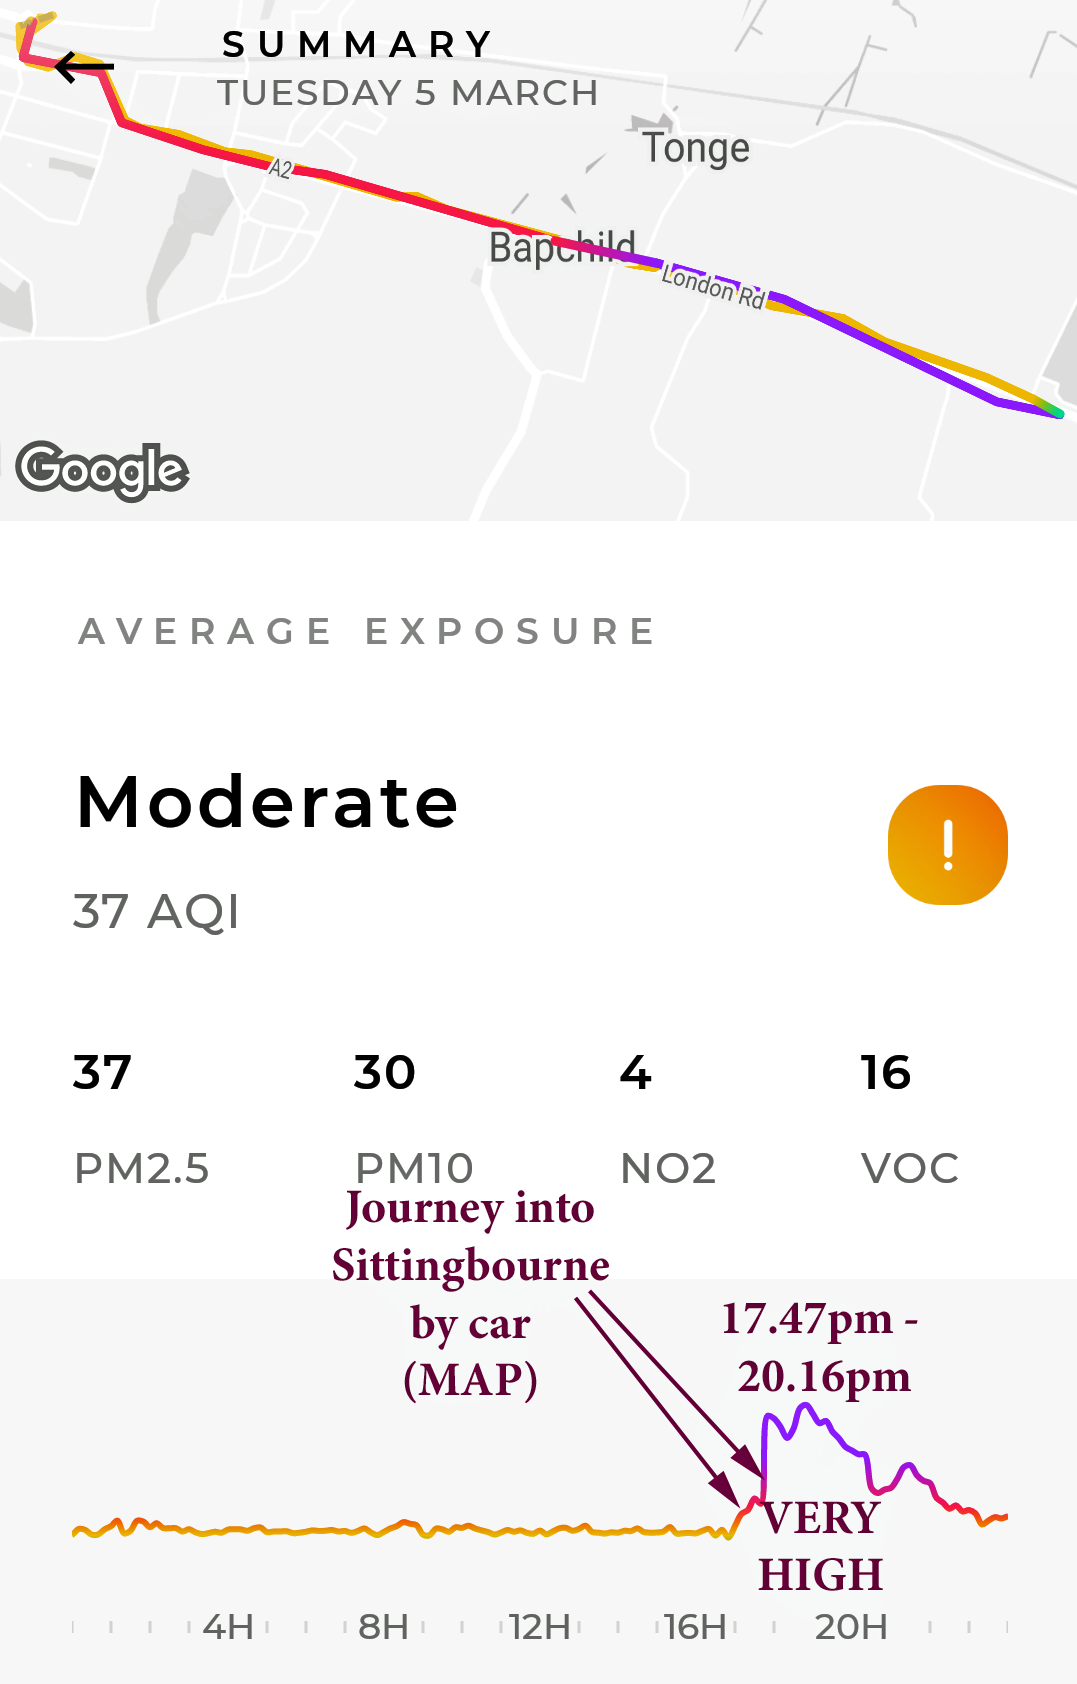
| 5 March | 37 | 30 | 4 | 16 | MODERATE | Exceedance:- 17.47pm - 20.16pm - PM2.5 & PM10 - |
Graph; Wind WSW - S. Rain evening 0.9mm | |
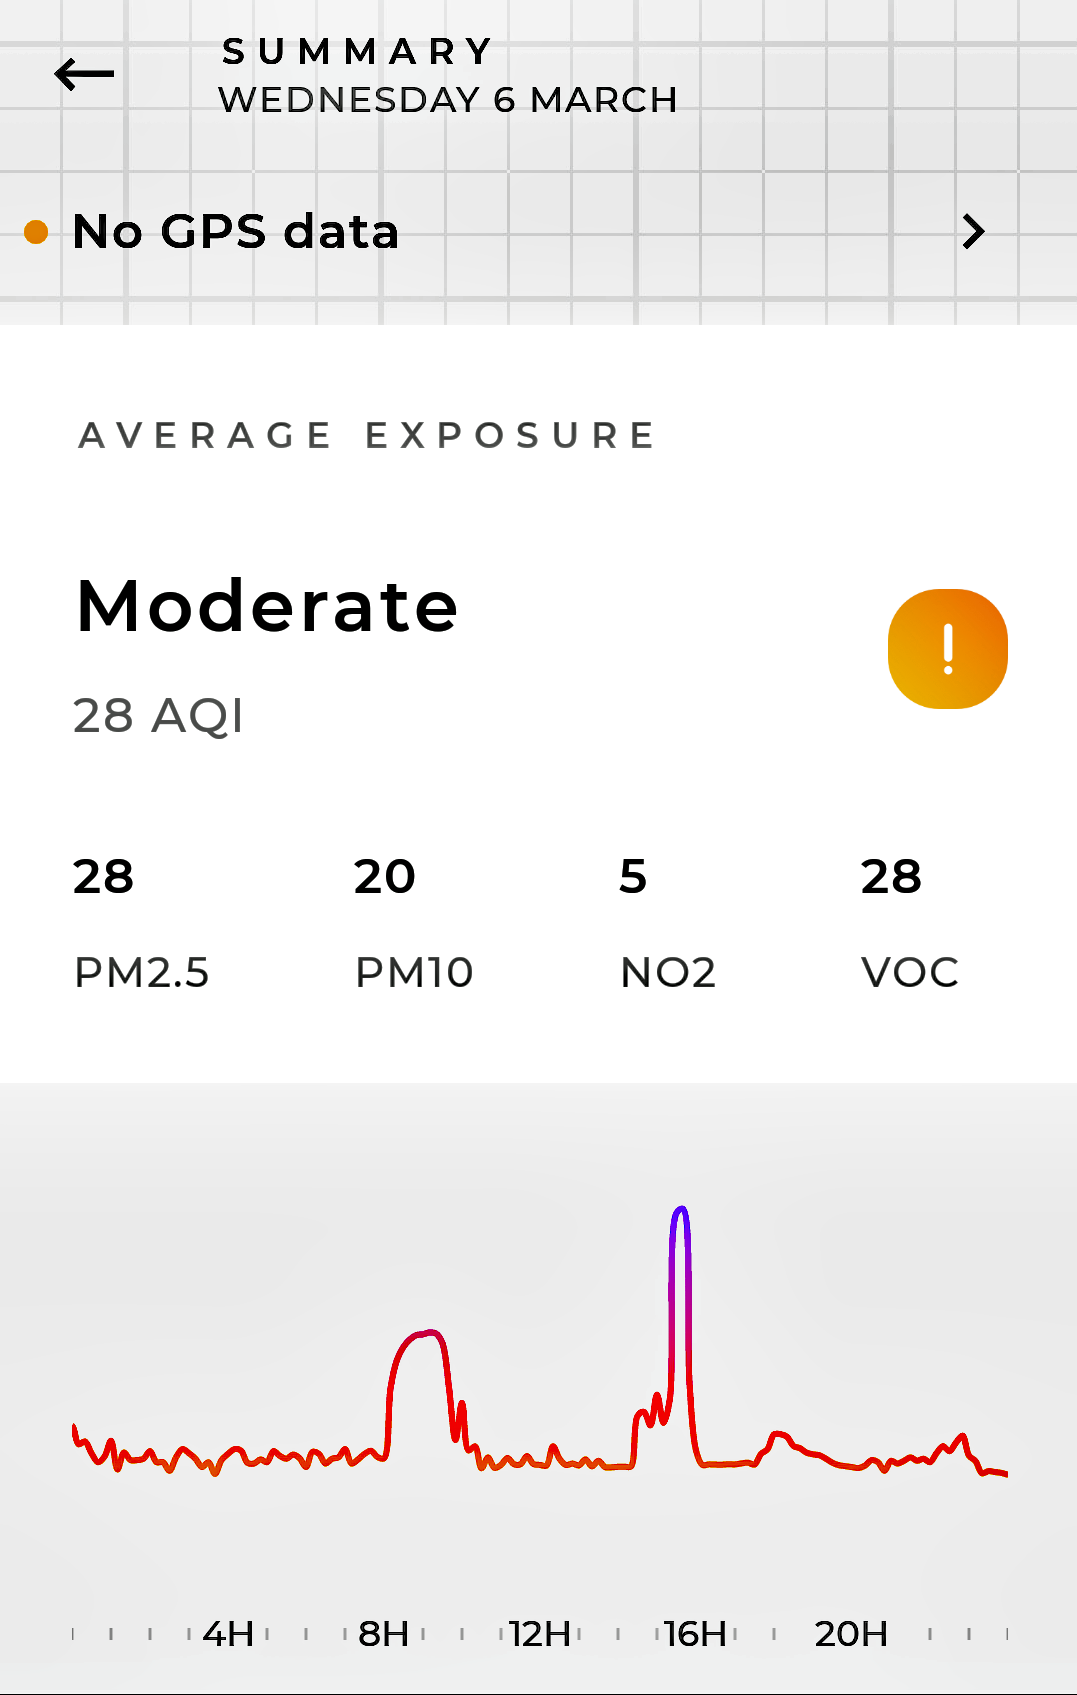
| 6 March | 28 | 20 | 5 | 28 | MODERATE | Graph; Wind S - SSW. Rain 2.9mm | ||
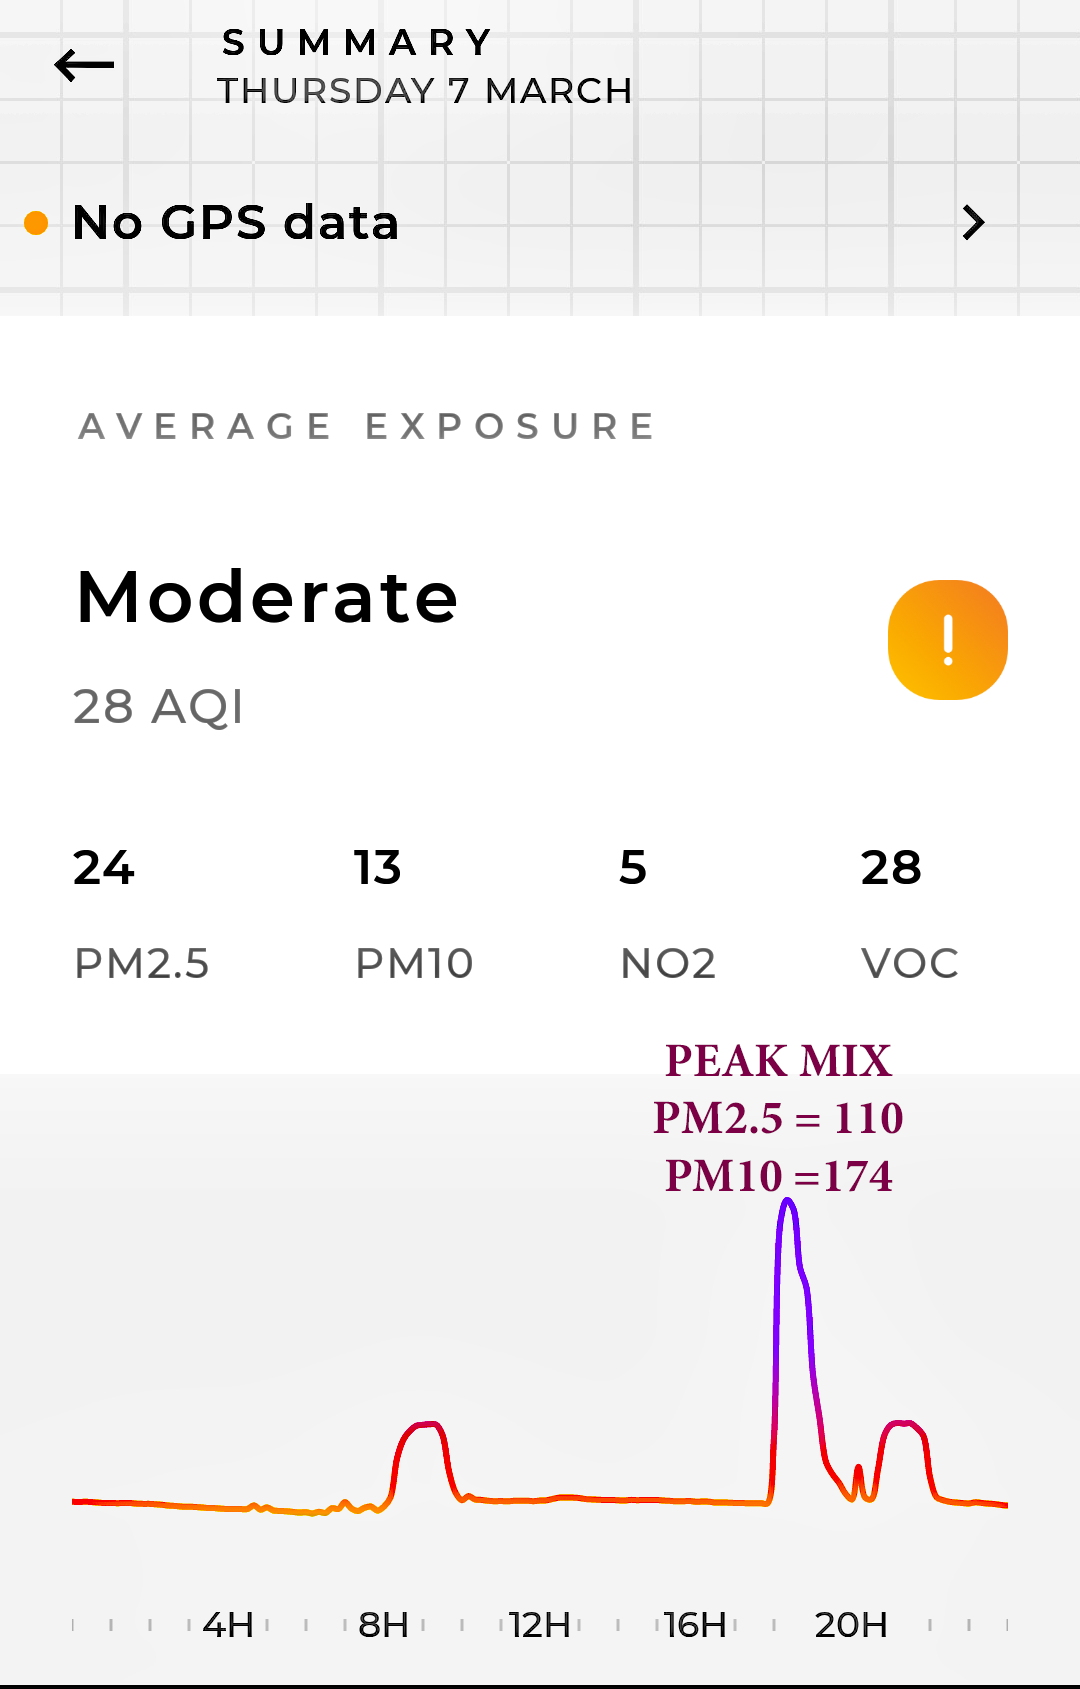
| 7 March | 24 | 13 | 5 | 28 | MODERATE | Graph; Wind SW - W (20kph). Rain 0.6mm p.m. | ||
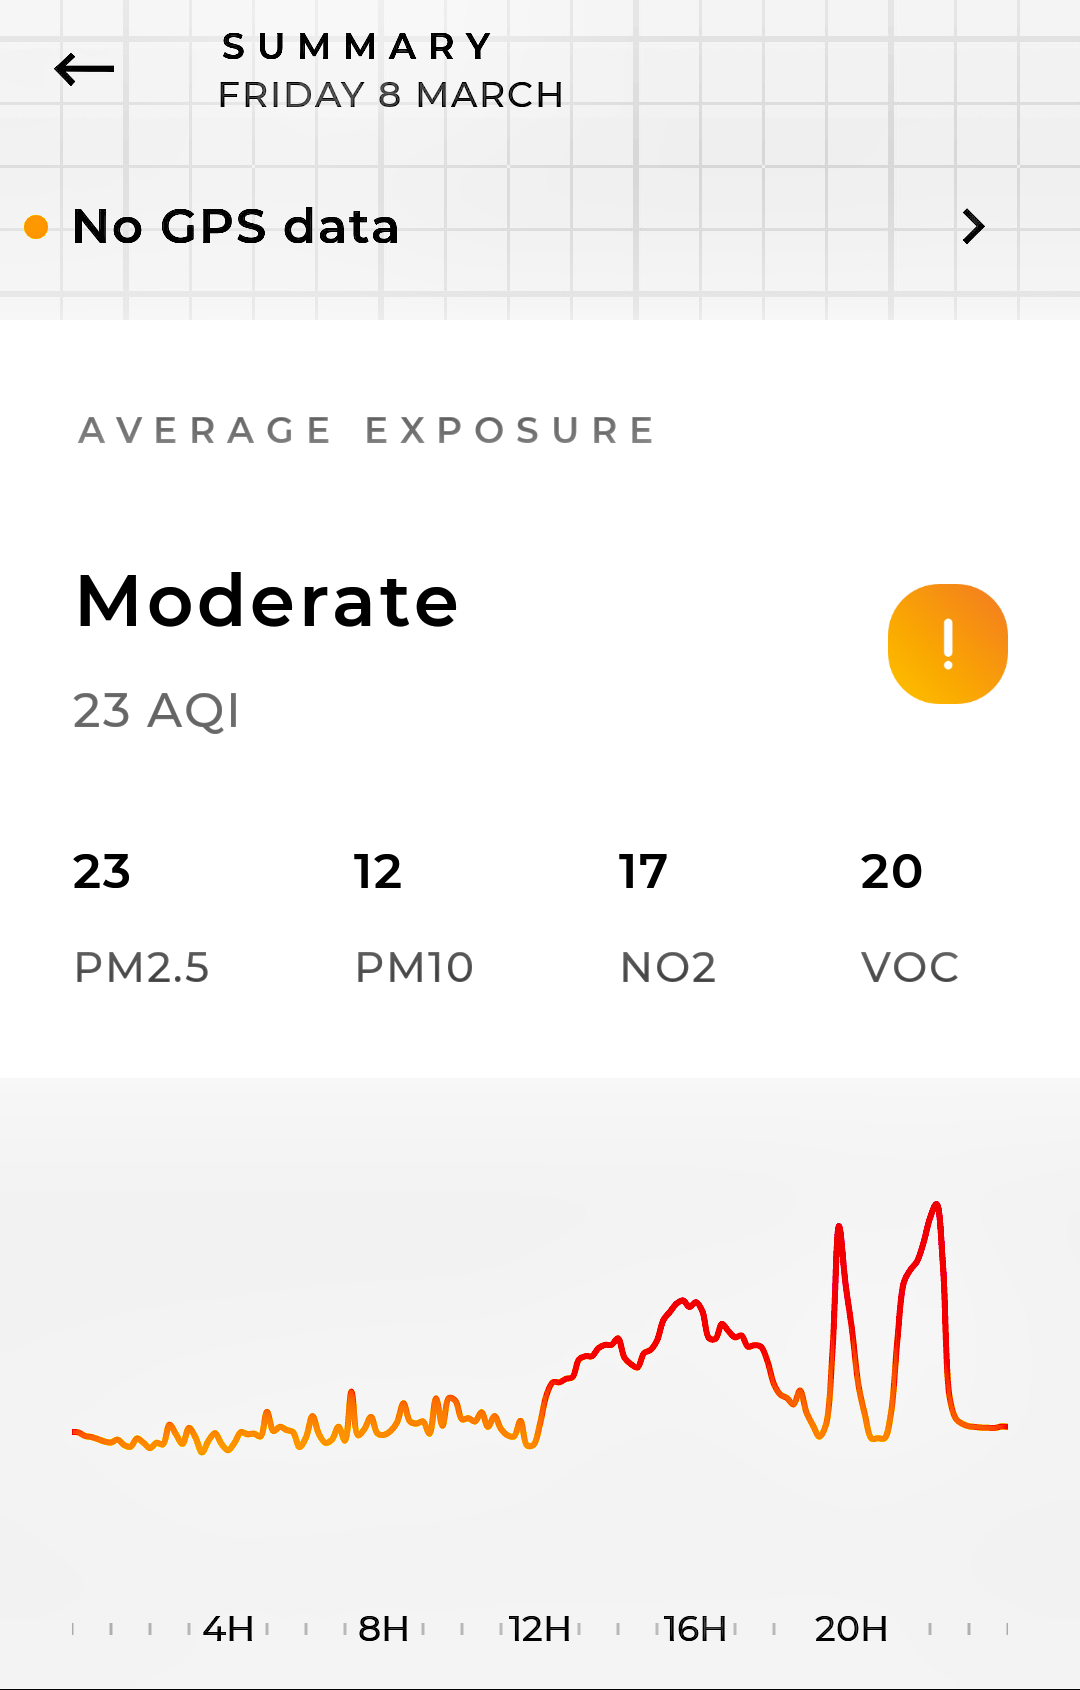
| 8 March | 23 | 12 | 17 | 20 | MODERATE | Graph; Wind W - SW. Dry | ||
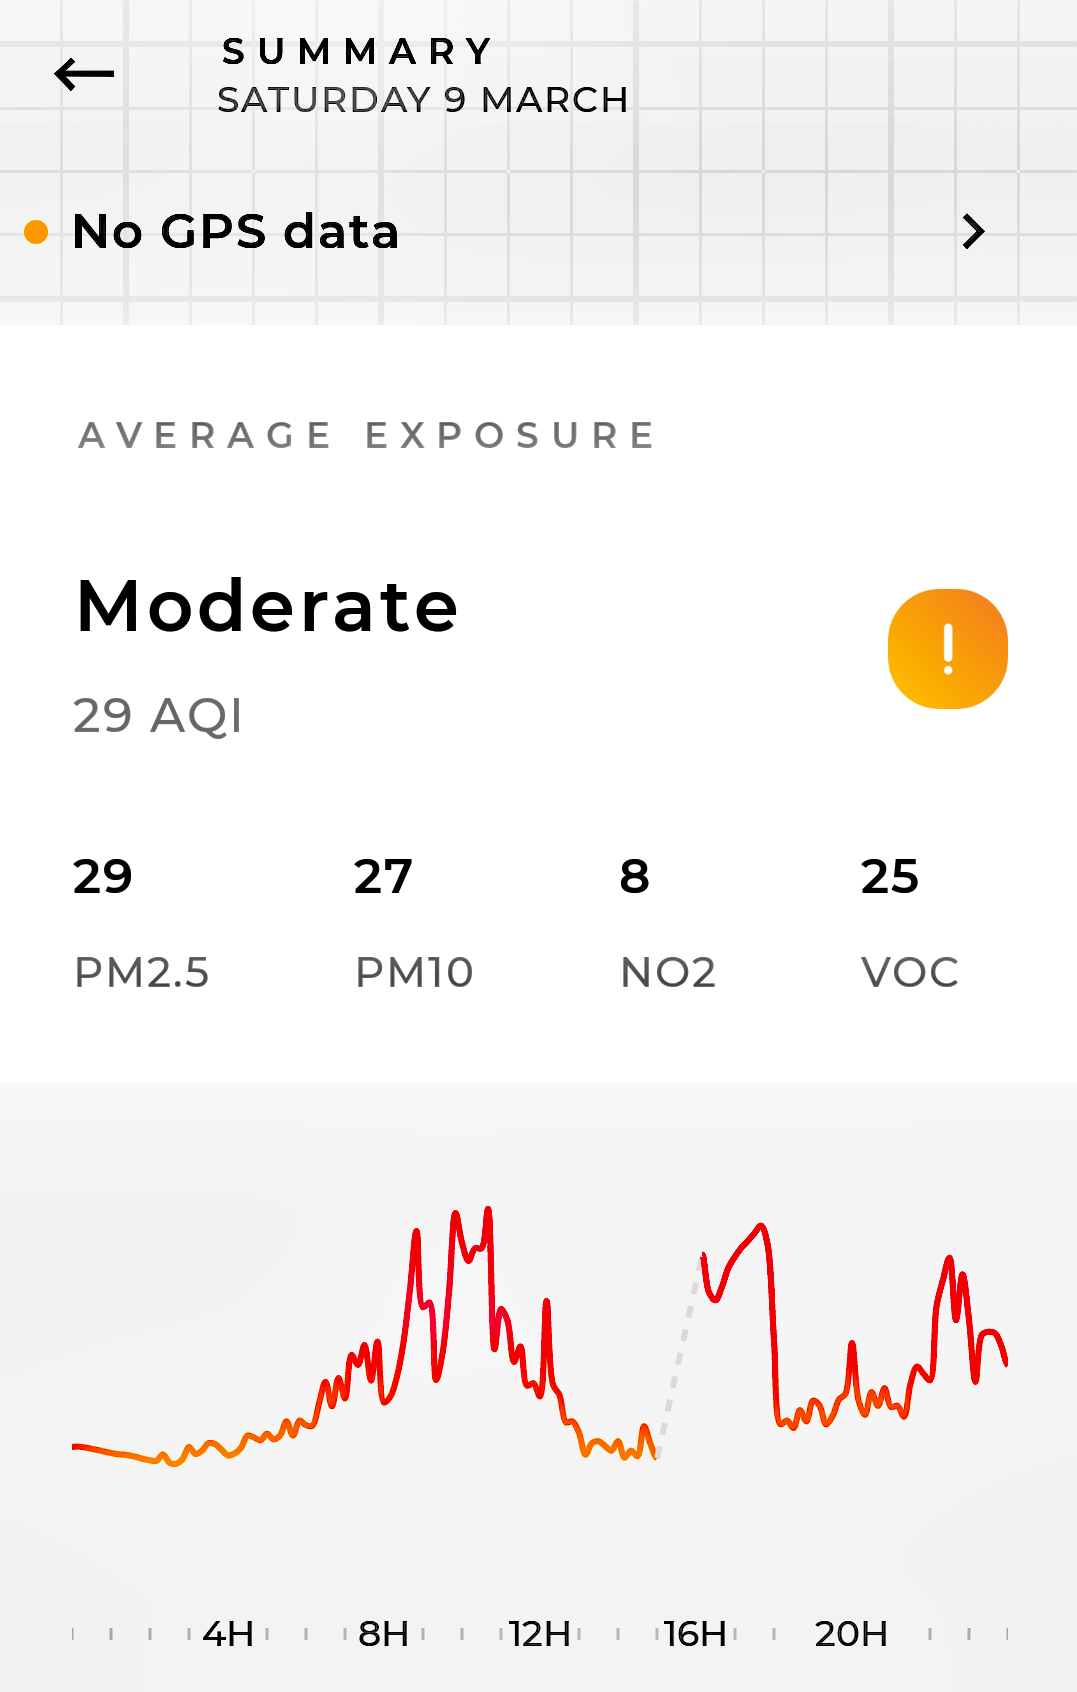
| 9 March | 29 | 27 | 8 | 25 | MODERATE | Graph; Wind SW - W. Rain 0.5mm | ||
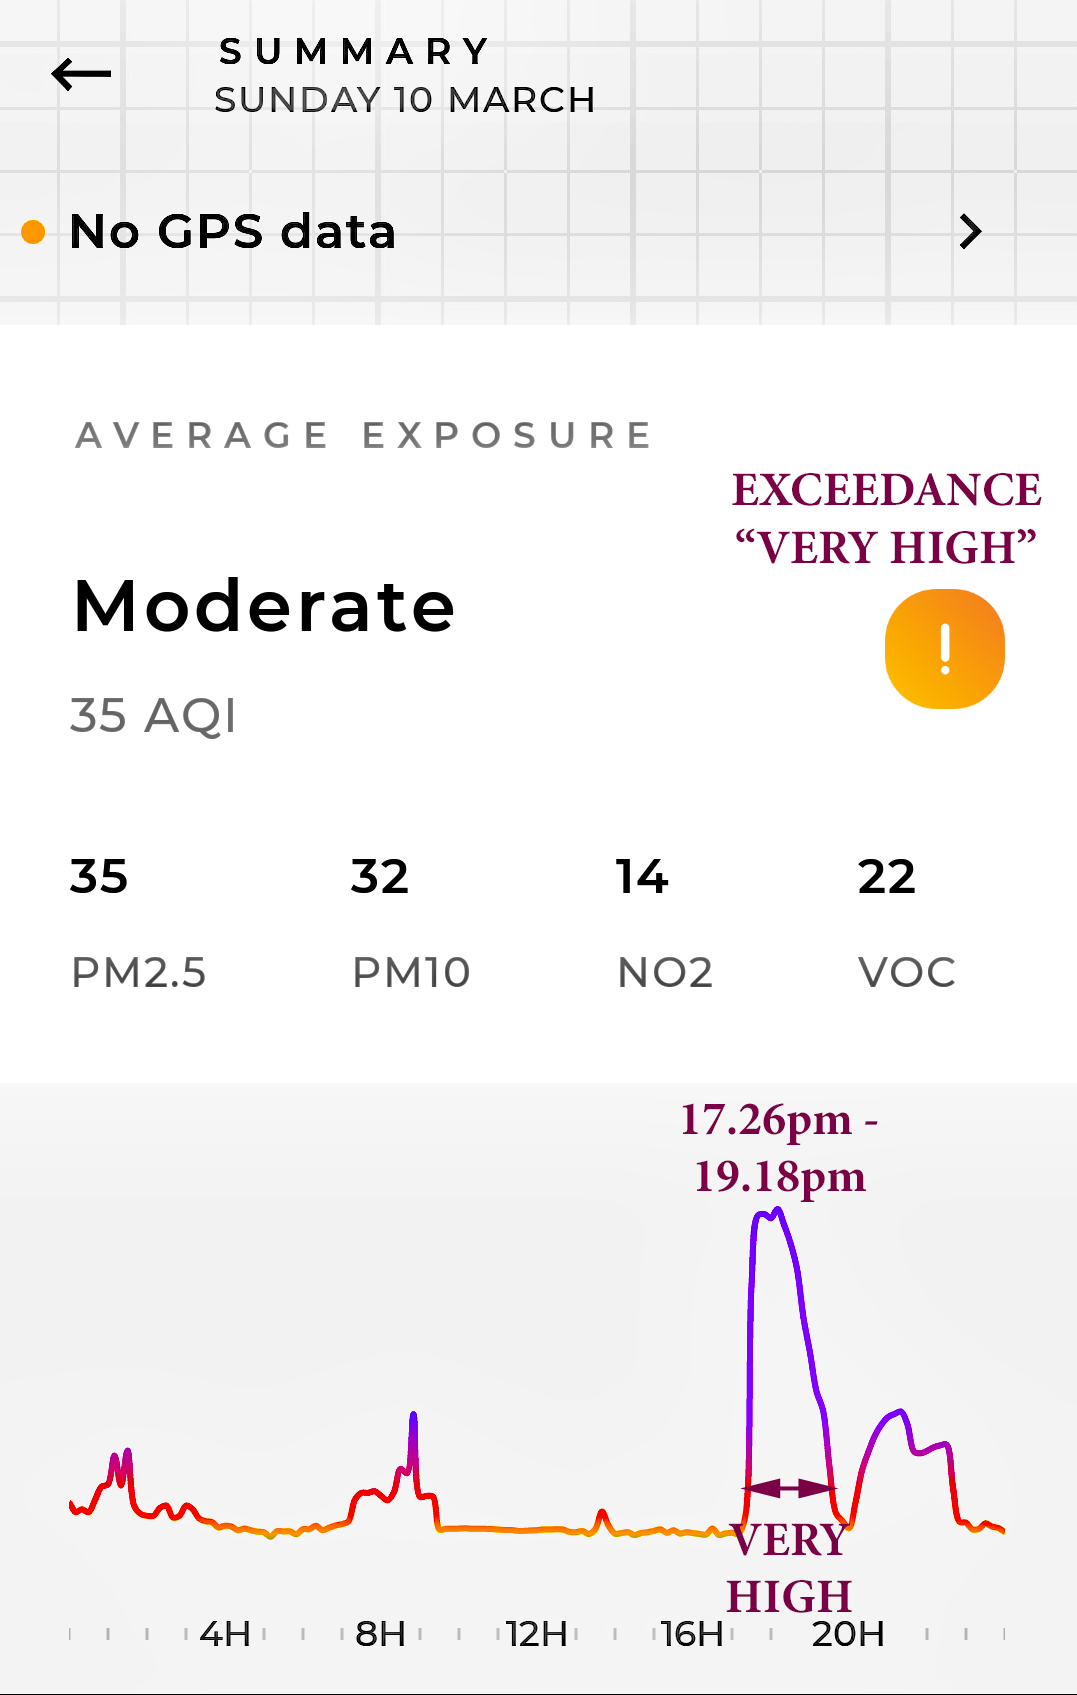
| 10 March | 35 | 32 | 14 | 22 | MODERATE | Exceedance:- 17.26pm - 19.18pm - PM2.5 & PM10 - |
Graph; Wind S - W. Rain 13.1mm (morning) | |
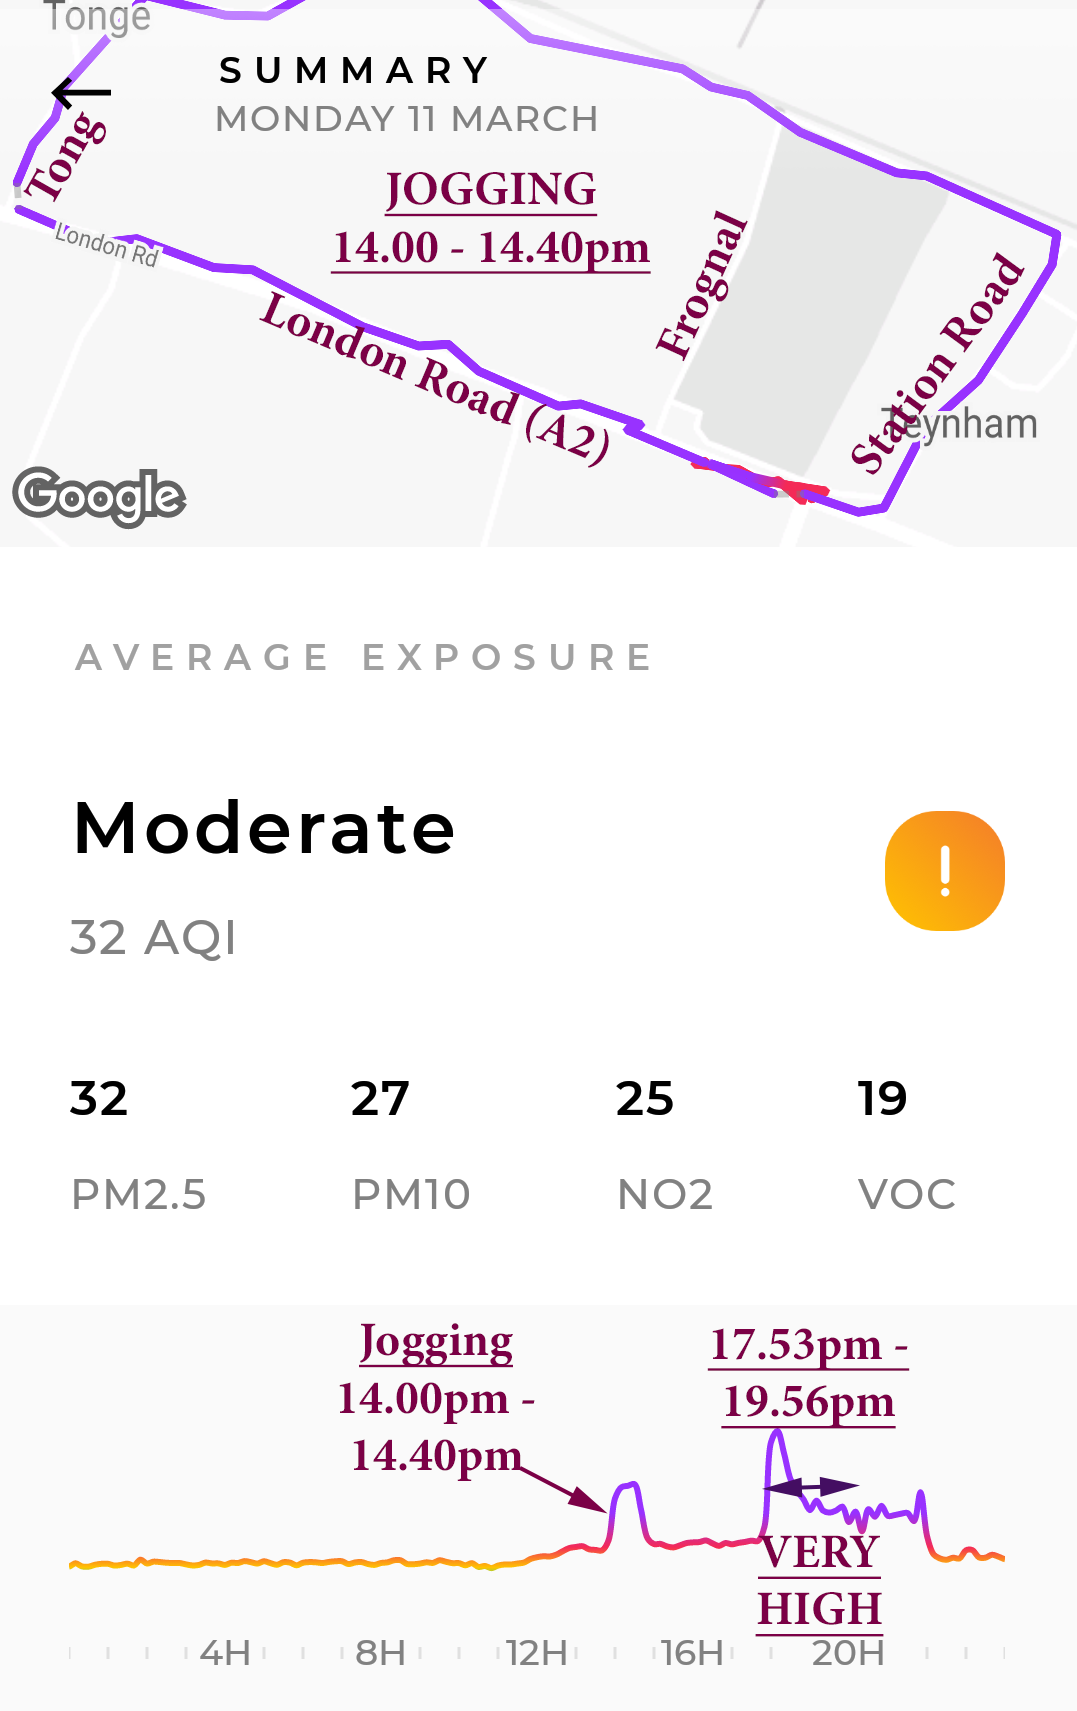
| 11 March | 32 | 27 | 25 | 19 | MODERATE | Exceedance:- 17.53pm - 19.56pm - PM2.5 & PM10 - |
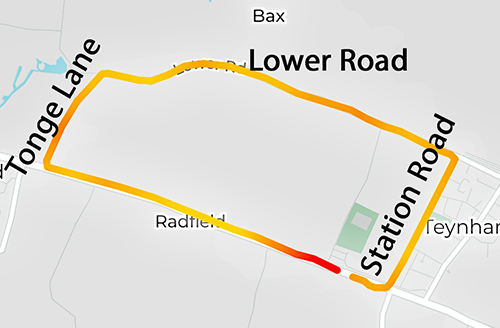
Graph with Map to Lower Road. Wind W - NW - SW (25kph). Dry. | |
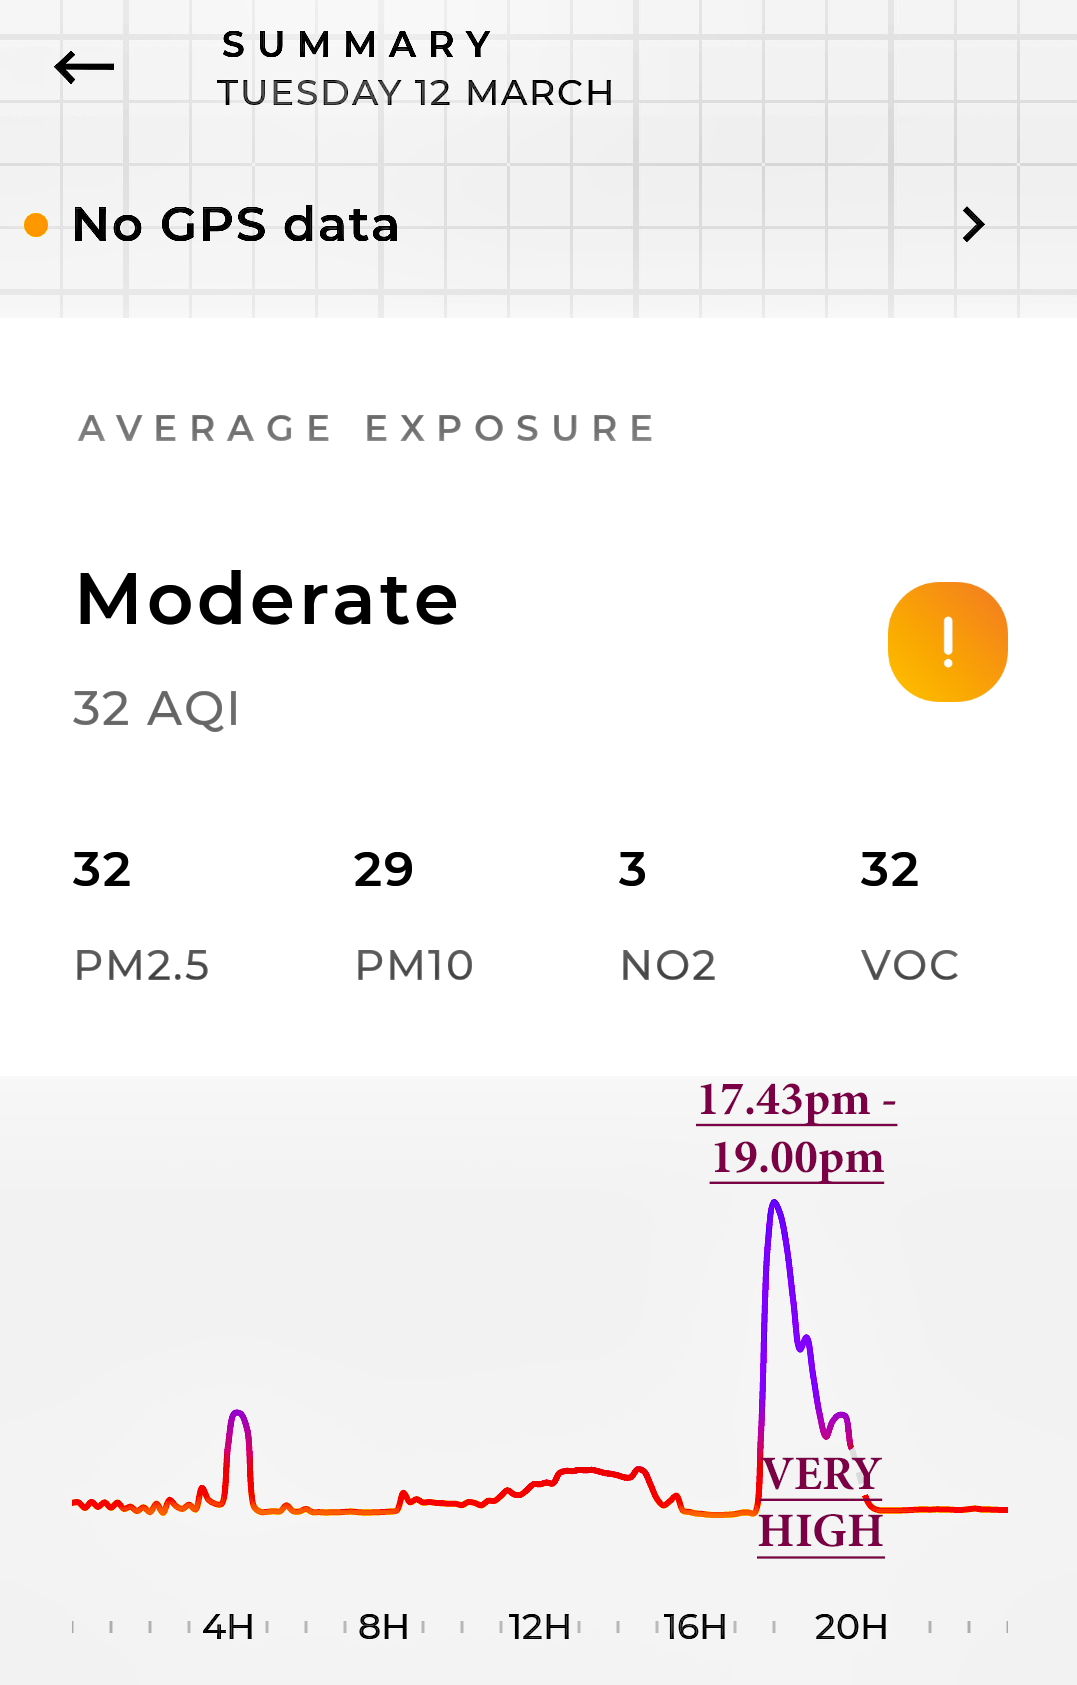
| 12 March | 32 | 29 | 3 | 32 | MODERATE | Exceedance:- 17.43pm - 19.00pm - PM2.5 & PM 10 - |
Graph; Wind SSW - WSW. Rain 17.20mm (all day) | |
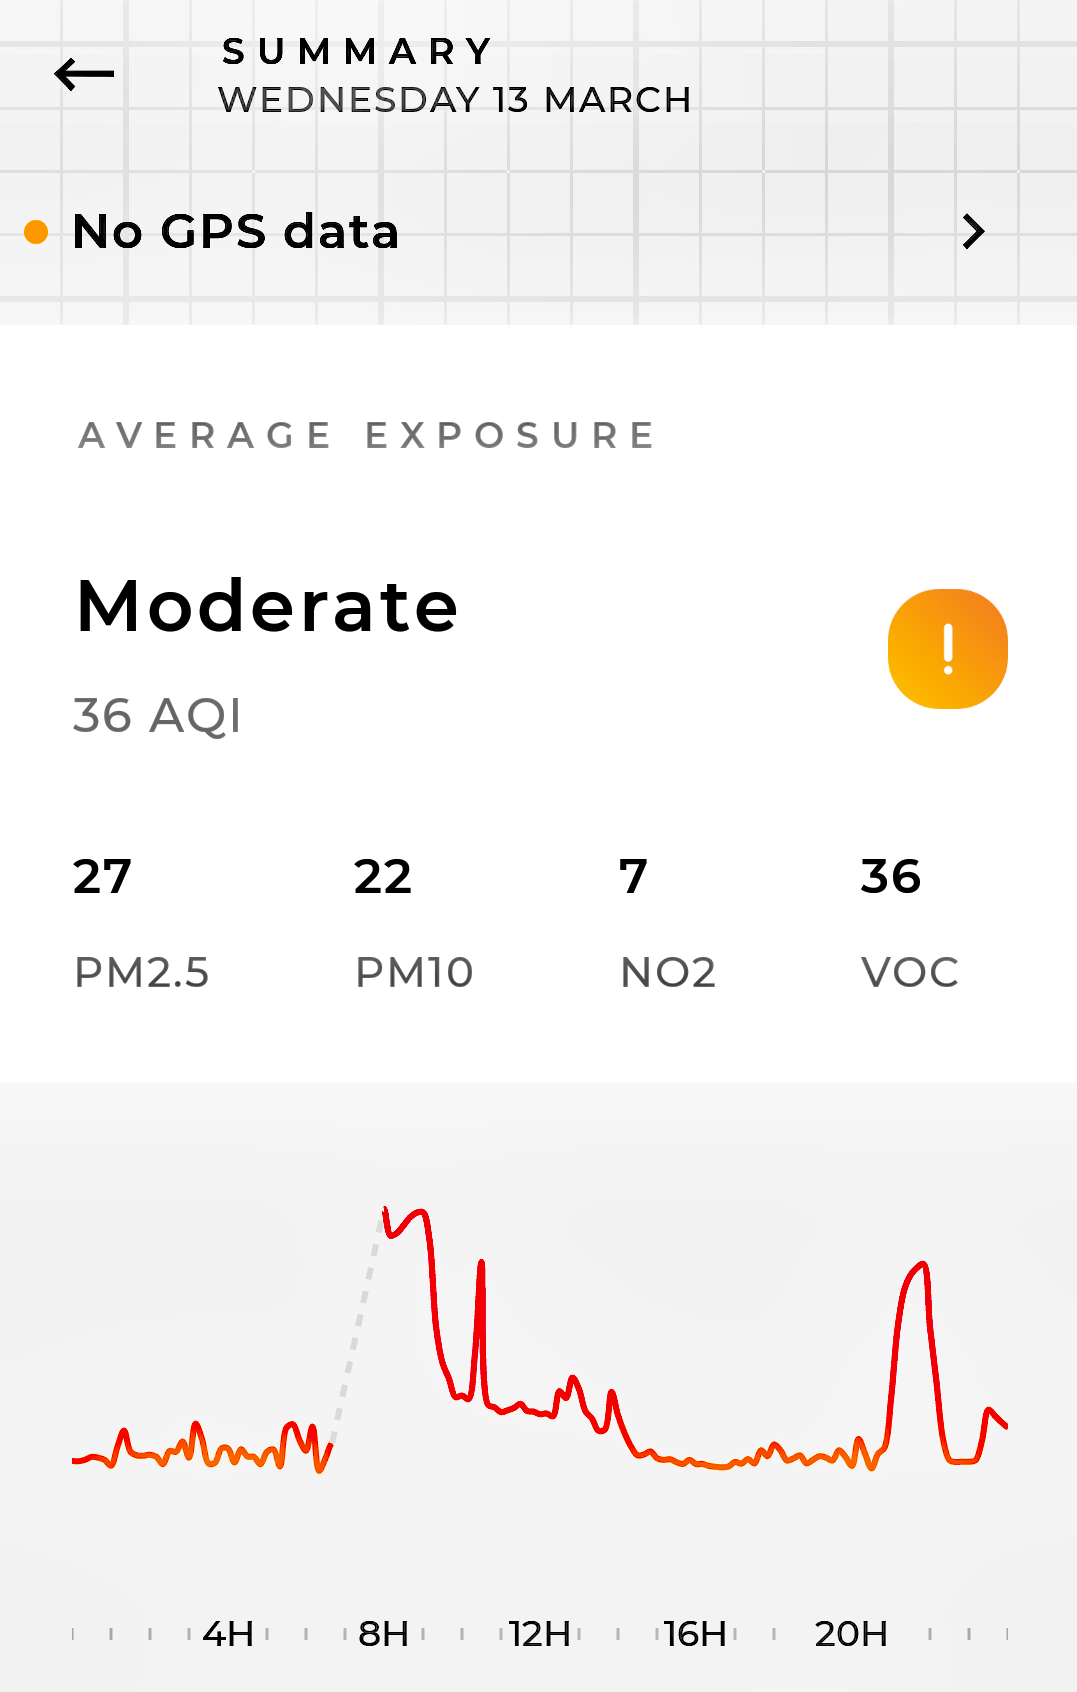
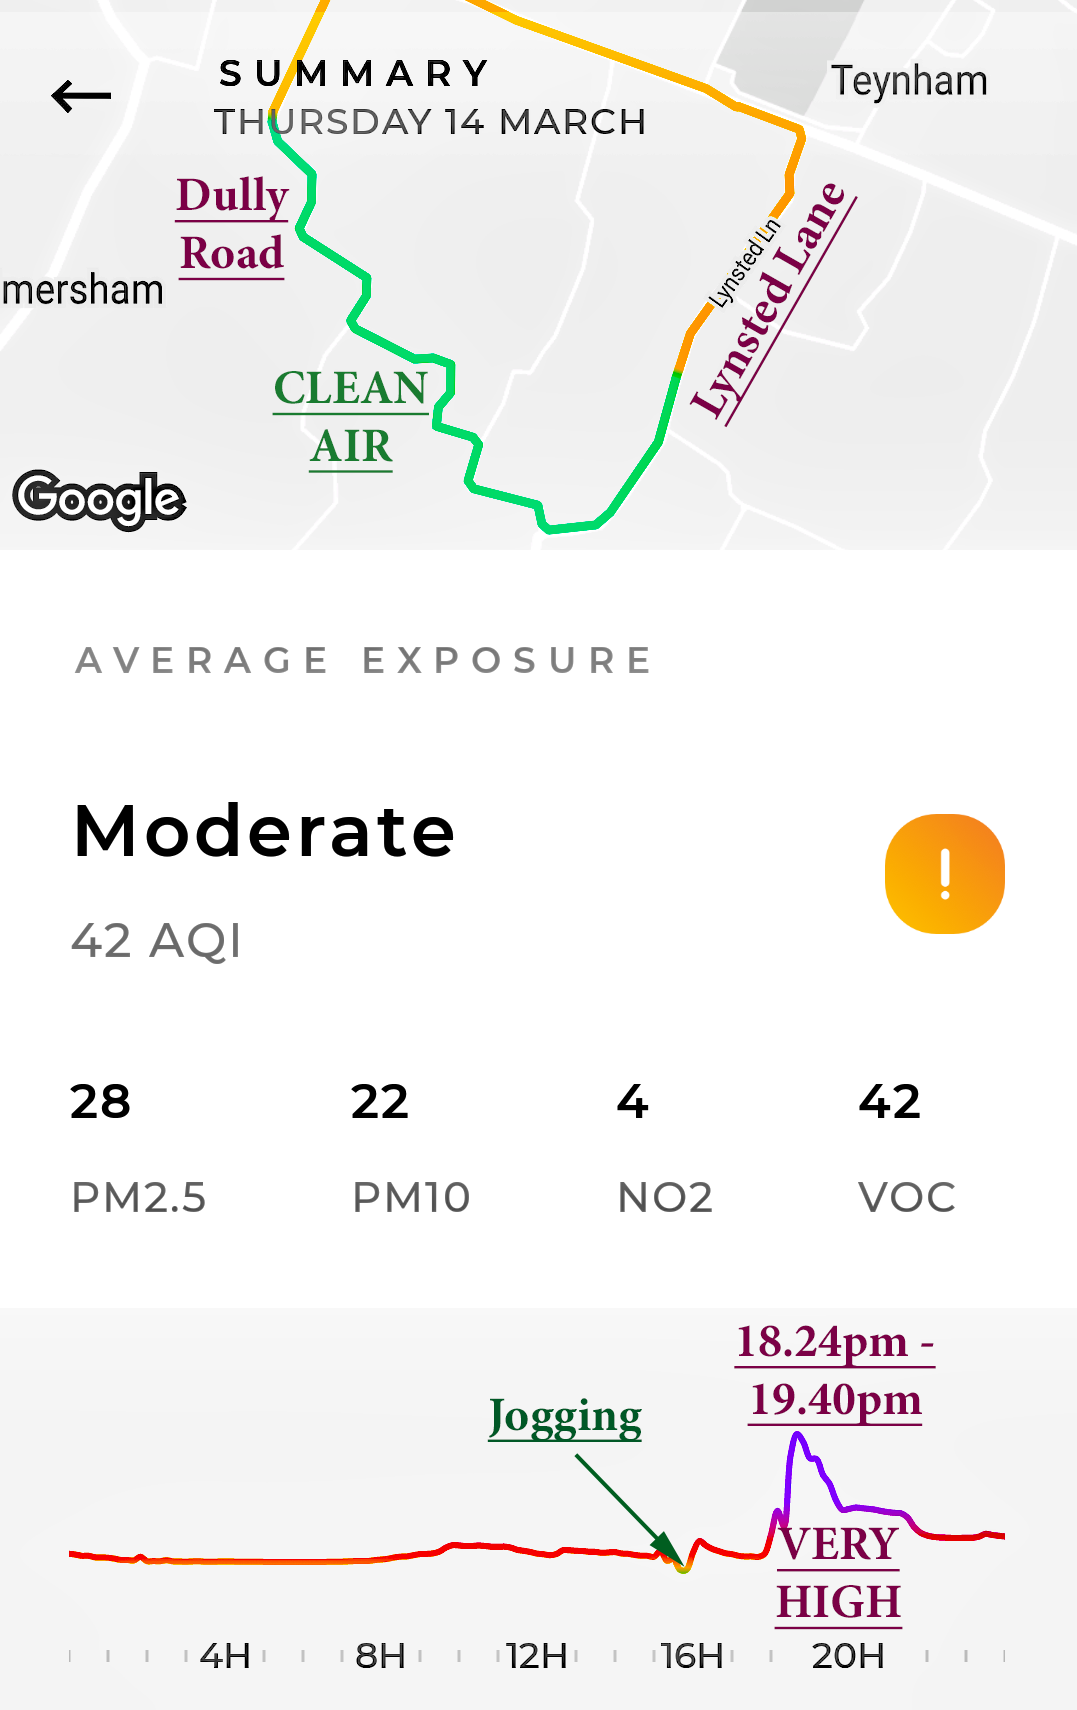
| 13 March | 27 | 22 | 7 | 36 | MODERATE | Graph; Wind WSW - W (35kph); Rain 1.5mm (pm) | ||
| 14 March | 28 | 22 | 4 | 42 | MODERATE | Exceedance:- 18.24pm - 19.40pm - PM2.5 & PM10 - |
Graph & Map (Dully Road-Lynsted Lane); Wind W - WSW. Rain 4.6mm | |
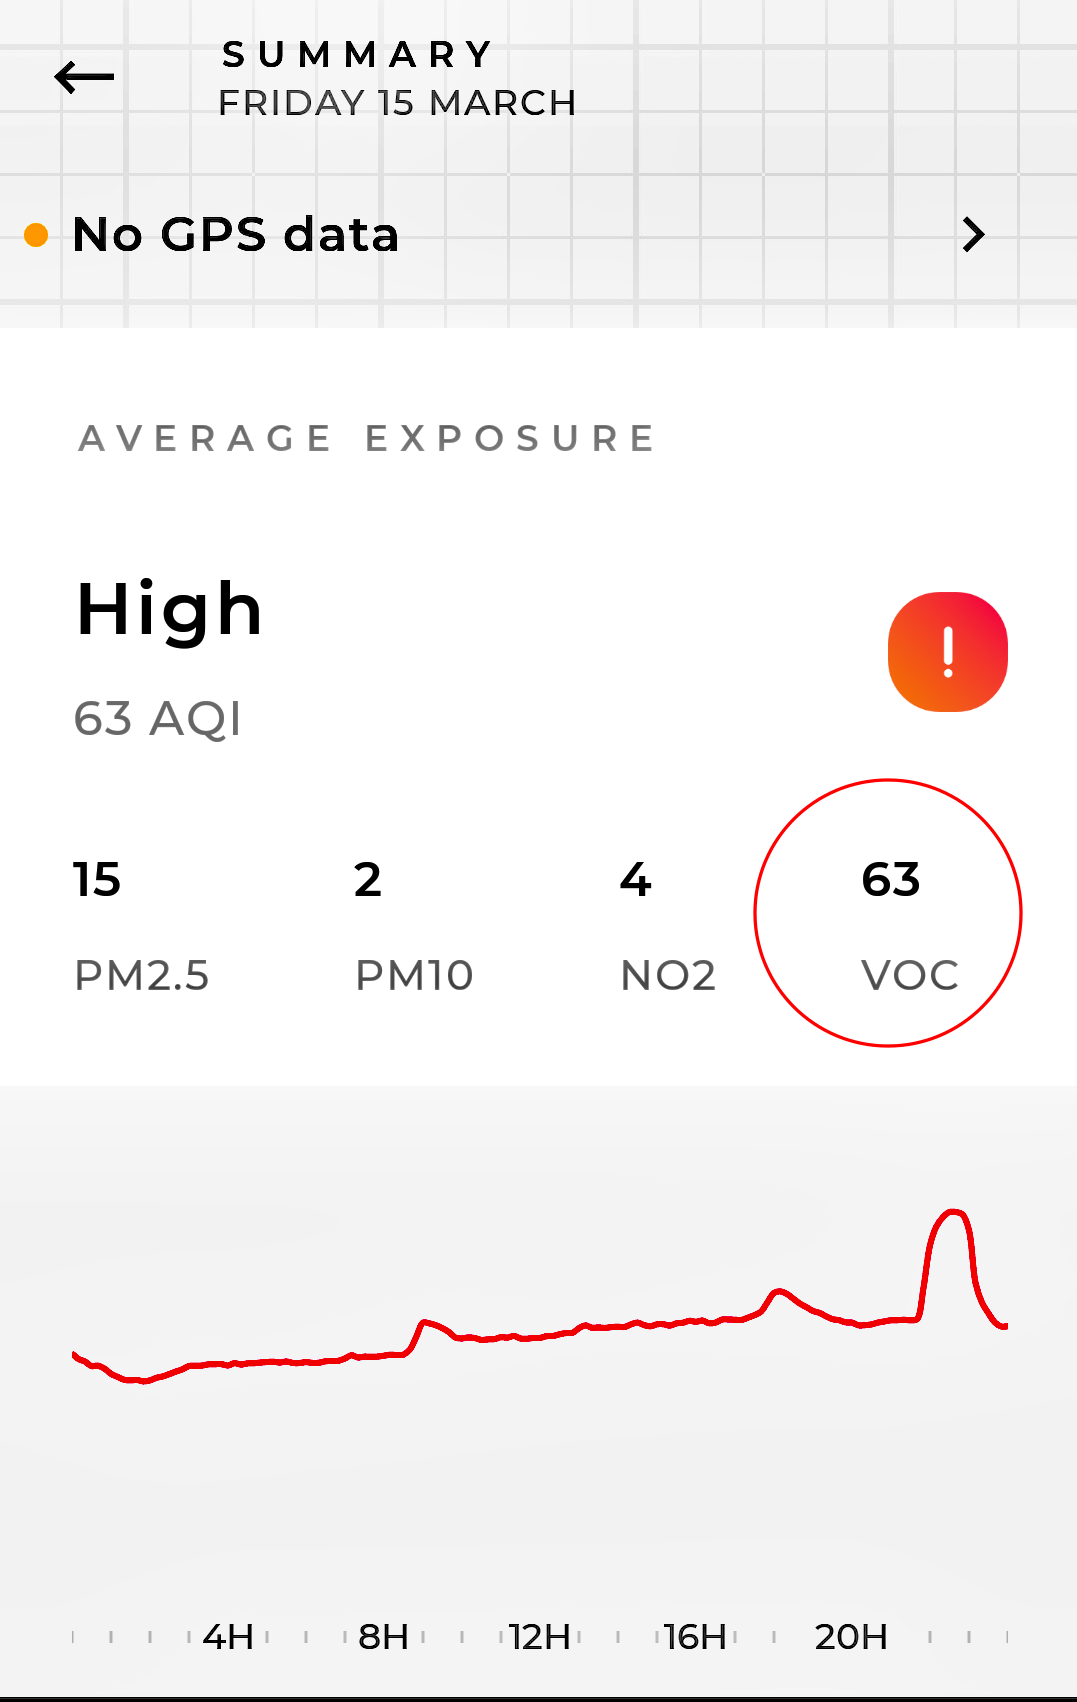
| 15 March | 15 | 2 | 4 | 63 | HIGH | Exceedance | Graph; Wind SW - W - WSW (30kph). Rain 8.6mm (all day) | |
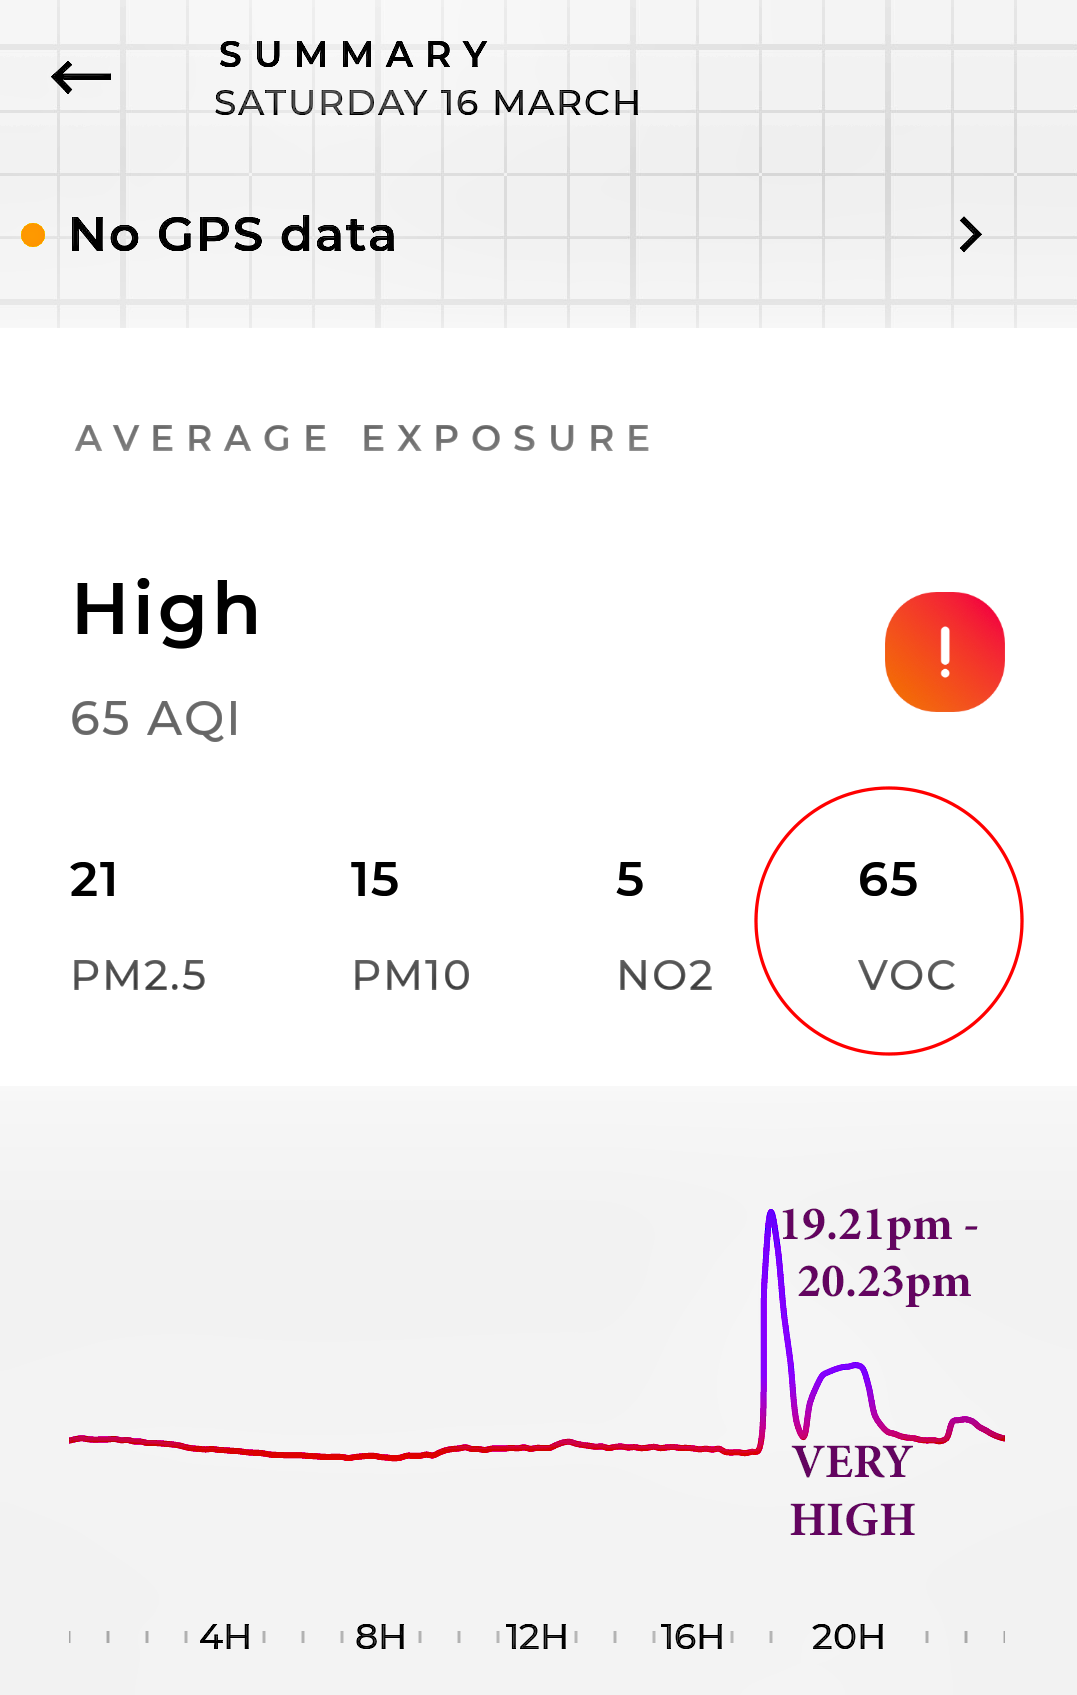
| 16 March | 21 | 15 | 5 | 65 | HIGH | Exceedance | Exceedance:- 19.21pm - 20.23pm - VOCs - |
Graph; Wind WSW - W. Rain 6.50mm (all day). |
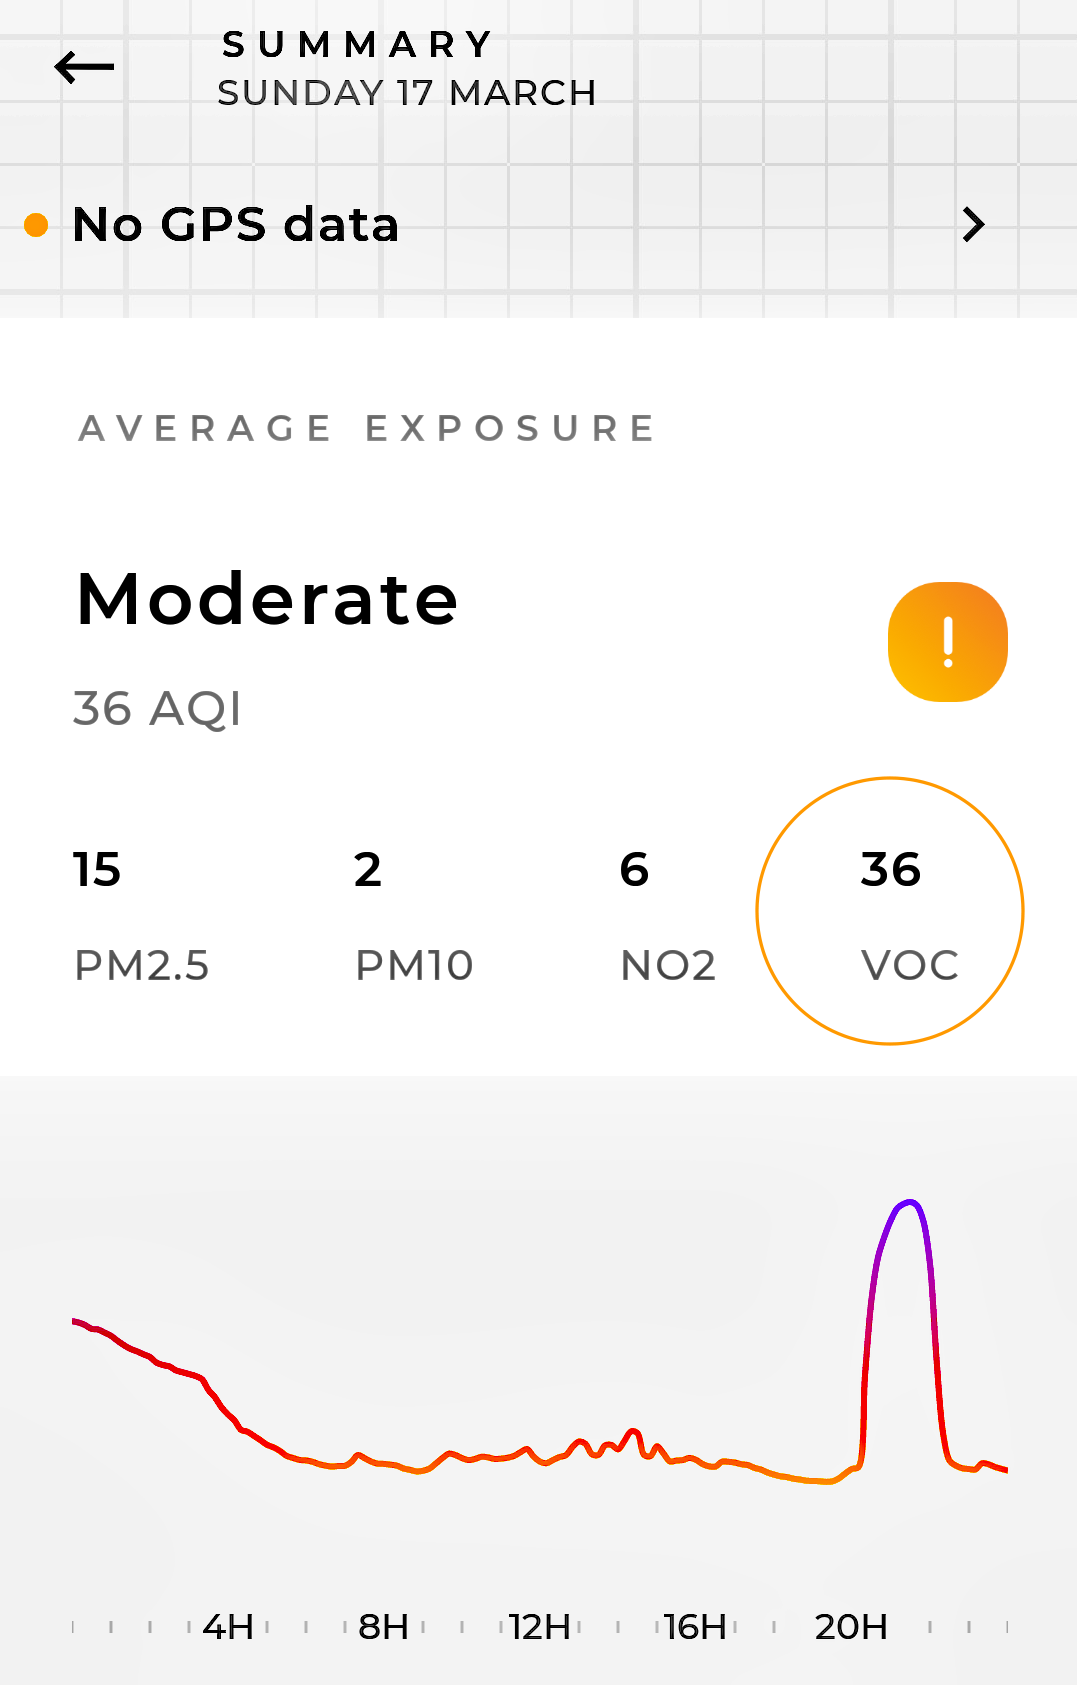
| 17 March | 15 | 2 | 6 | 36 | MODERATE | Graph; Wind SW - W. 7.70mm (am & pm) |
||
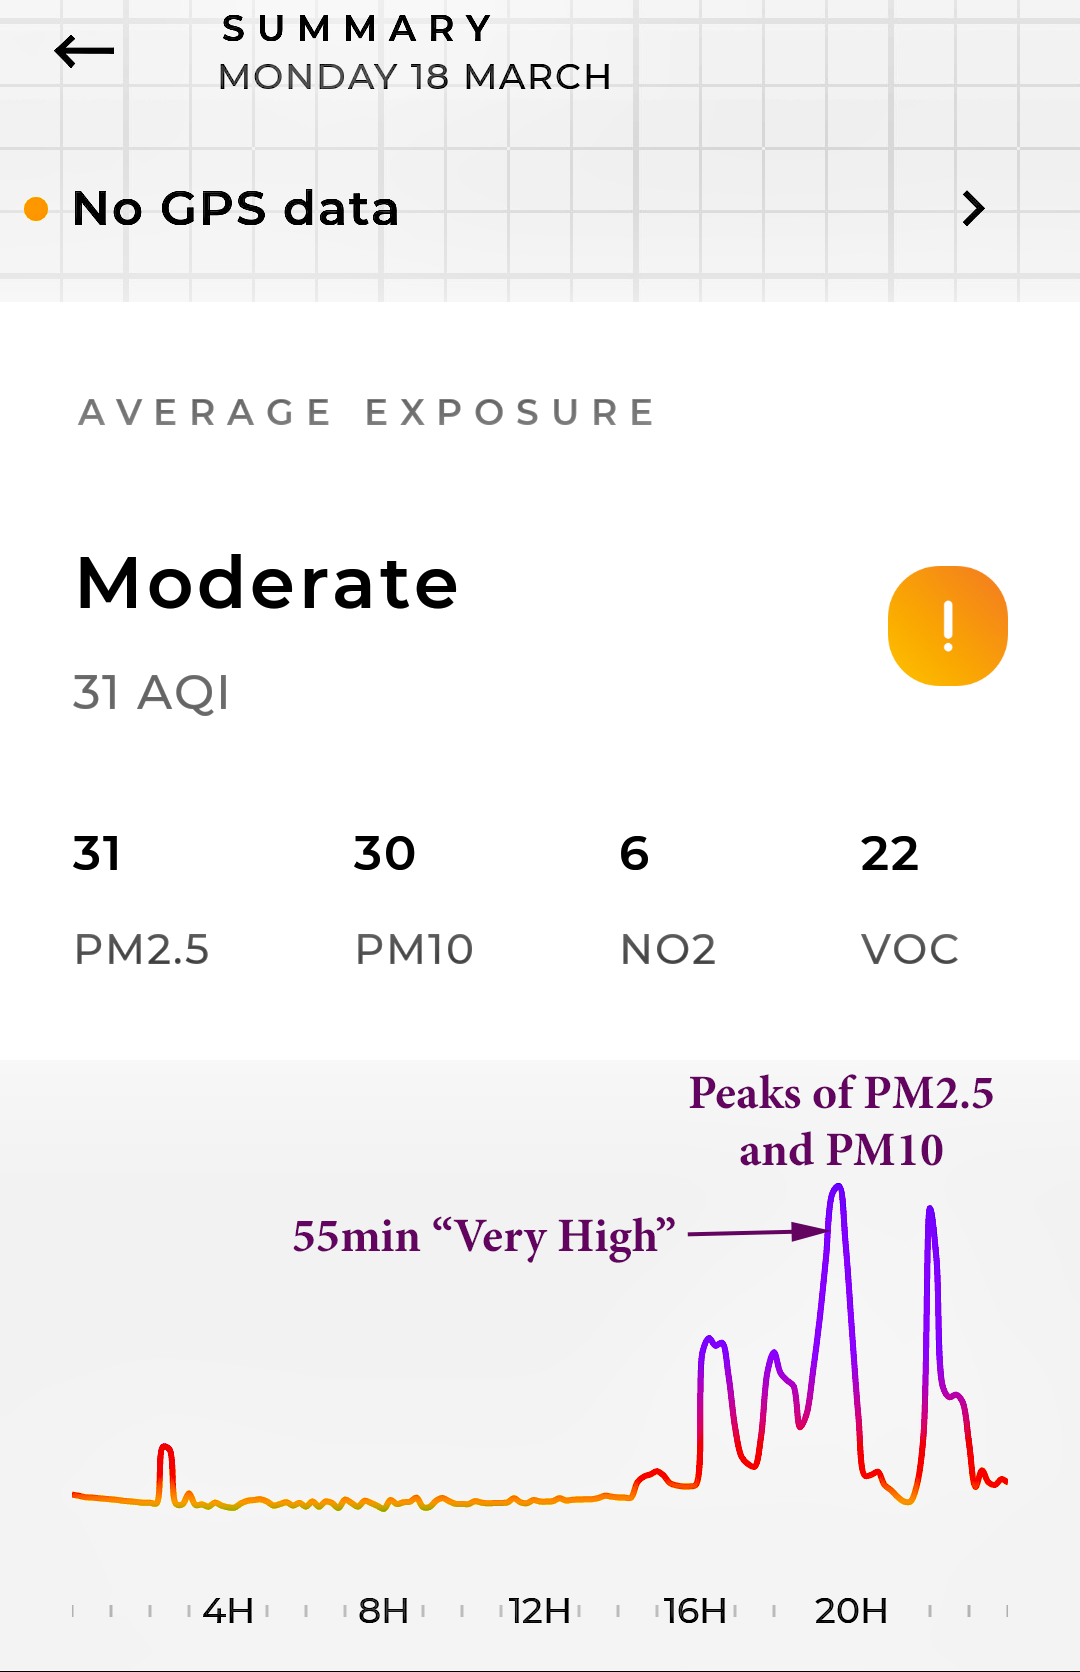
| 18 March | 31 | 30 | 6 | 22 | MODERATE | Exceedance:- 19.04pm - 20.04pm - PM2.5 & PM10 - |
Graph; Wind NW - SW. Rain 0.9mm. Very High pollution spikes from 4pm onwards. | |
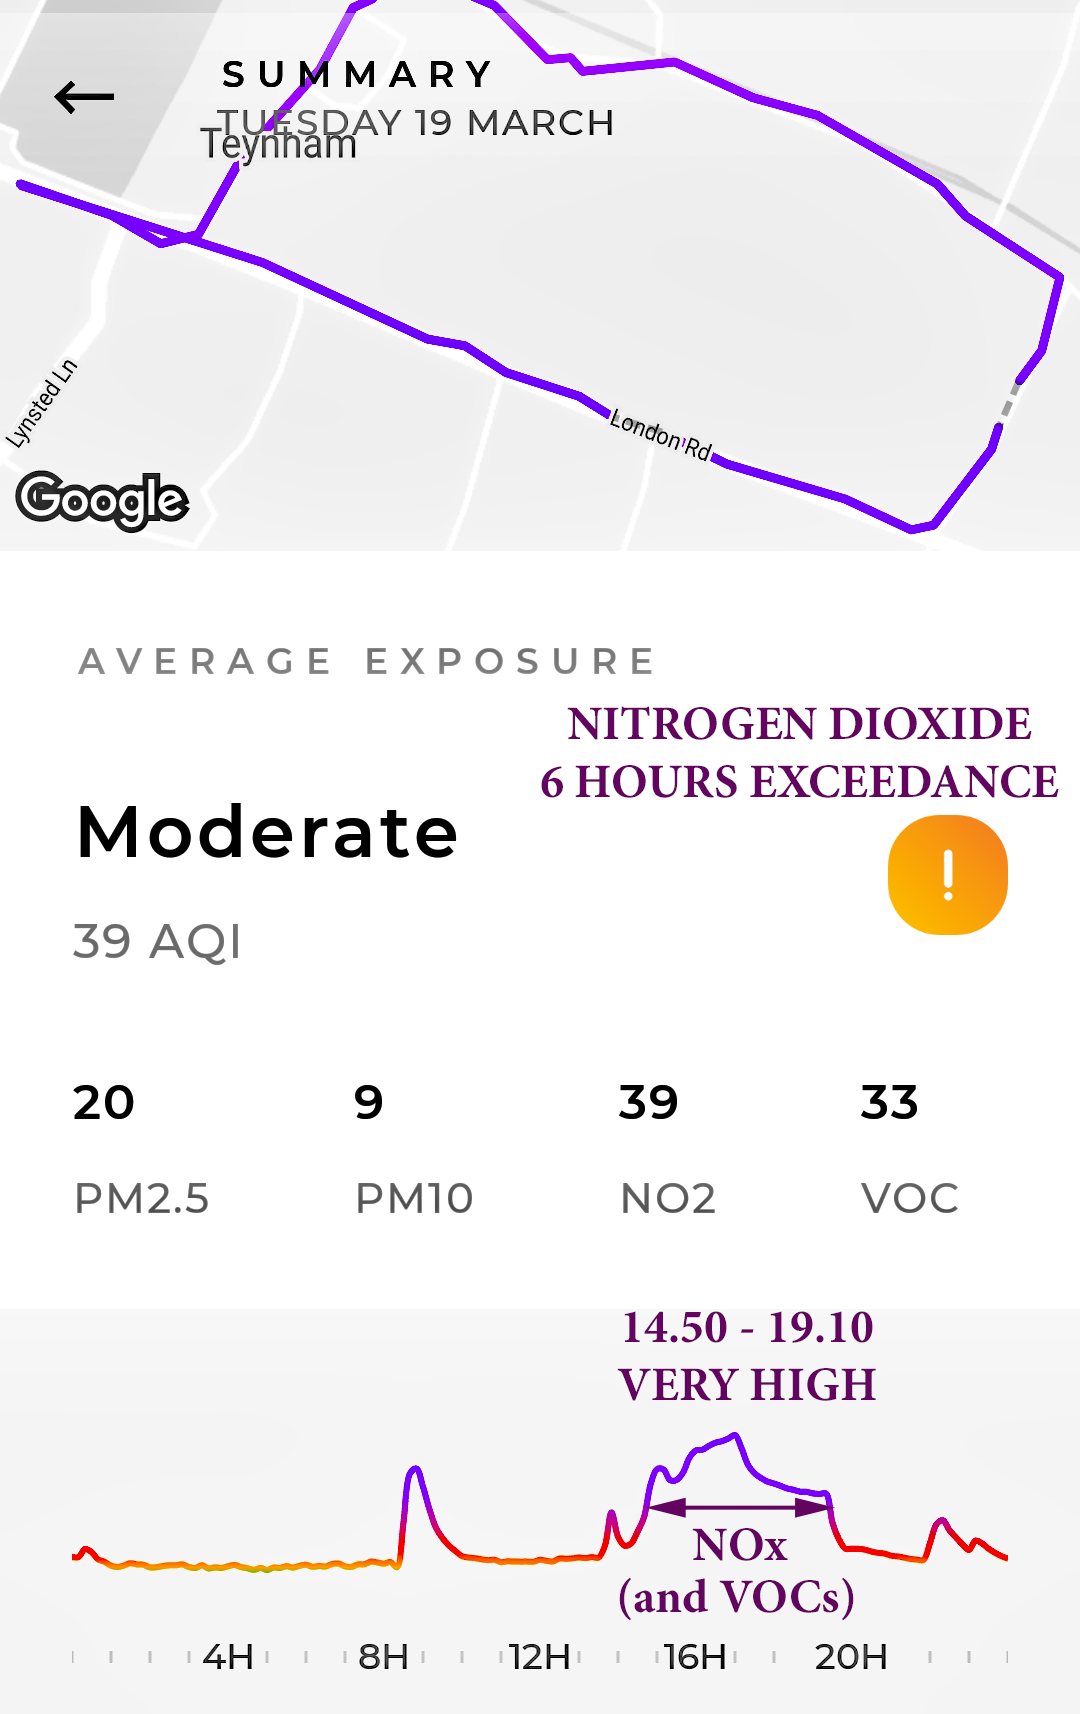
| 19 March | 20 | 9 | 39 | 33 | MODERATE | Graph. Wind WSW - SW - Light. Rain 1.2mm. | ||
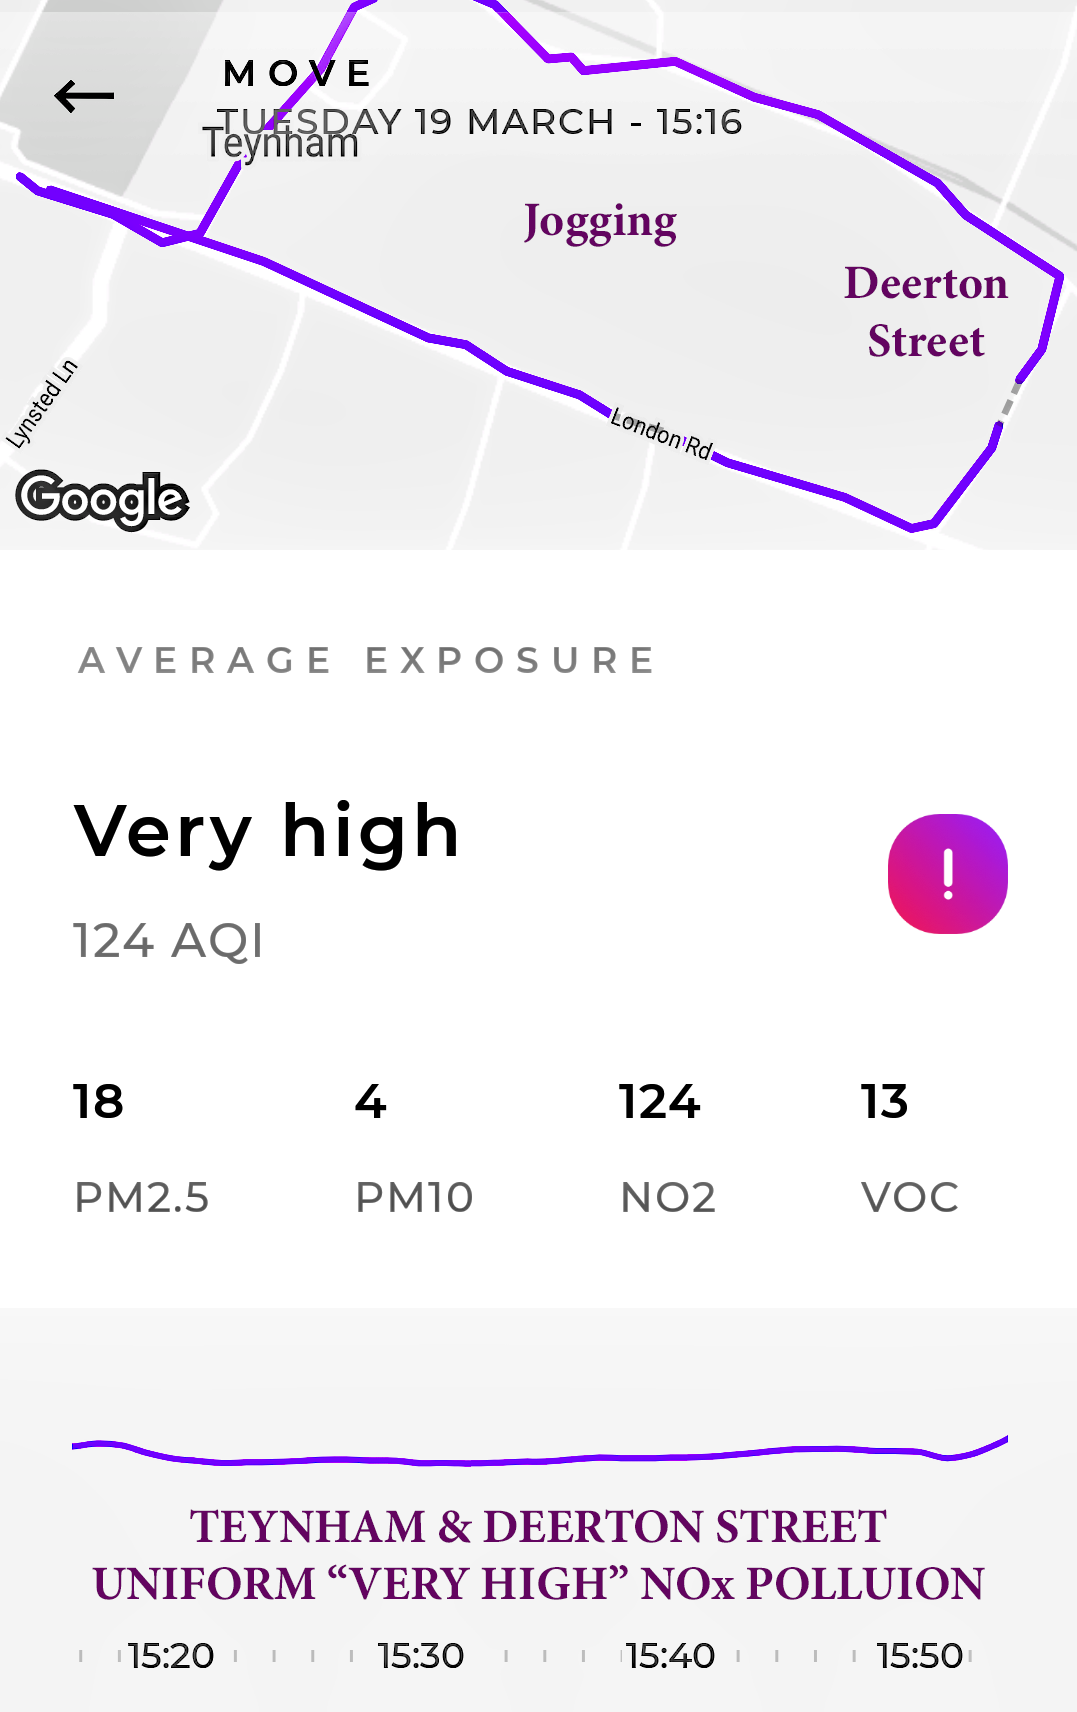
| 18 | 4 | 124 | 13 | VERY HIGH |
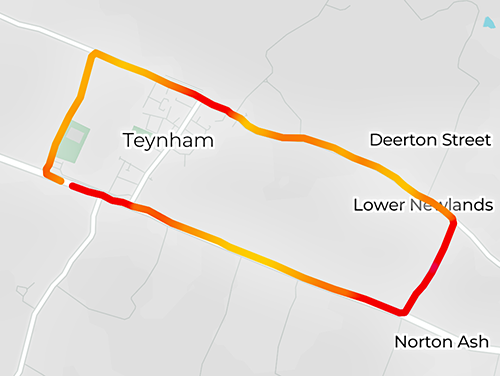
Jogging: A2 and Lower Road/Deerton Street (40min) | Map (Very High NOx) | ||
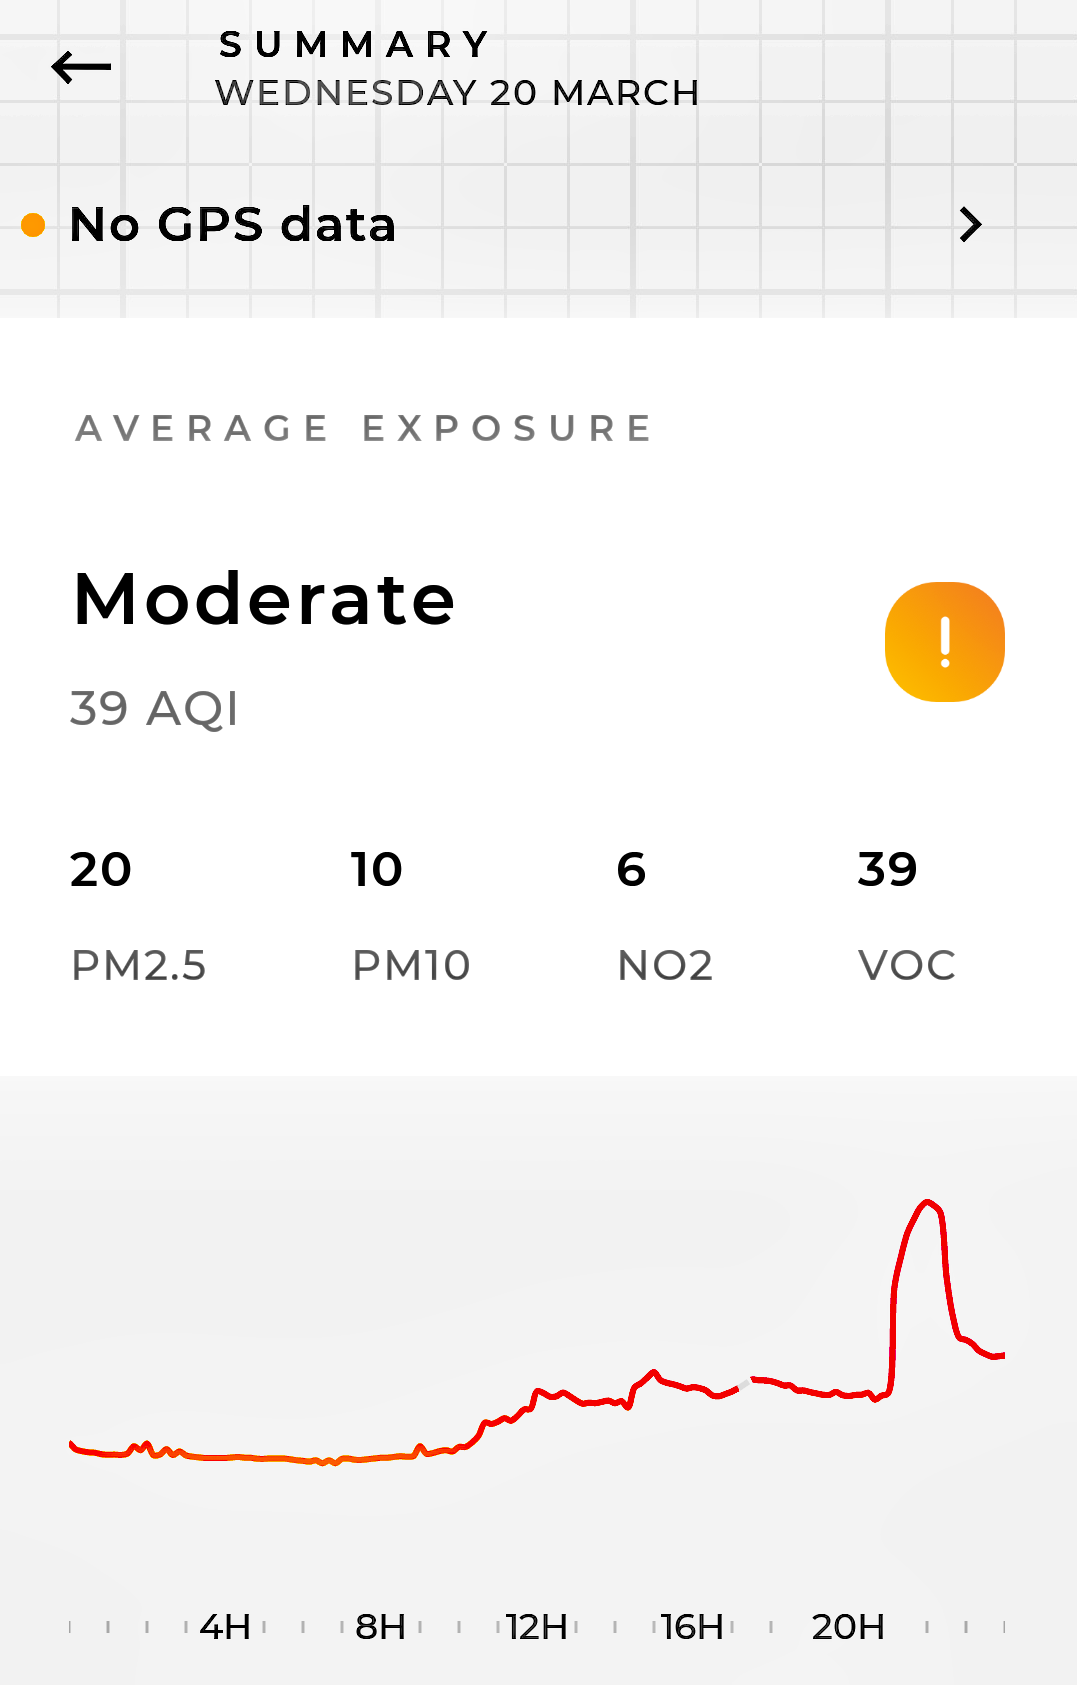
| 20 March | 20 | 10 | 6 | 39 | MODERATE | Graph. Wind WSW - SW Light. Rain 0.2mm. | ||
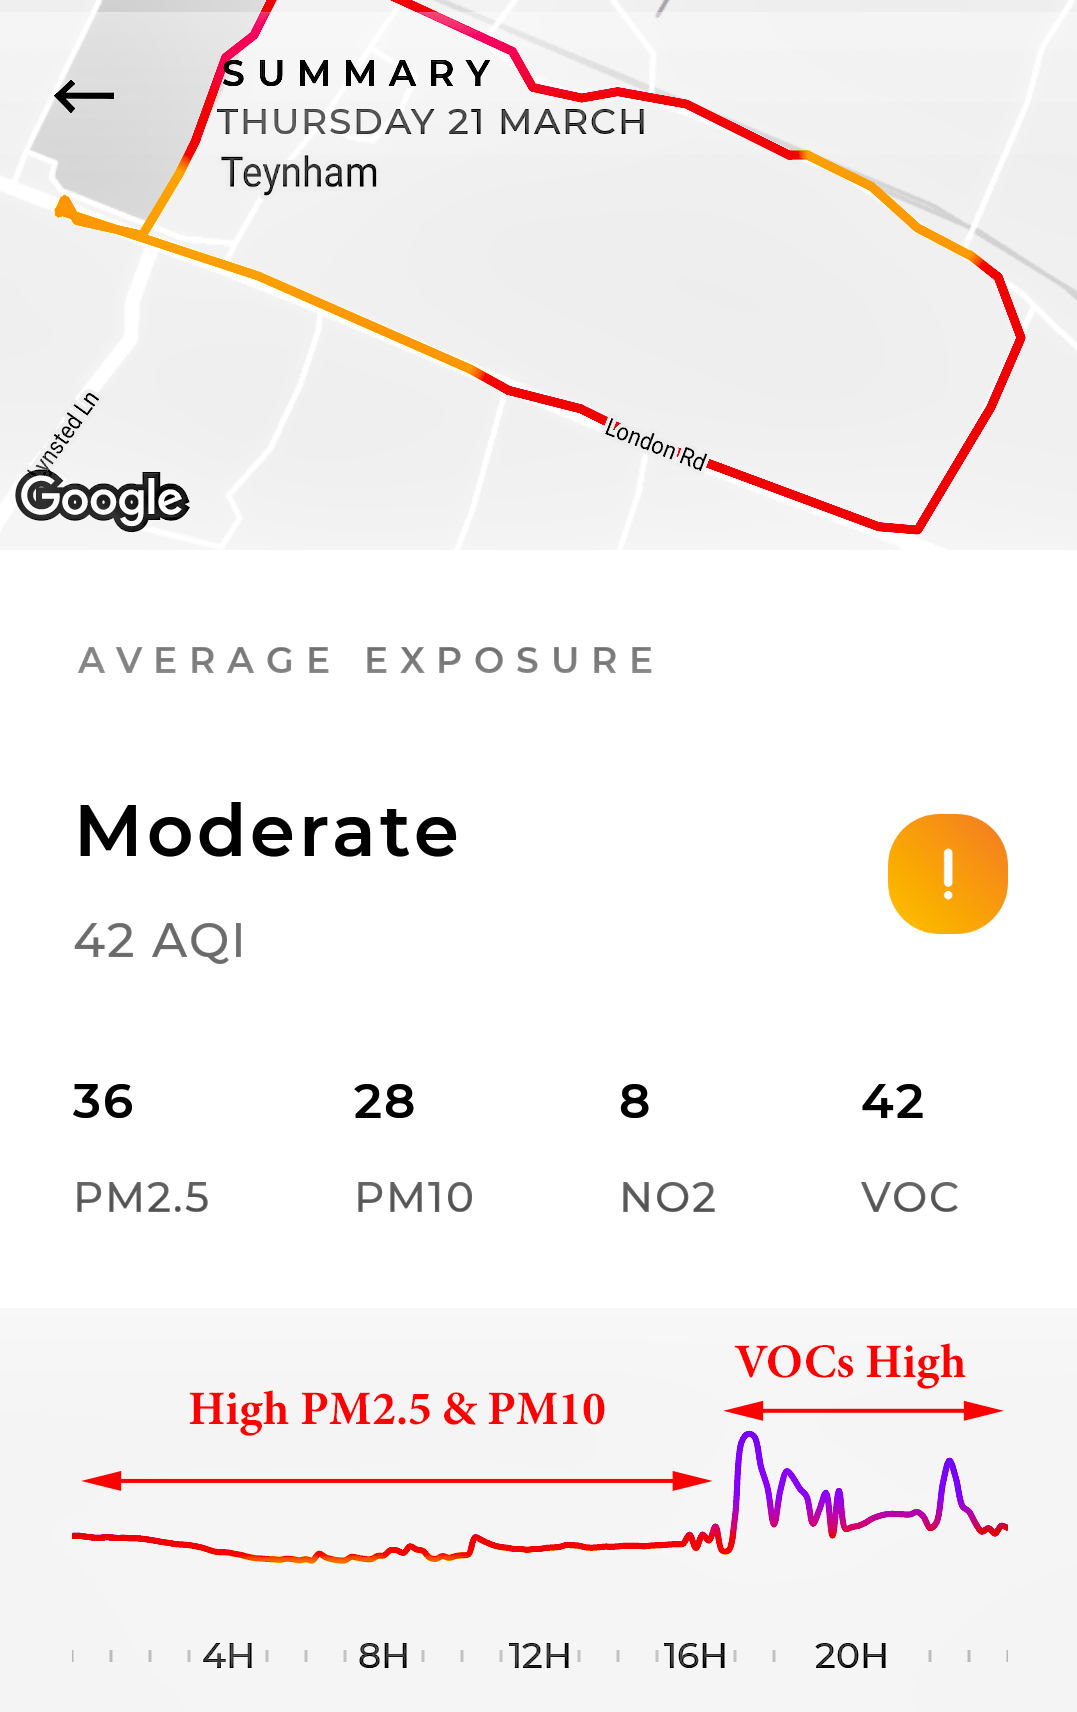
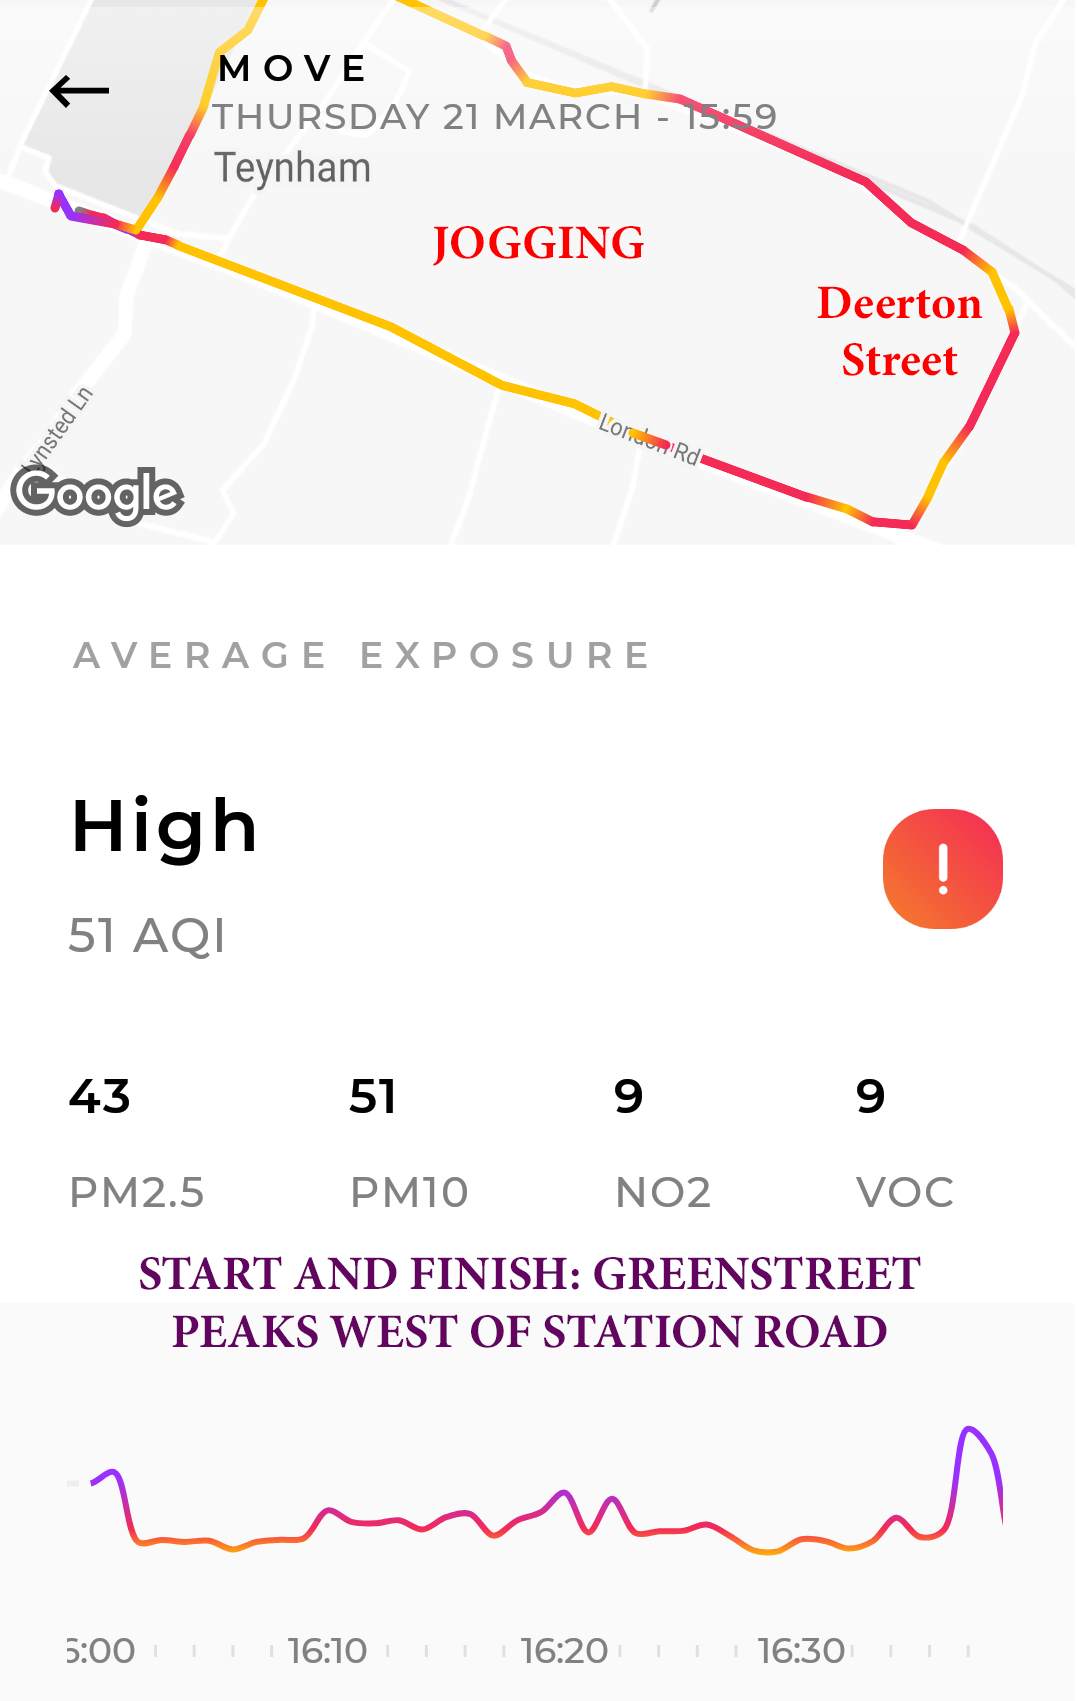
| 21 March | 36 | 28 | 8 | 42 | MODERATE | Graph & Map (High). Wind SW Light. Dry. Pollution rising. | ||
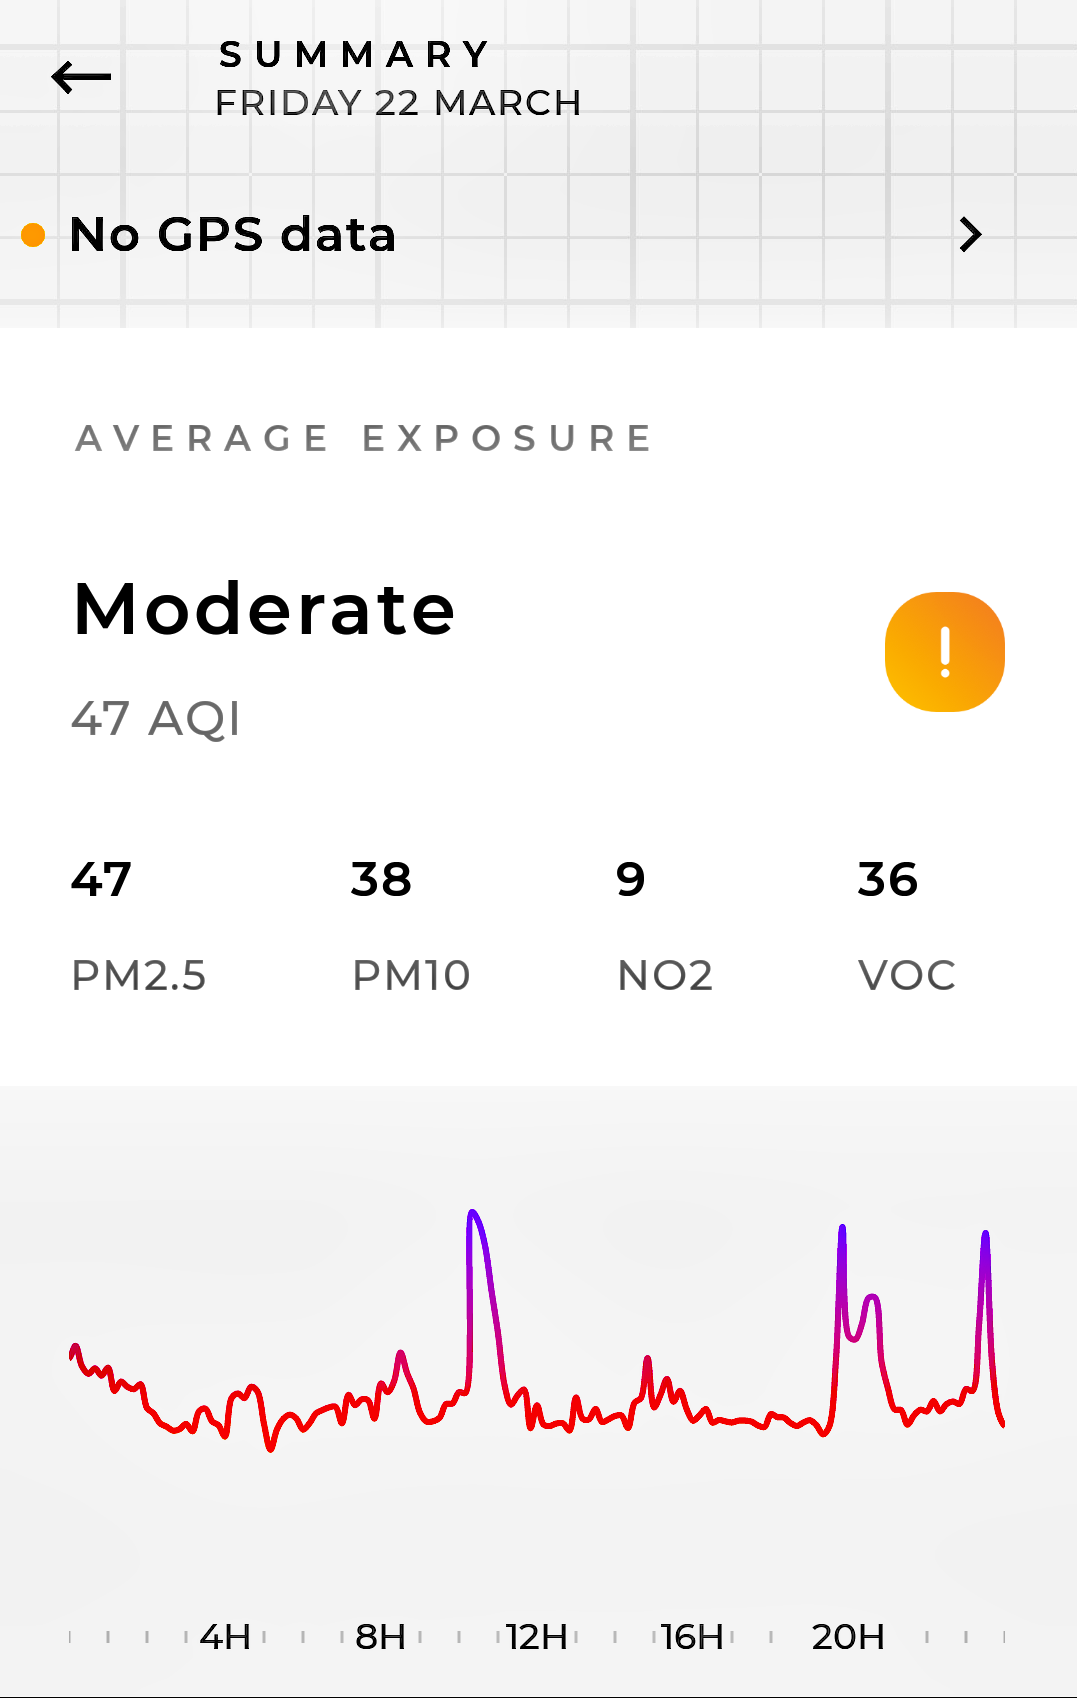
| 22 March | 47 | 38 | 9 | 36 | MODERATE | Graph. Peaks (PMs & VOCs). Wind SSW - SW Light. Dry. Pollution rising. | ||
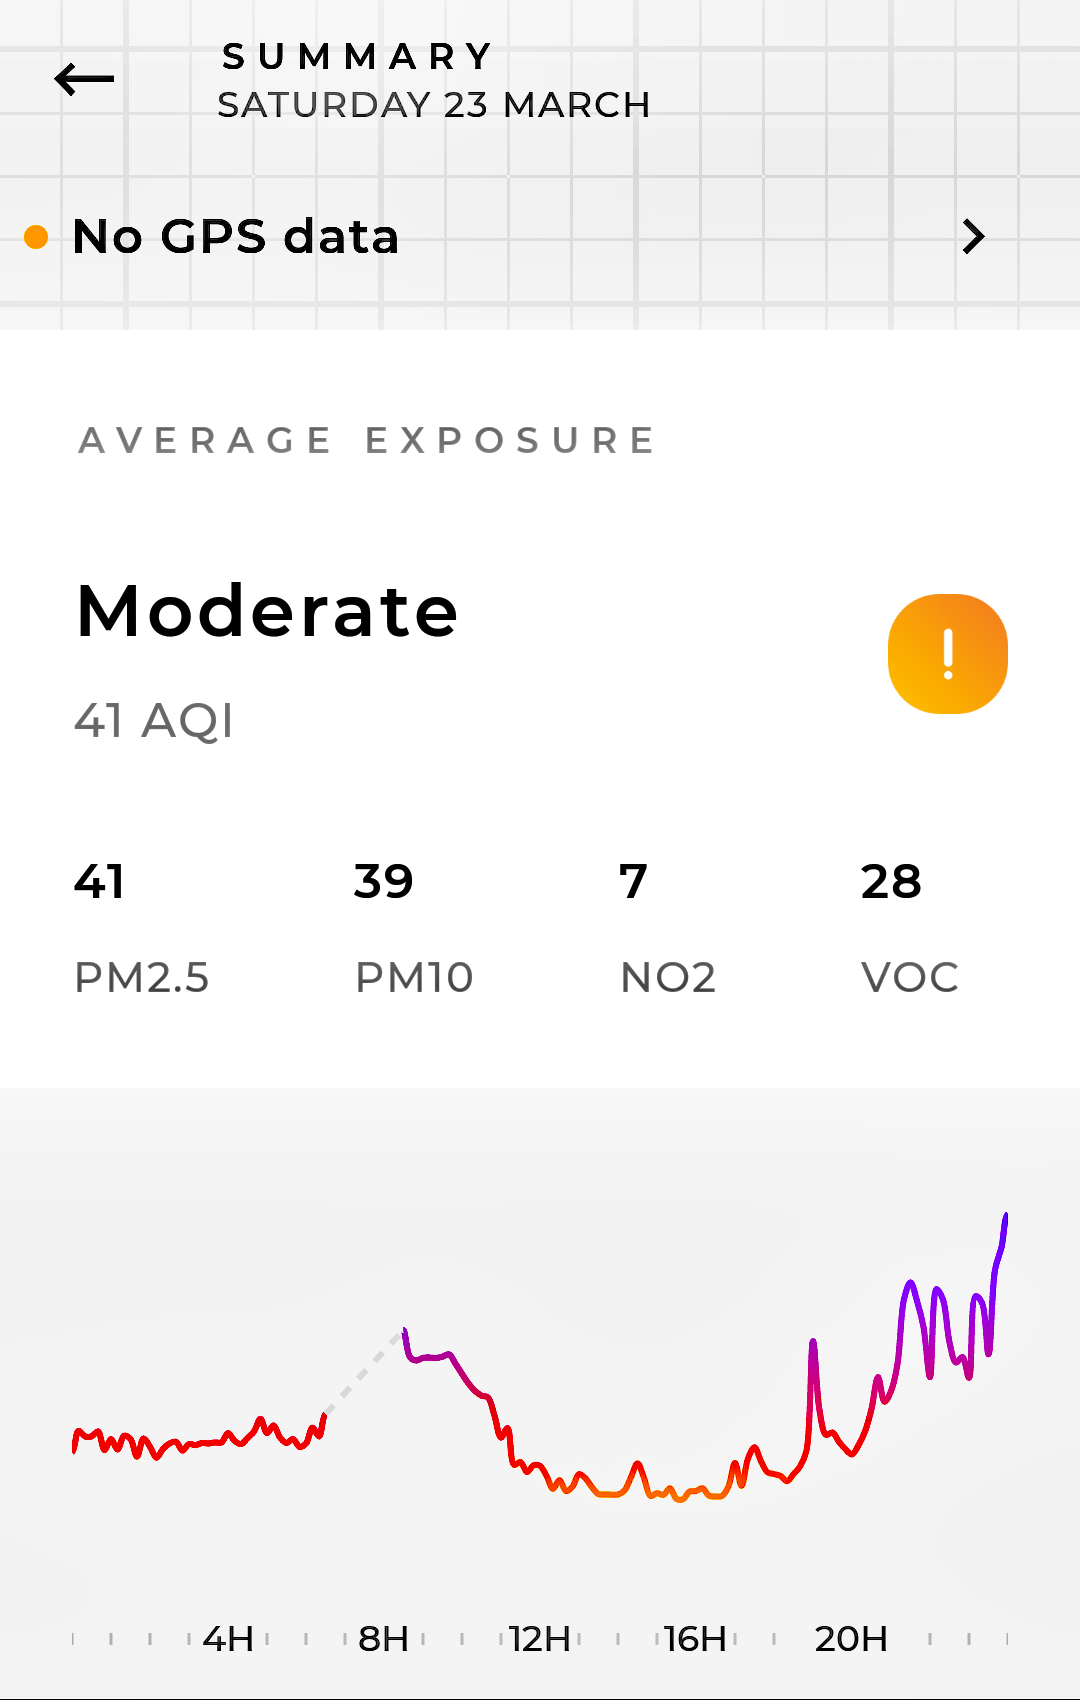
| 23 March | 41 | 39 | 7 | 28 | MODERATE | Graph. Peaks (PMs).Wind WSW - W - NW - NE - ENE, stiffening wind. Rain 0.3mm. | ||
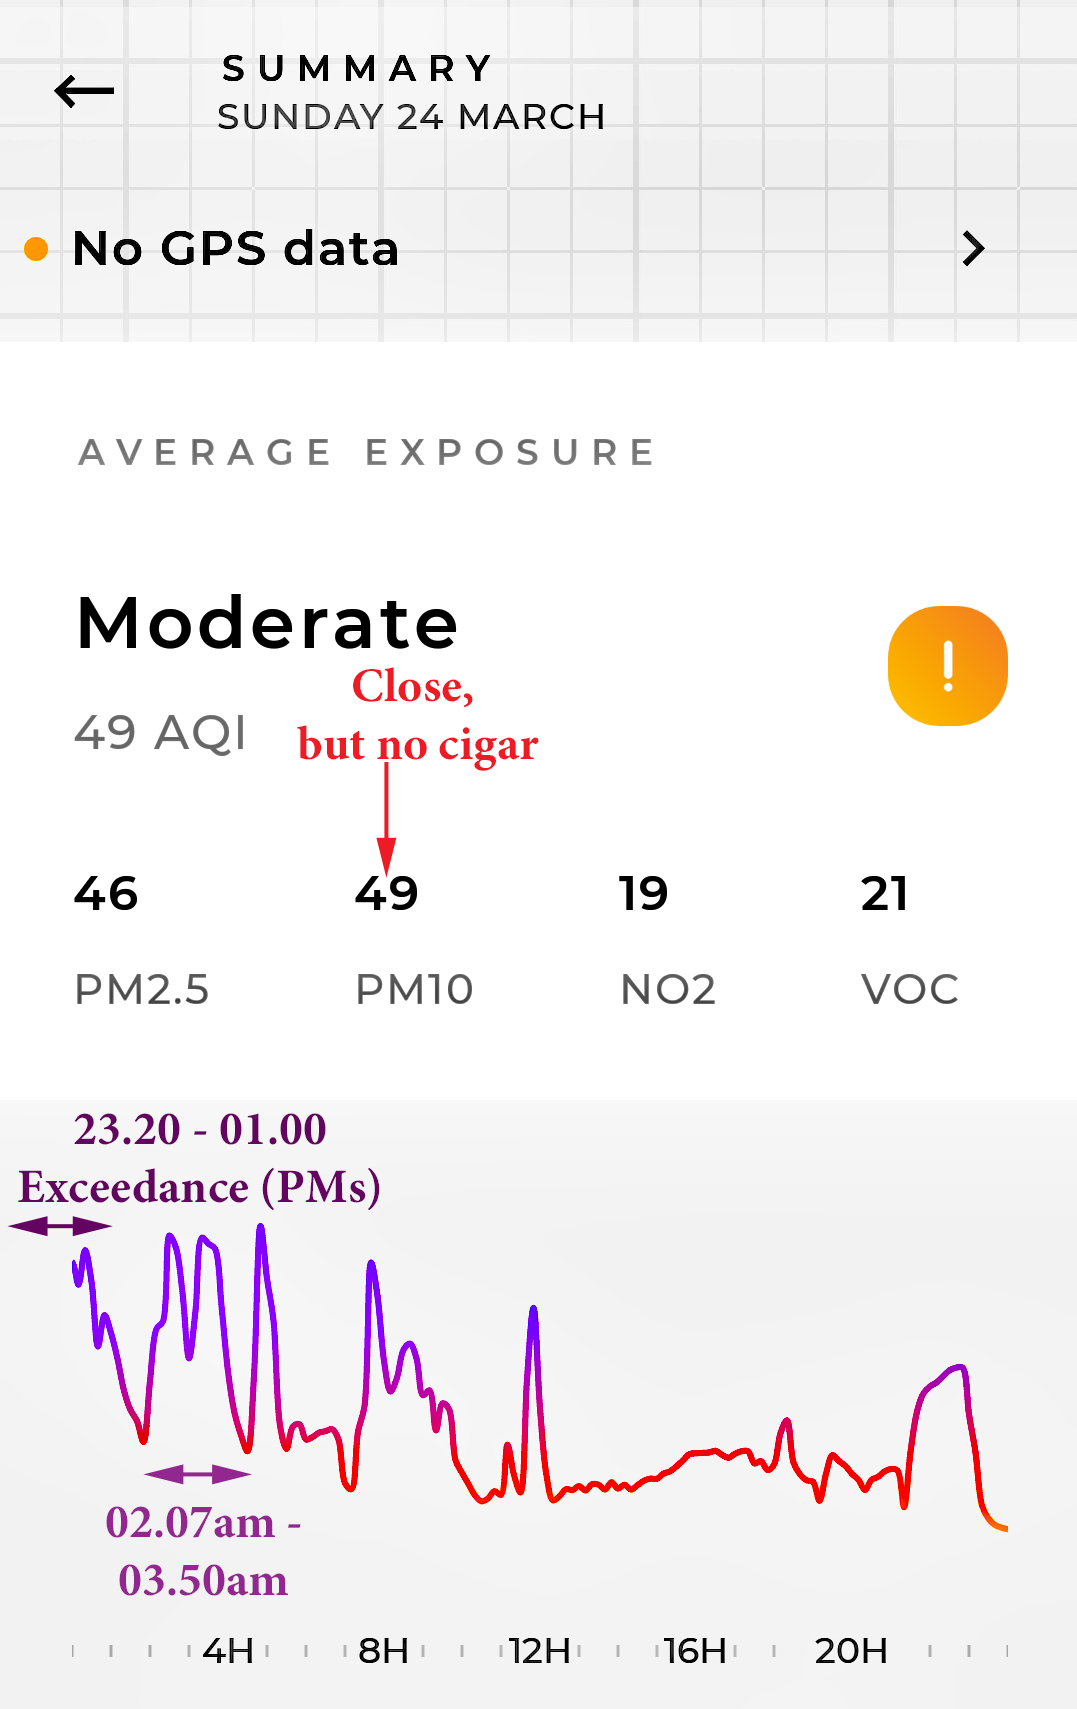
| 24 March | 46 | 49 | 19 | 21 | MODERATE | Exceedances:- 23.20pm - 01.00 am; 02.07am - 03.50am; - PM2.5 & PM10 - |
Graph. Pollution Exceedances overnight. Wind NE - NW strengthening. Dry. | |
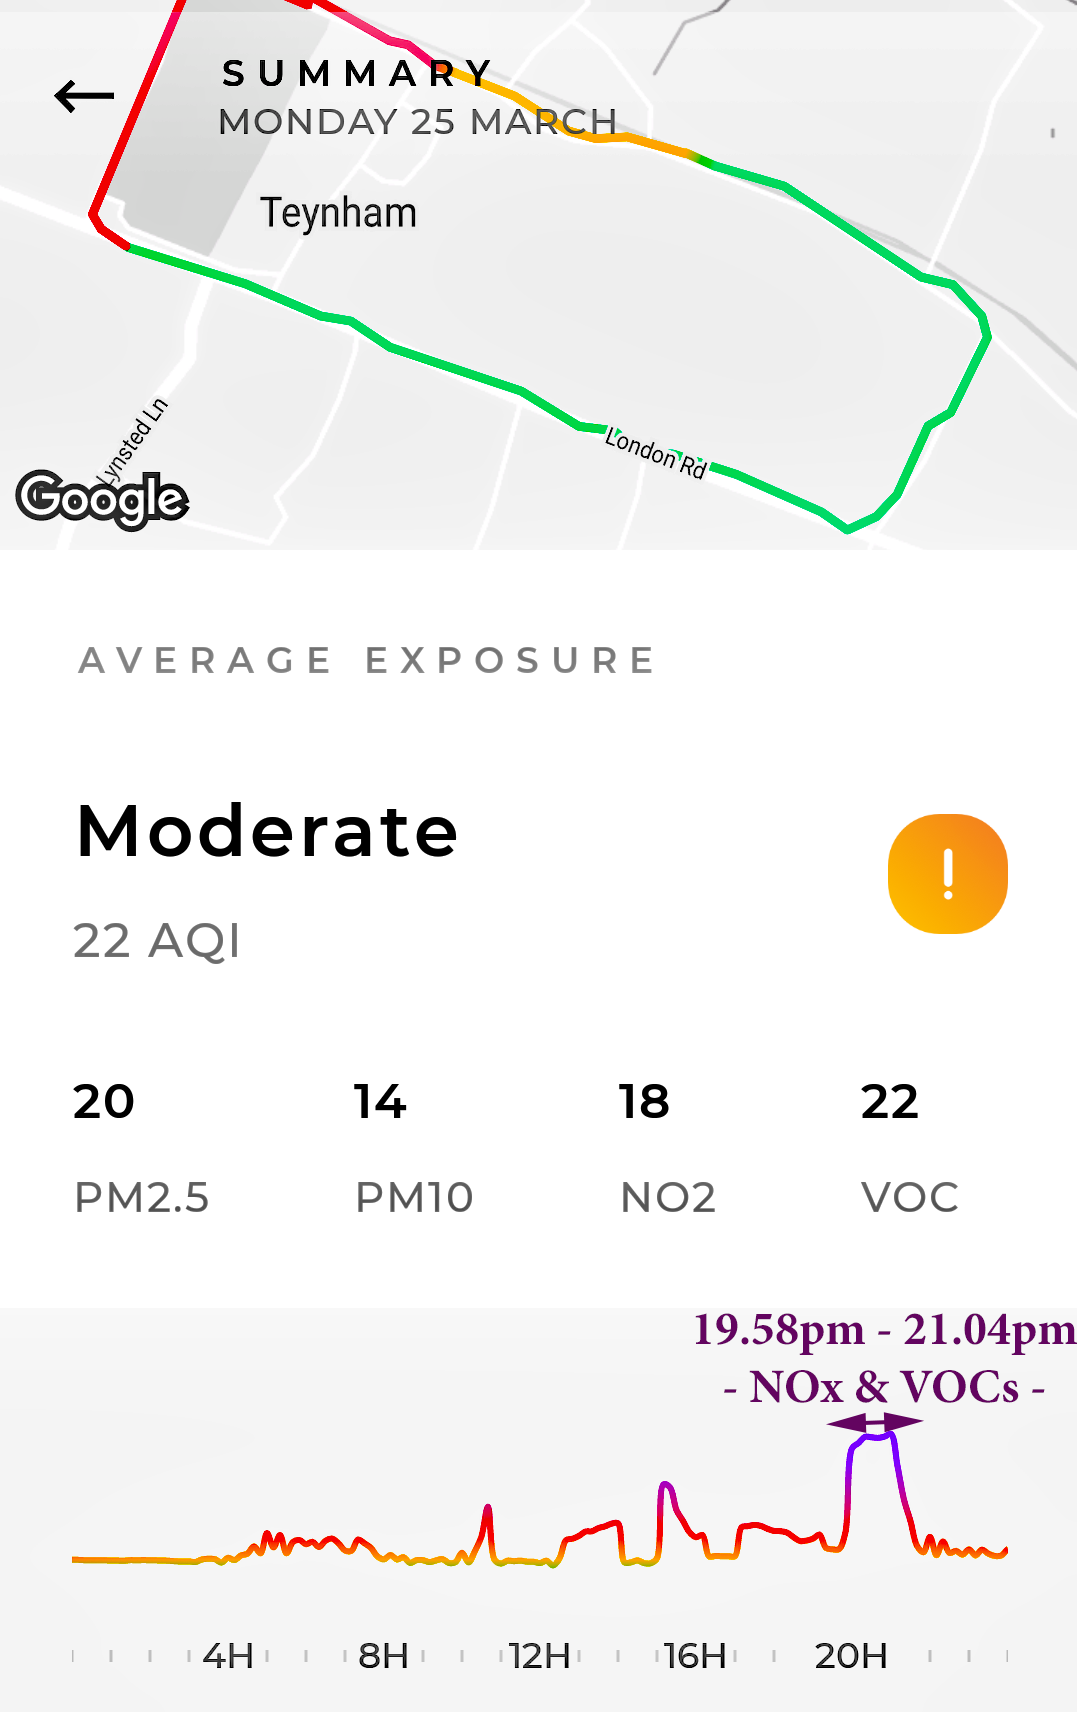
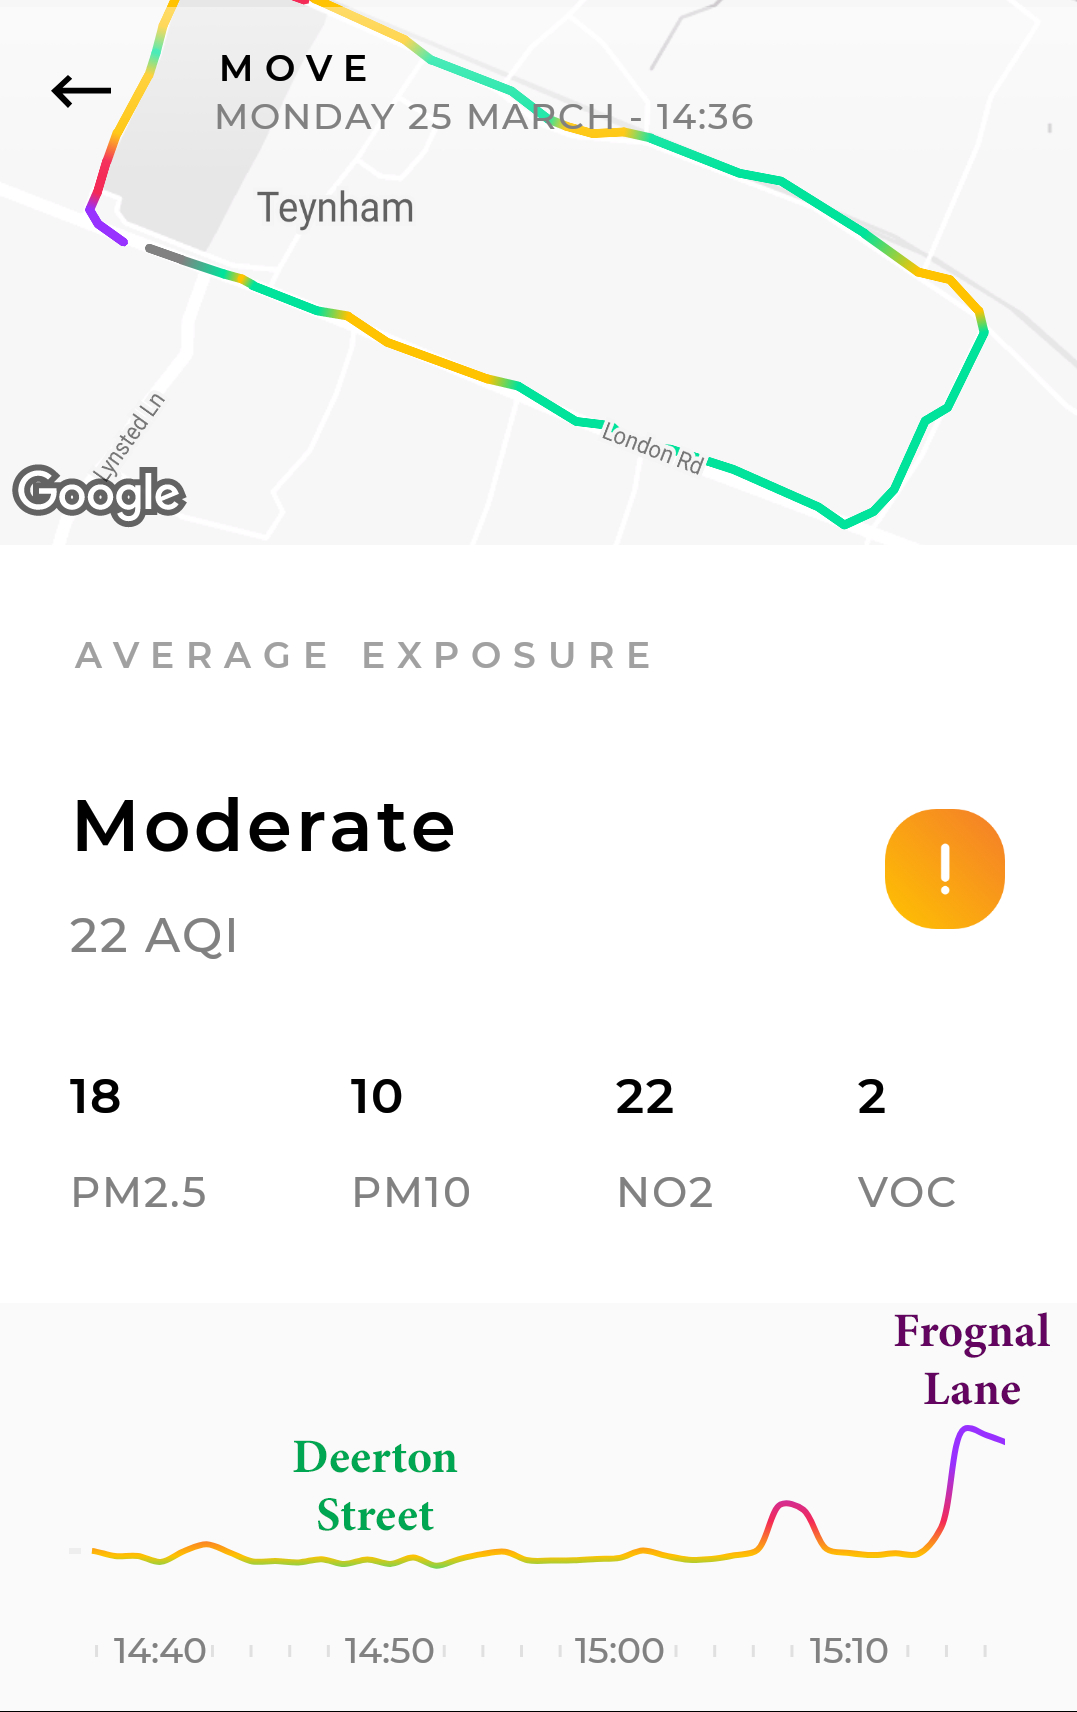
| 25 March | 20 | 14 | 18 | 22 | MODERATE | Exceedance:- 19.58pm - 21.04pm - NOx & VOCs - |
Graph & Map. NOx & VOC. Exceedance. Wind NNW - N. Dry. | |
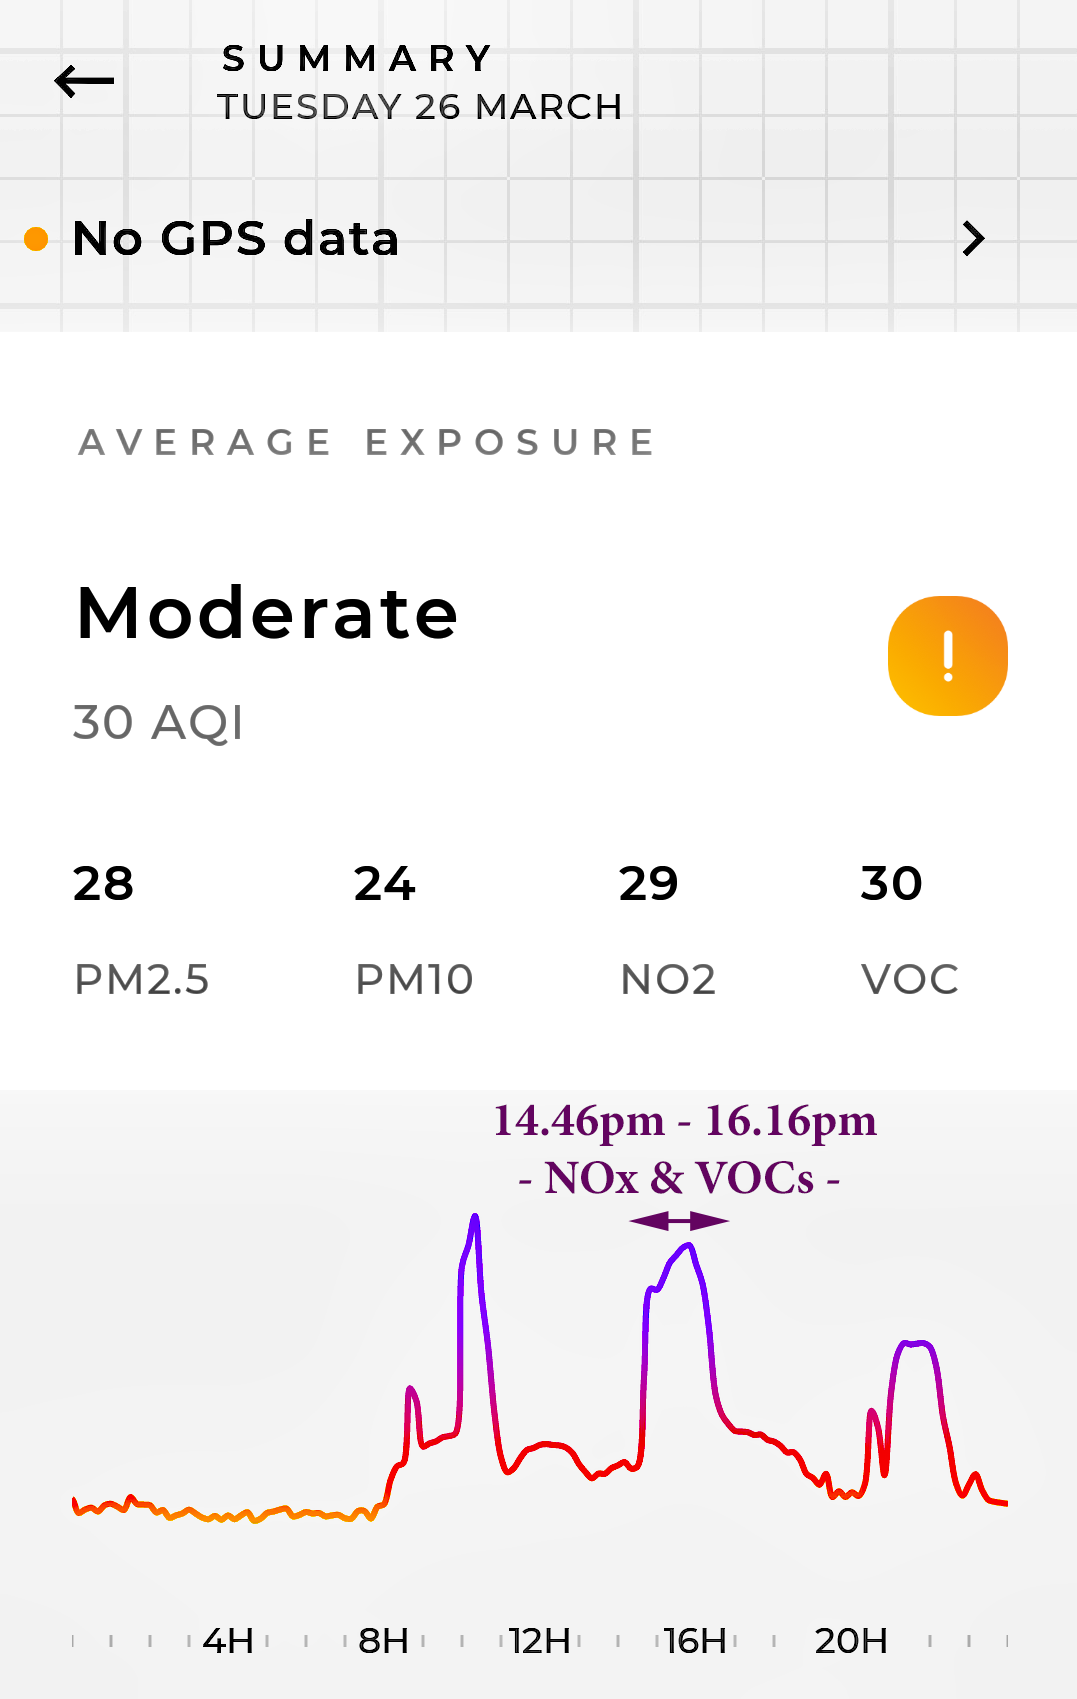
| 26 March | 28 | 24 | 29 | 30 | MODERATE | Exceedance:- 14.46pm - 16.16pm - NOx & VOCs - |
Graph. NOx. Wind N - NNW (15 kph). Dry | |
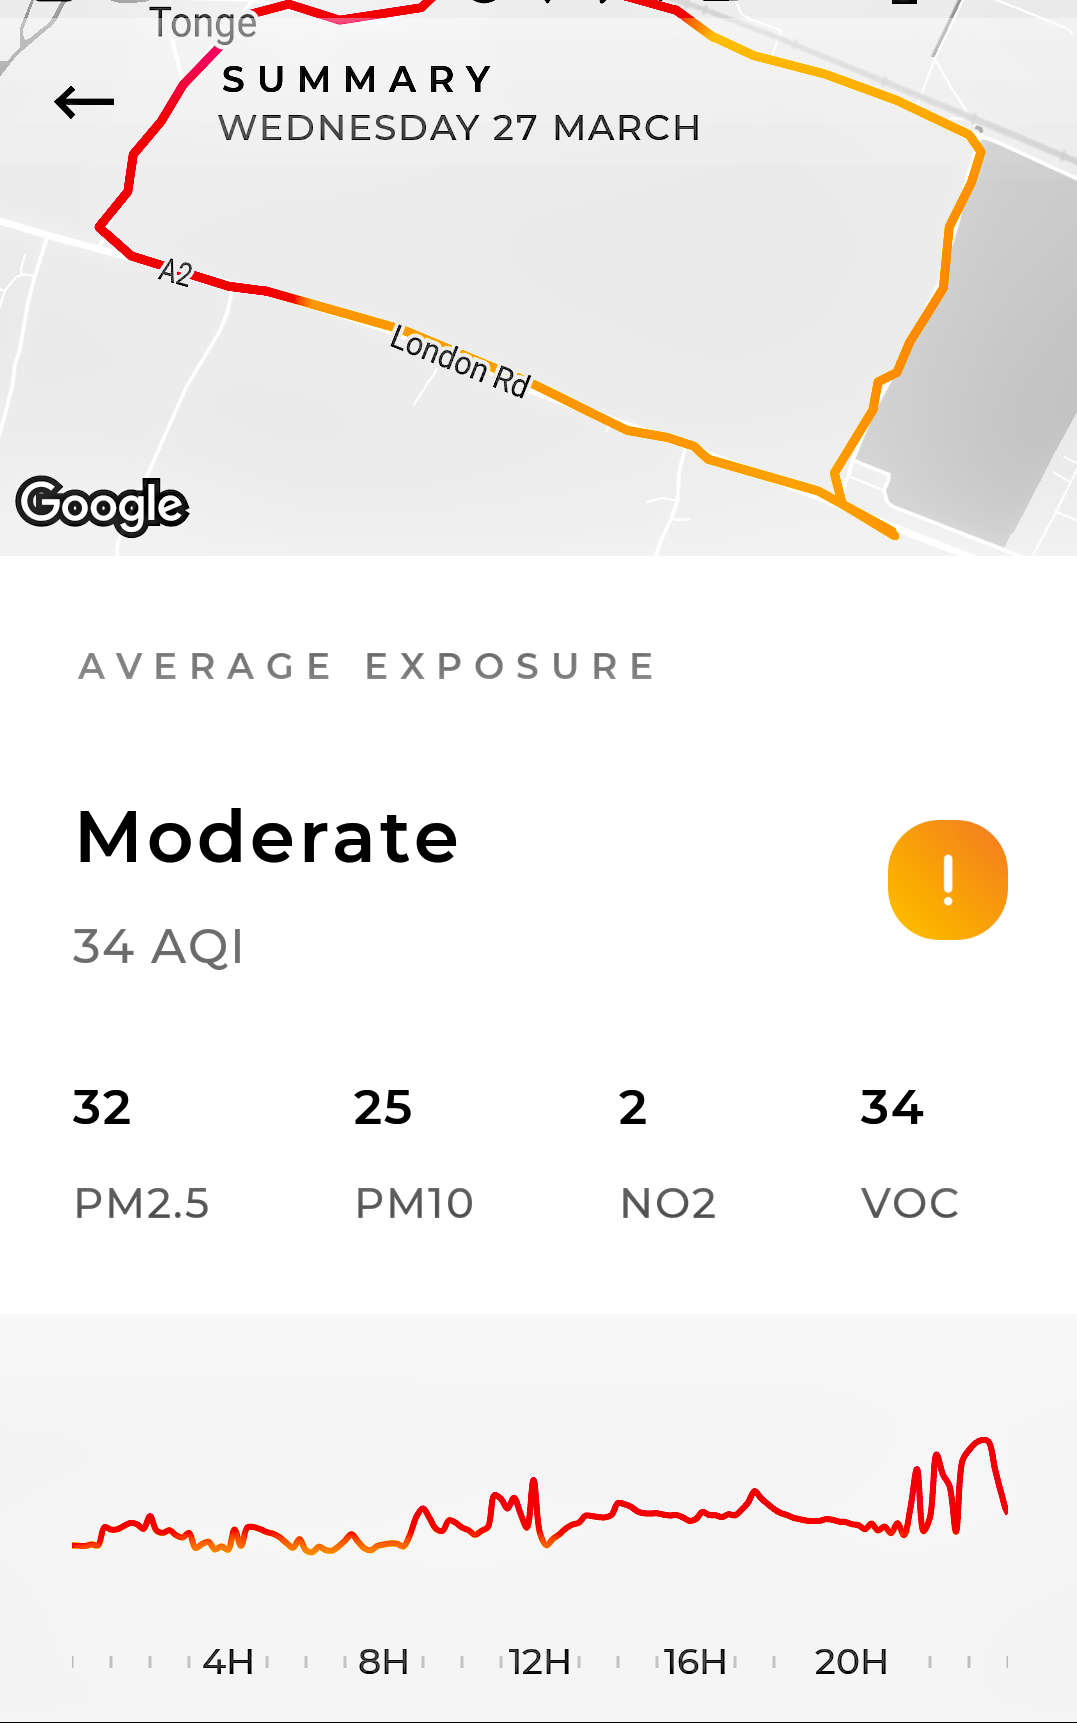
| 27 March | 32 | 25 | 2 | 34 | MODERATE | Graph.WNW - NW (9 kph). Rain 0.1mm. | ||
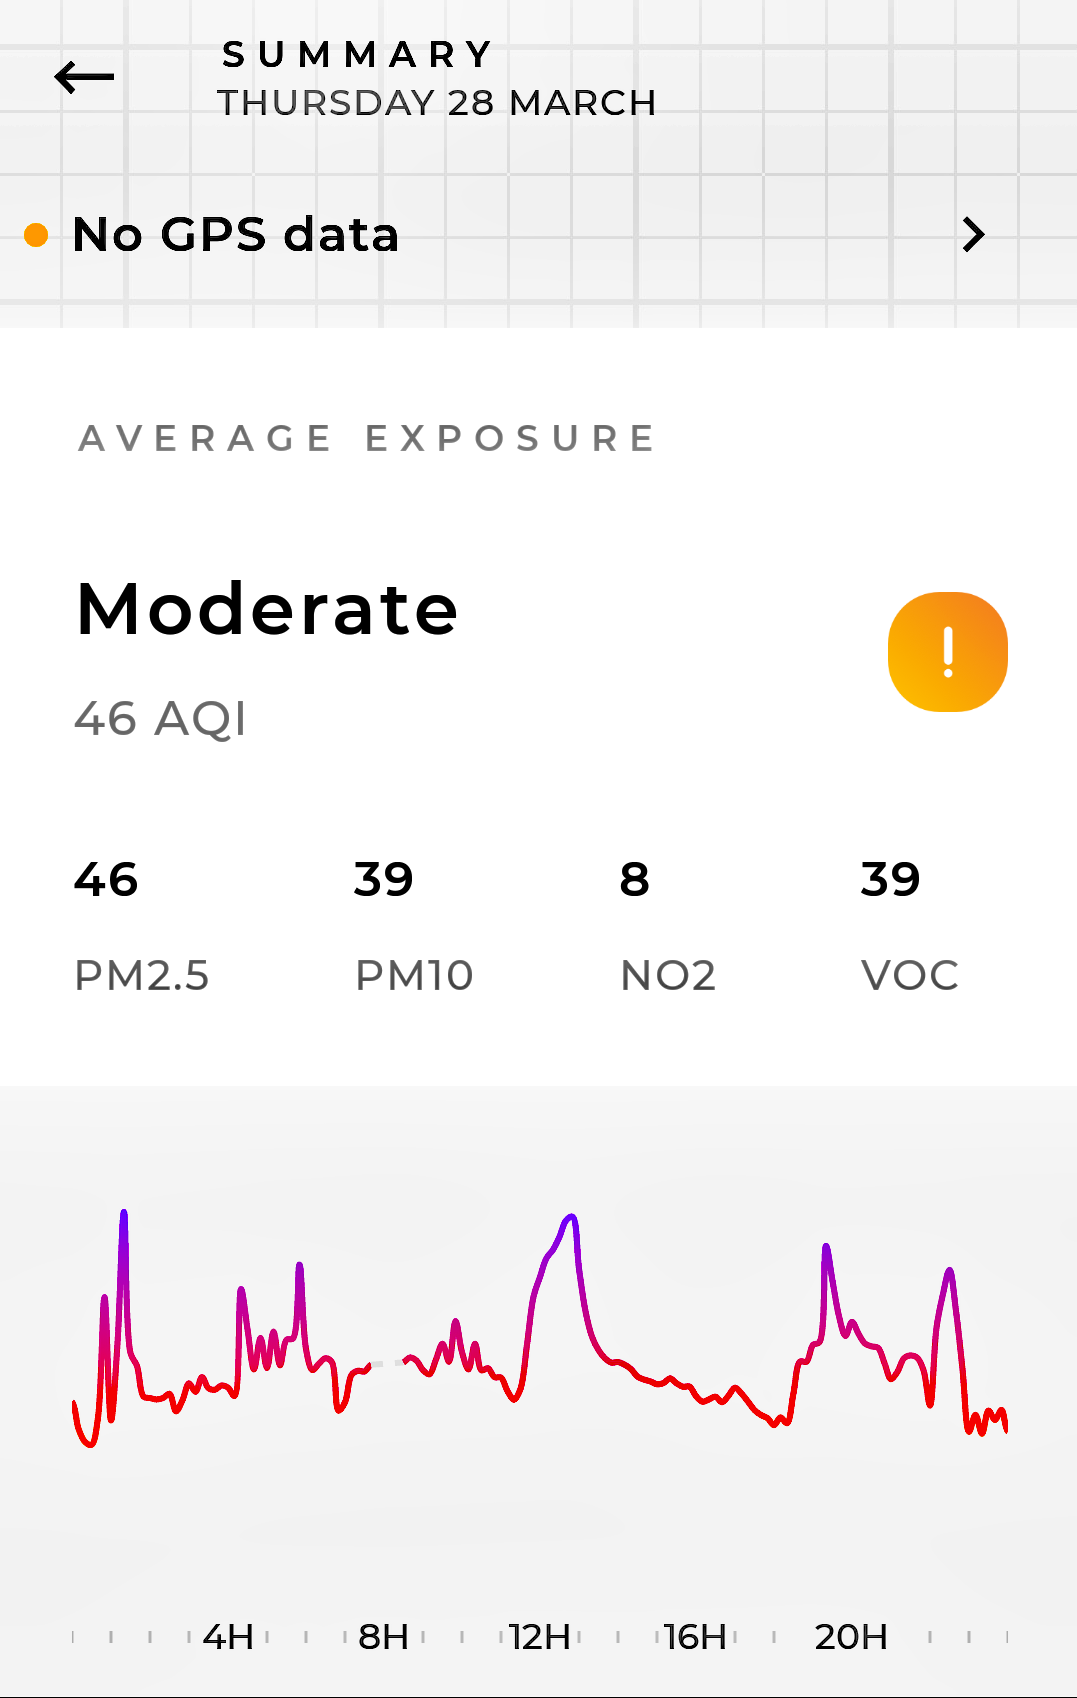
| 28 March | 46 | 39 | 8 | 39 | MODERATE | Graph. Wind W - N - SE Light. Rain 0.3mm. Pollution increasing. | ||
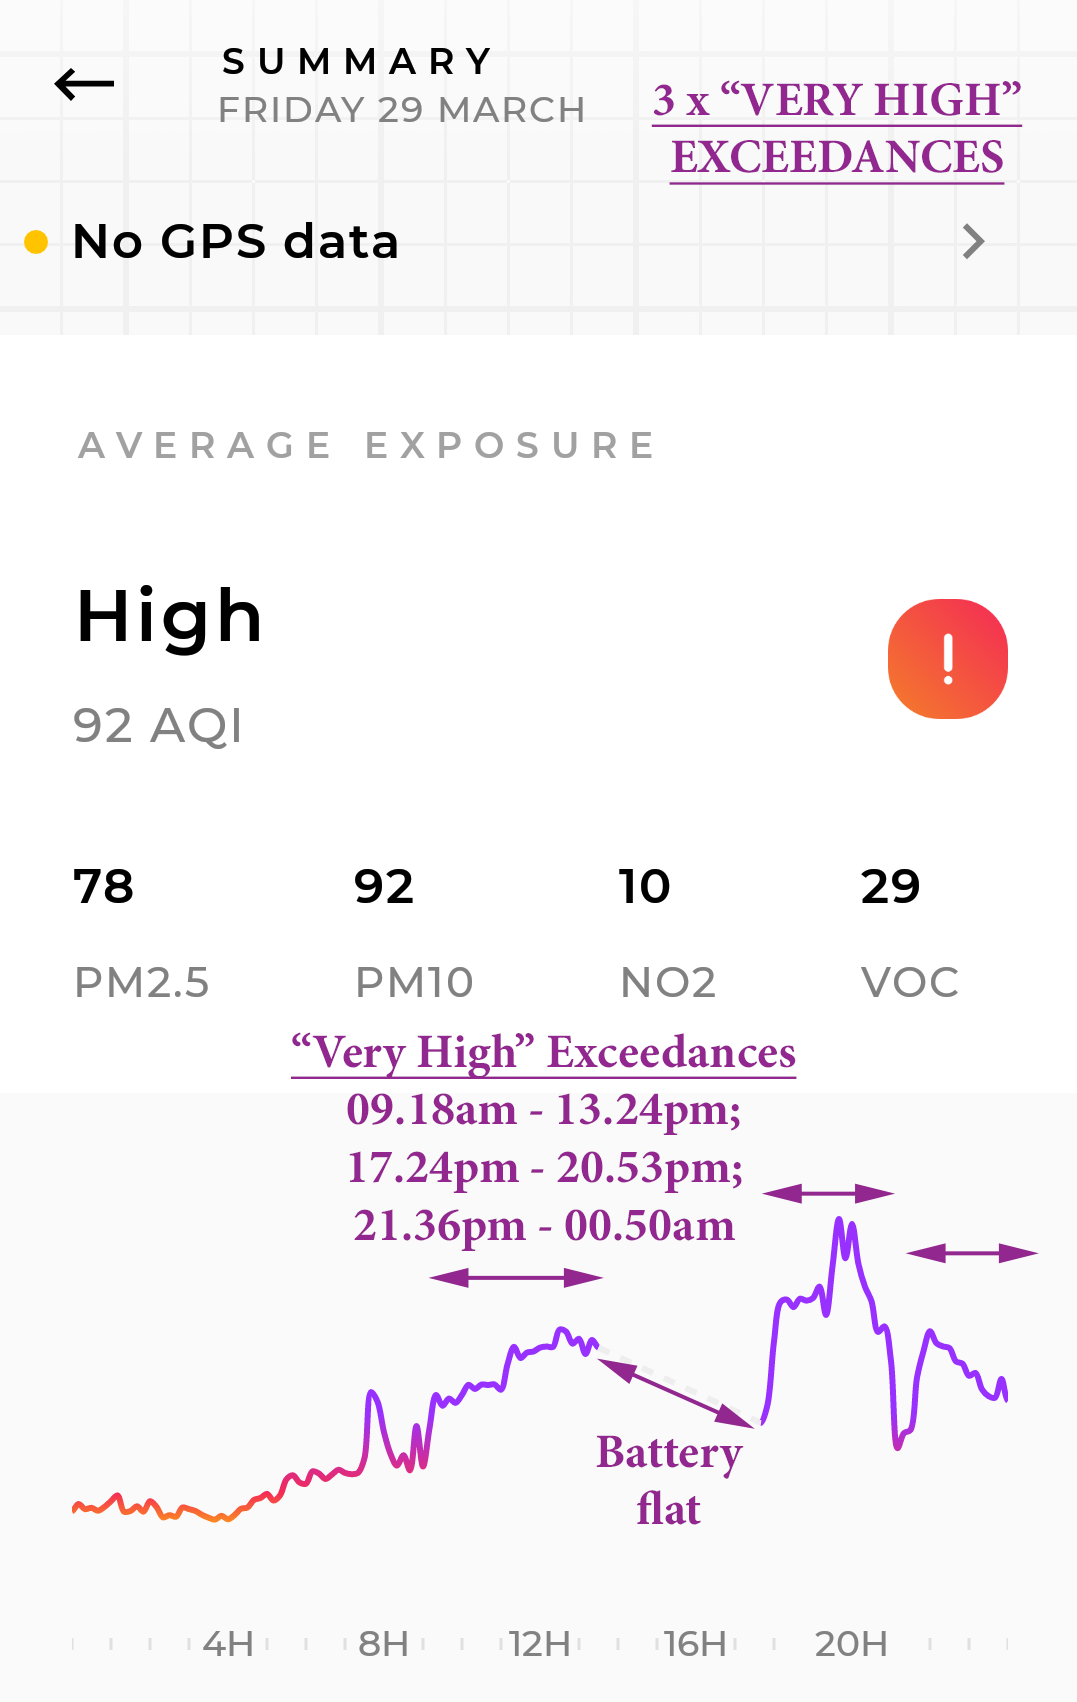
| 29 March | 78 | 92 | 10 | 29 | HIGH | Exceedance | Exceedances:- 09.18am - 13.24pm; 17.24pm - 20.53pm; 21.36pm - 00.50am - PM2.5 and PM10 - |
Graph.Wind SSE - S - SE Very light. Dry. Particulate Matter sharply increased. |
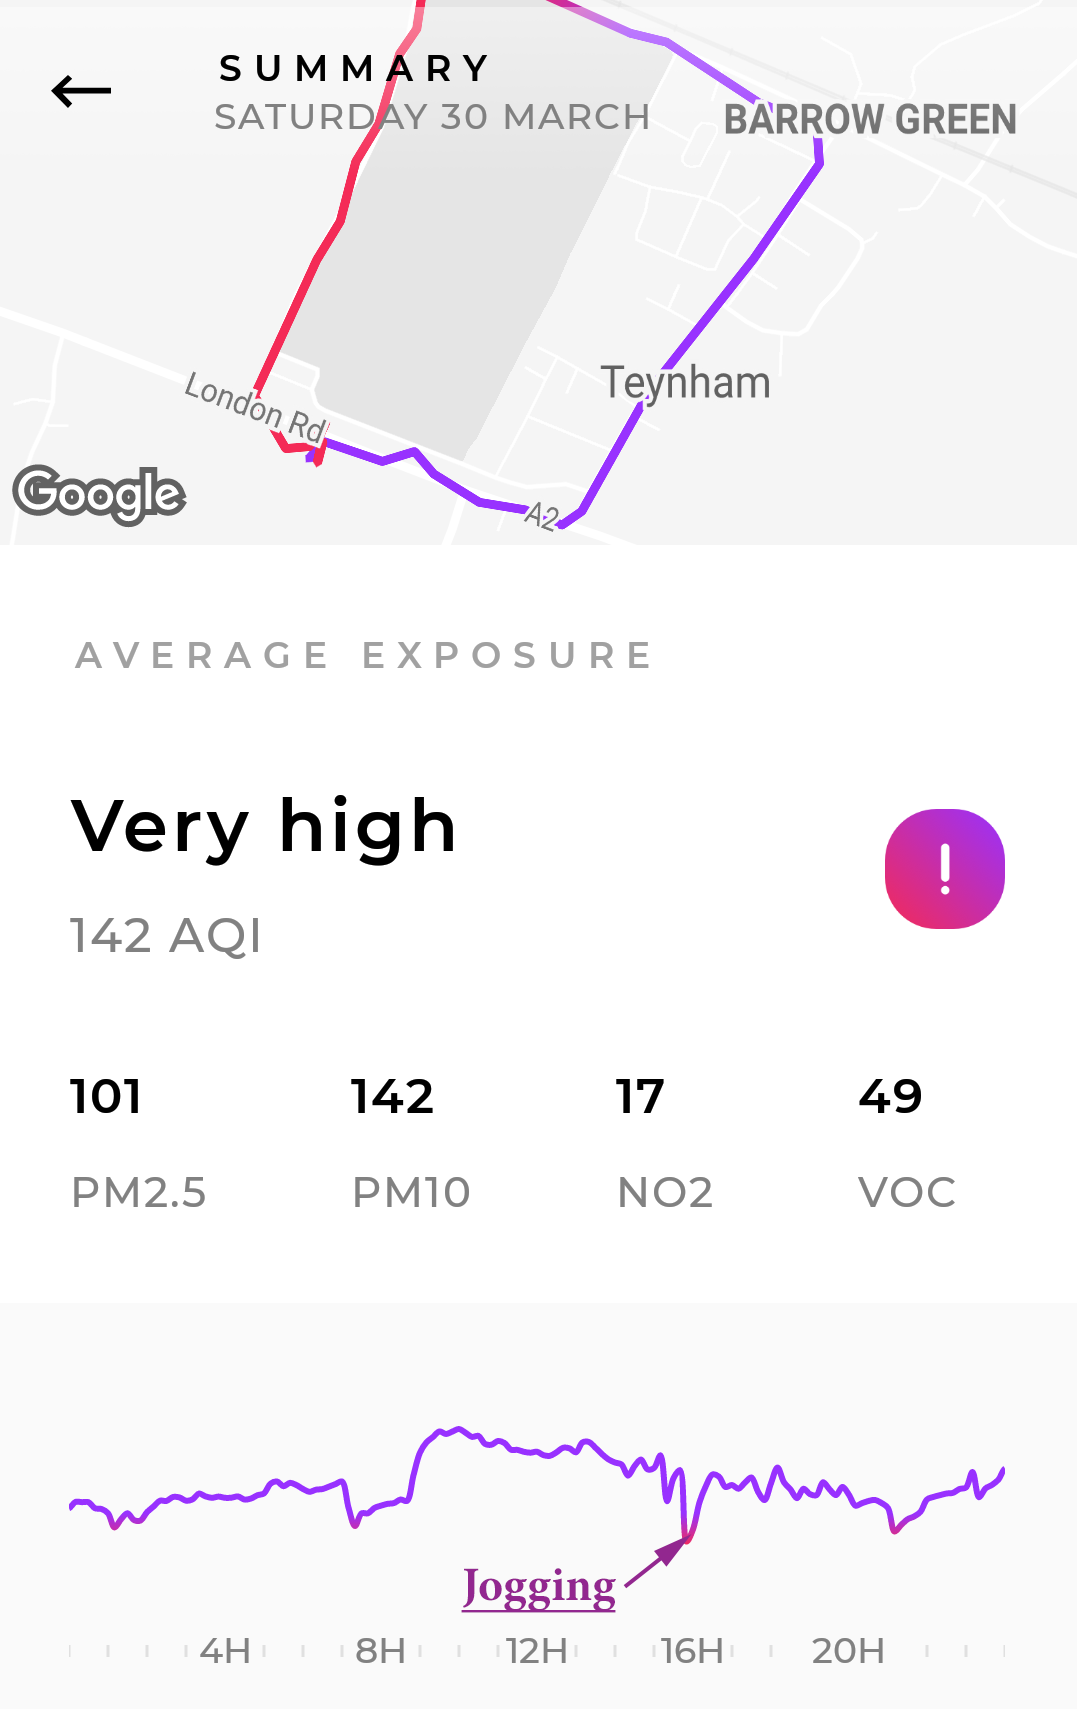
| 30 March | 101 | 142 | 17 | 49 | VERY HIGH |
Exceedance | Exceedances:- All Day (with 4 short dips to "HIGH") |
Graph & Map. Wind SE - NE - SSE Very Light. Rain 4.8mm |
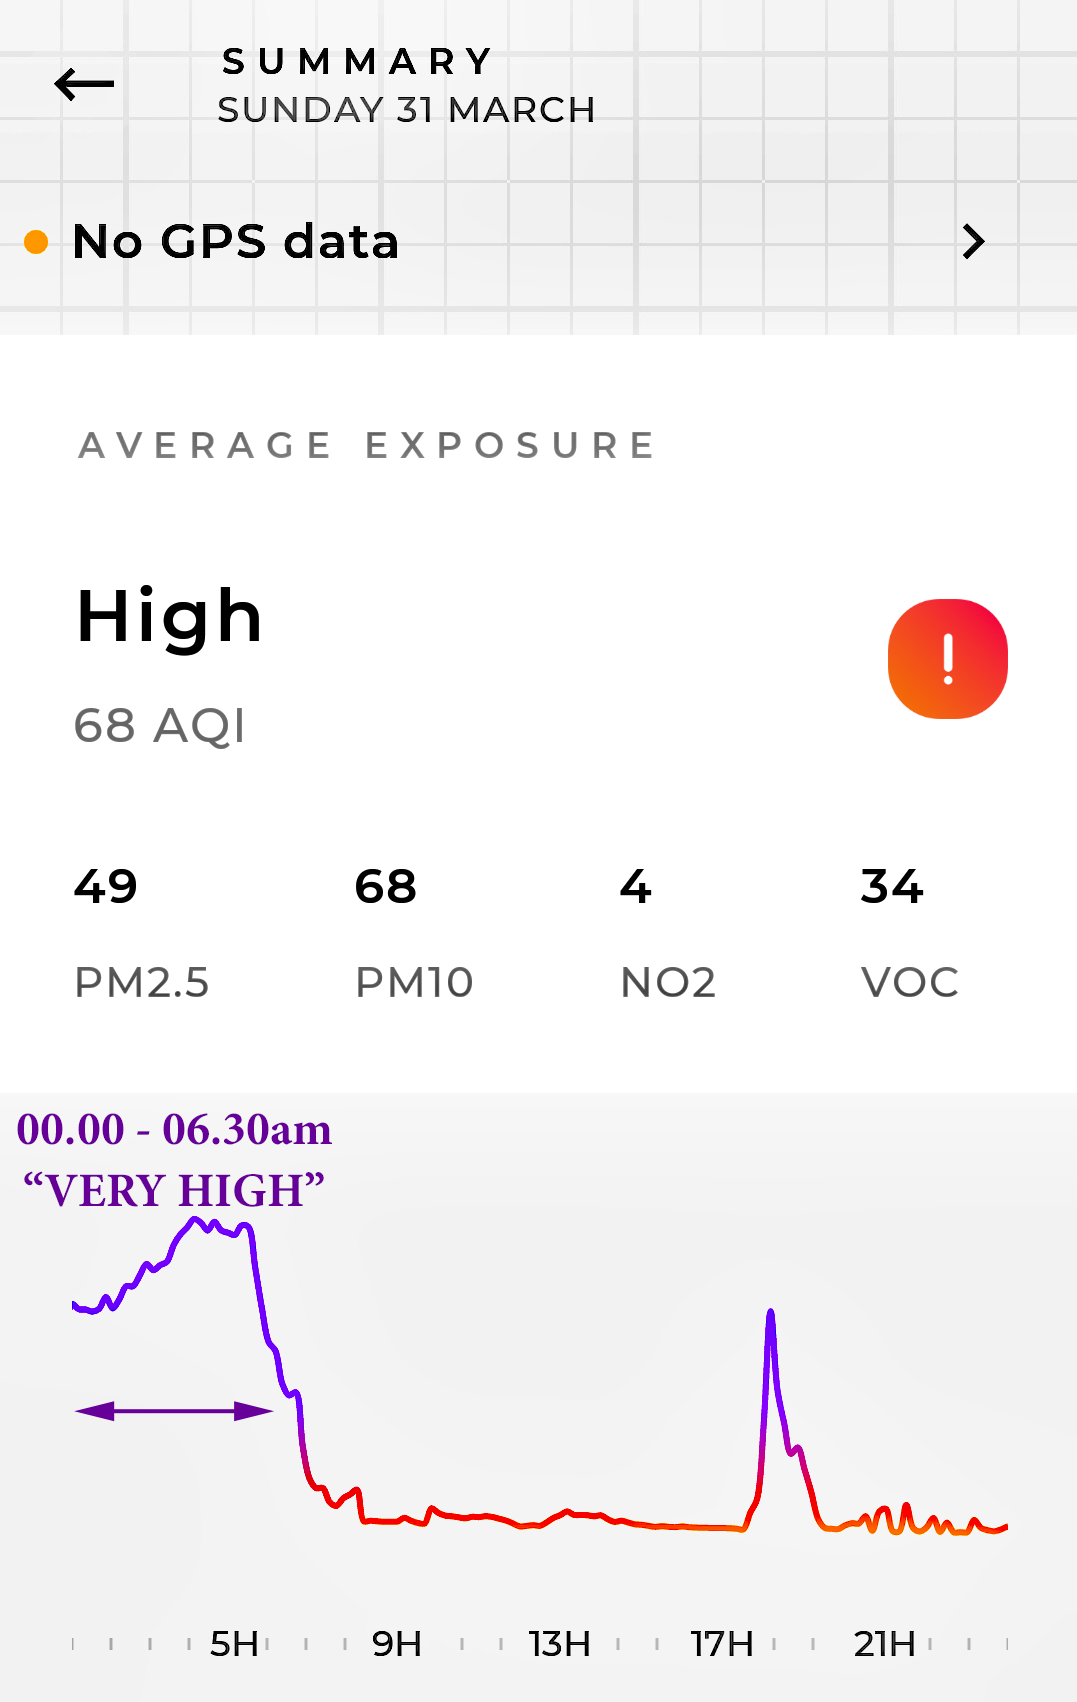
| 31 March | 49 | 68 | 4 | 34 | HIGH | Exceedance | Exceedances:- 00.00am - 0630am |
Graph. Wind NE - ENE (25kph); Rain 0.5mm |
| APRIL 2019 | ||||||||
| Toxic Pollution Levels | Exceedances (time and duration) | |||||||
| Date | PM2.5 | PM10 | NO2 | VOCs | Daily Average |
High (24 hours or more) |
Very High + (1 hour or more) |
Graphs, Maps and Comments |
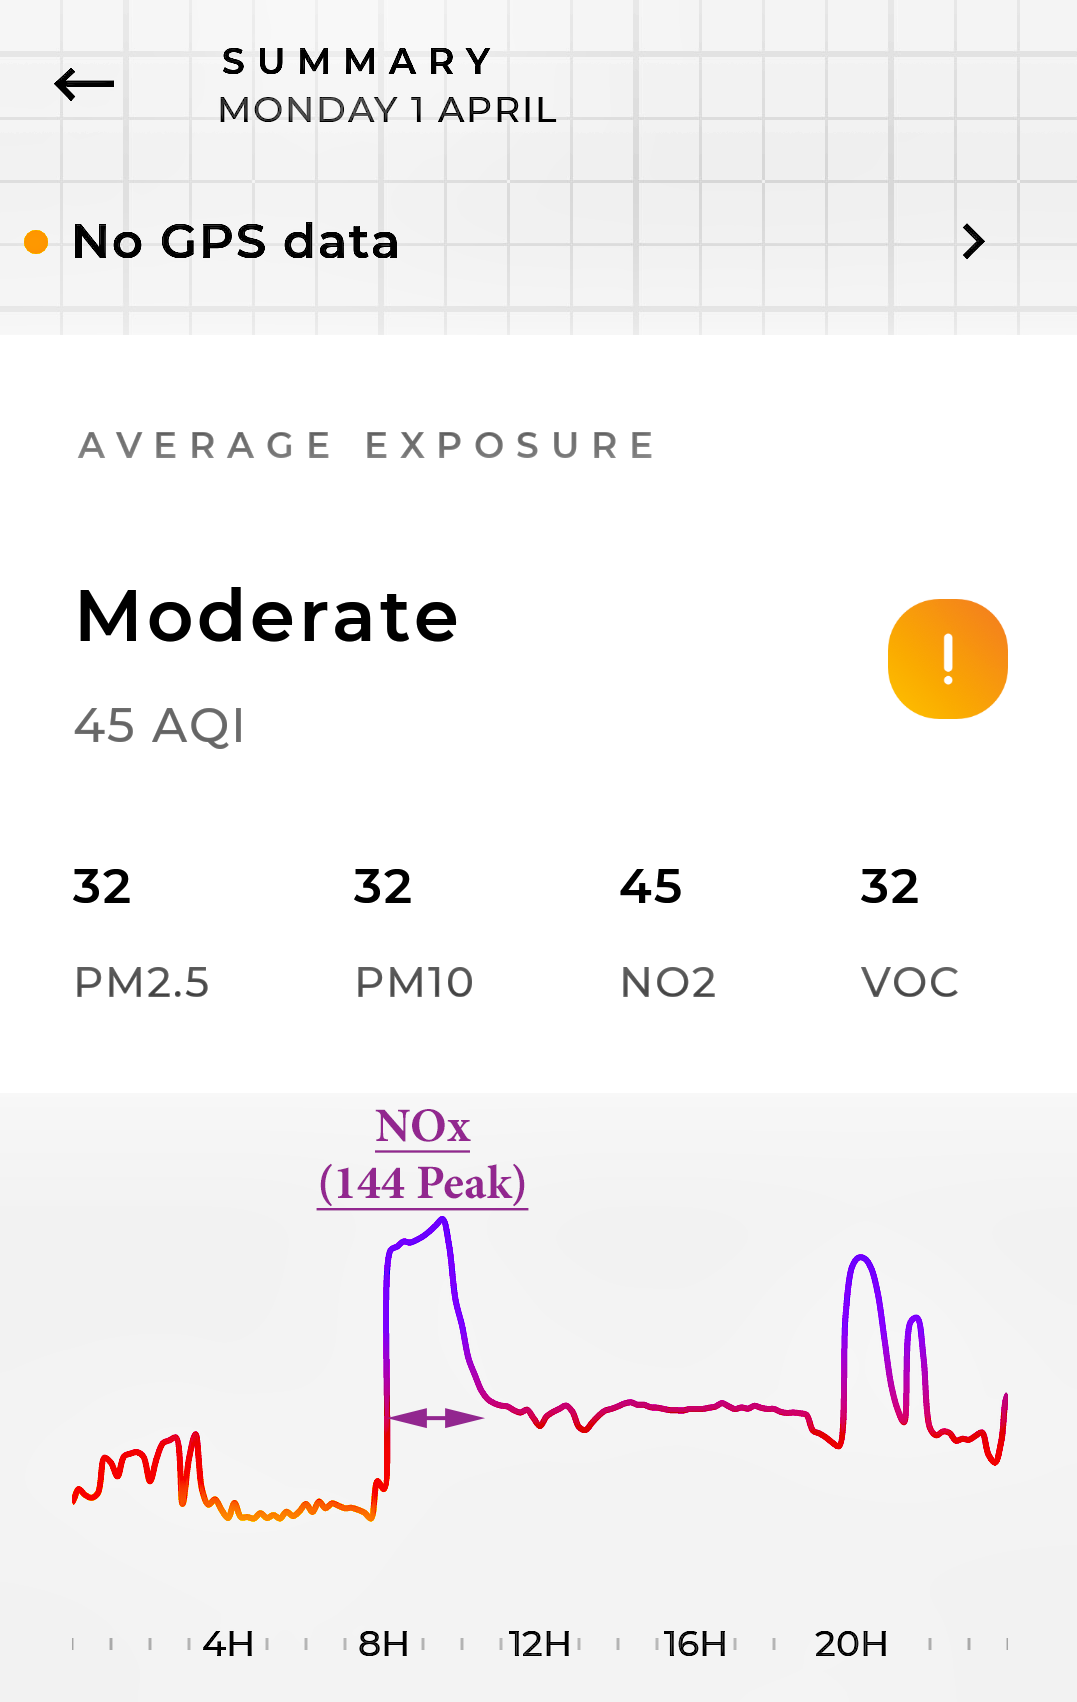
| 1 April | 32 | 32 | 45 | 32 | MODERATE | Exceedances:- 08.00am - 10.00am; 19.46pm - 20.47pm - NOx - |
Graph. NOx highest. Wind ENE. Rain 0.7mm. | |
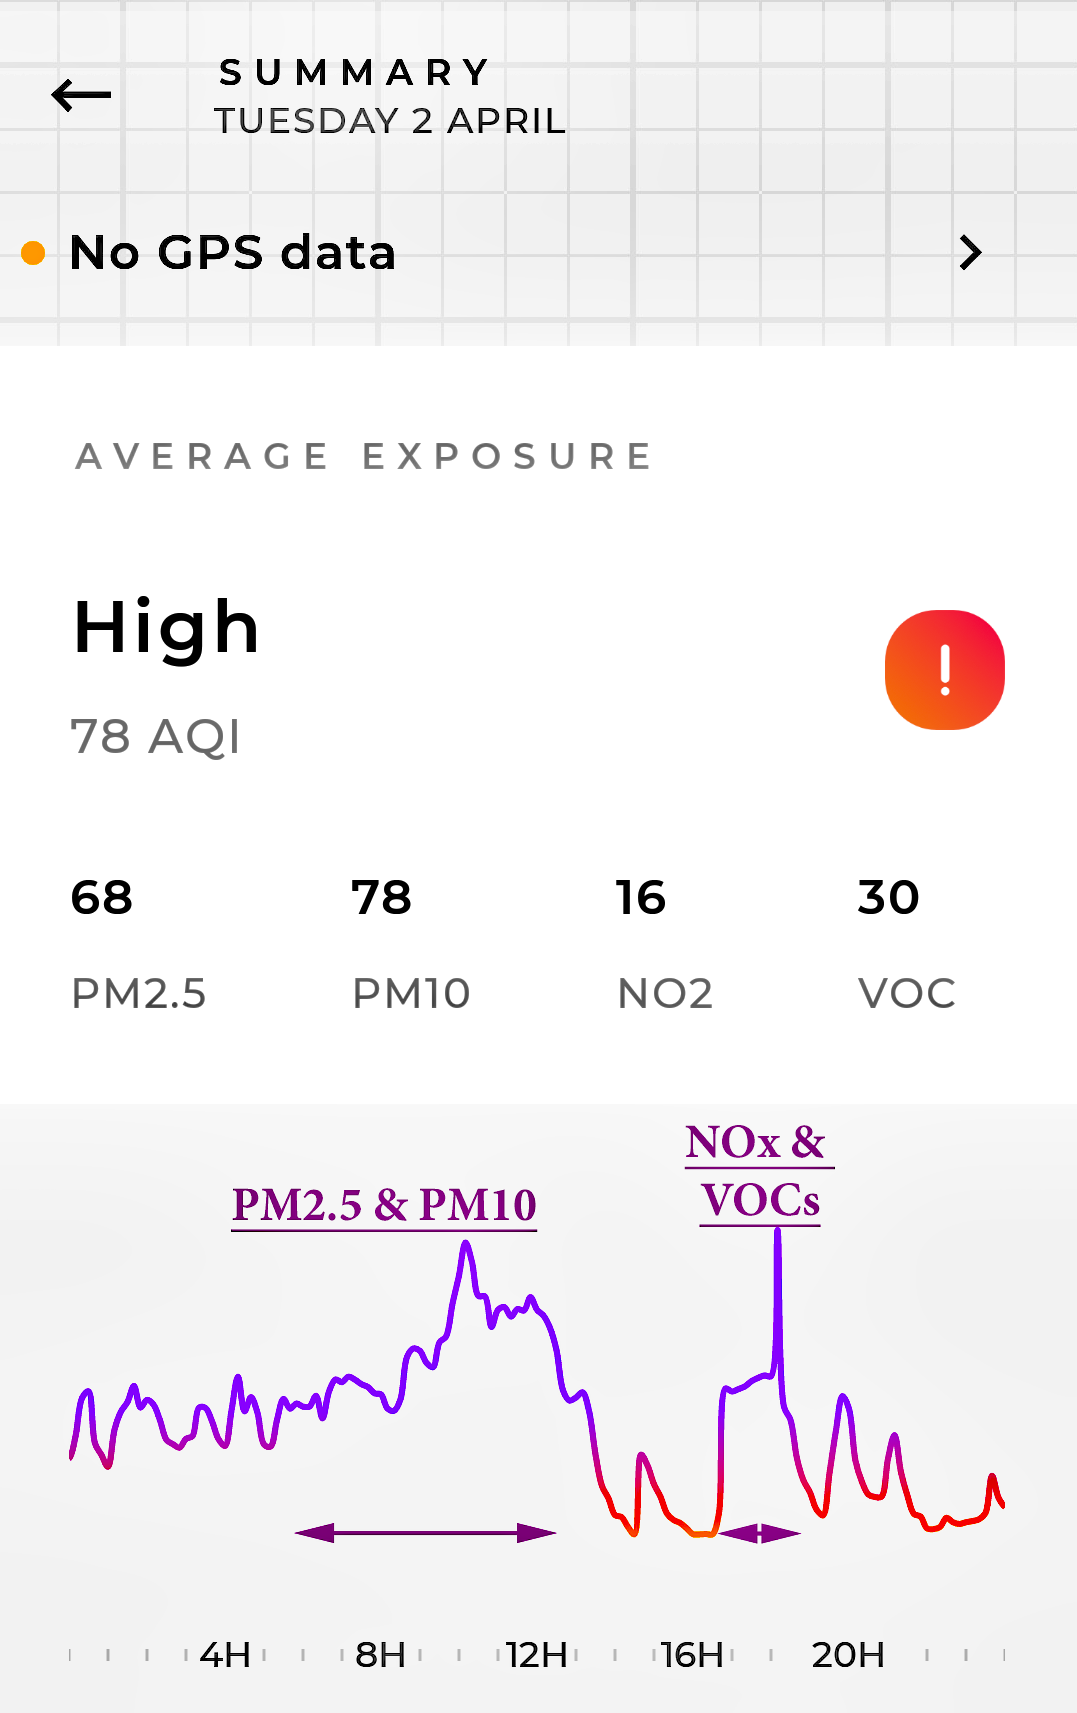
| 2 April | 68 | 78 | 16 | 30 | HIGH | Exceedance | Exceedances:- 06.33am - 13.20pm - PM2.5 & PM10 - 16.50pm - 18.20pm - NOx & VOCs - |
Graph. PMs in morning; NOx and VOCs in evening. Wind N - SW - W. Rain 6.60mm. |
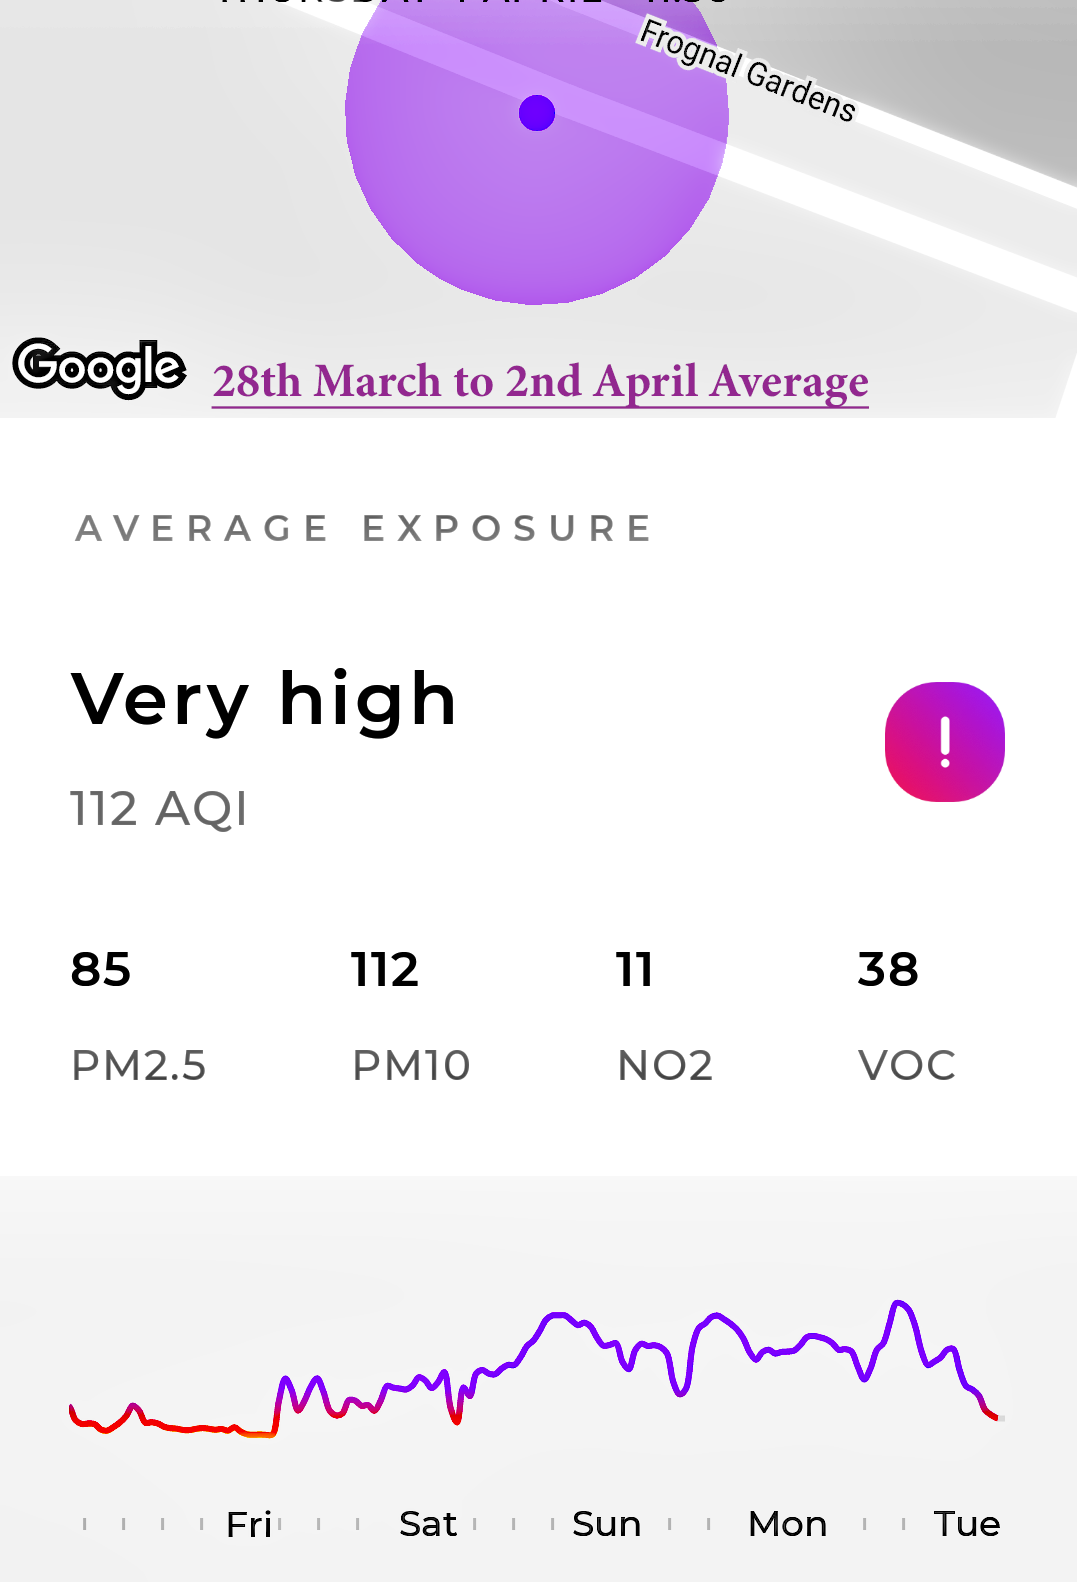
| 28 March to 2 April Average |
85 | 112 | 11 | 38 | VERY HIGH |
Exceedance | Dominated by PM10 pollution. "Spot" monitoring (i.e. not jogging) | Graph. |
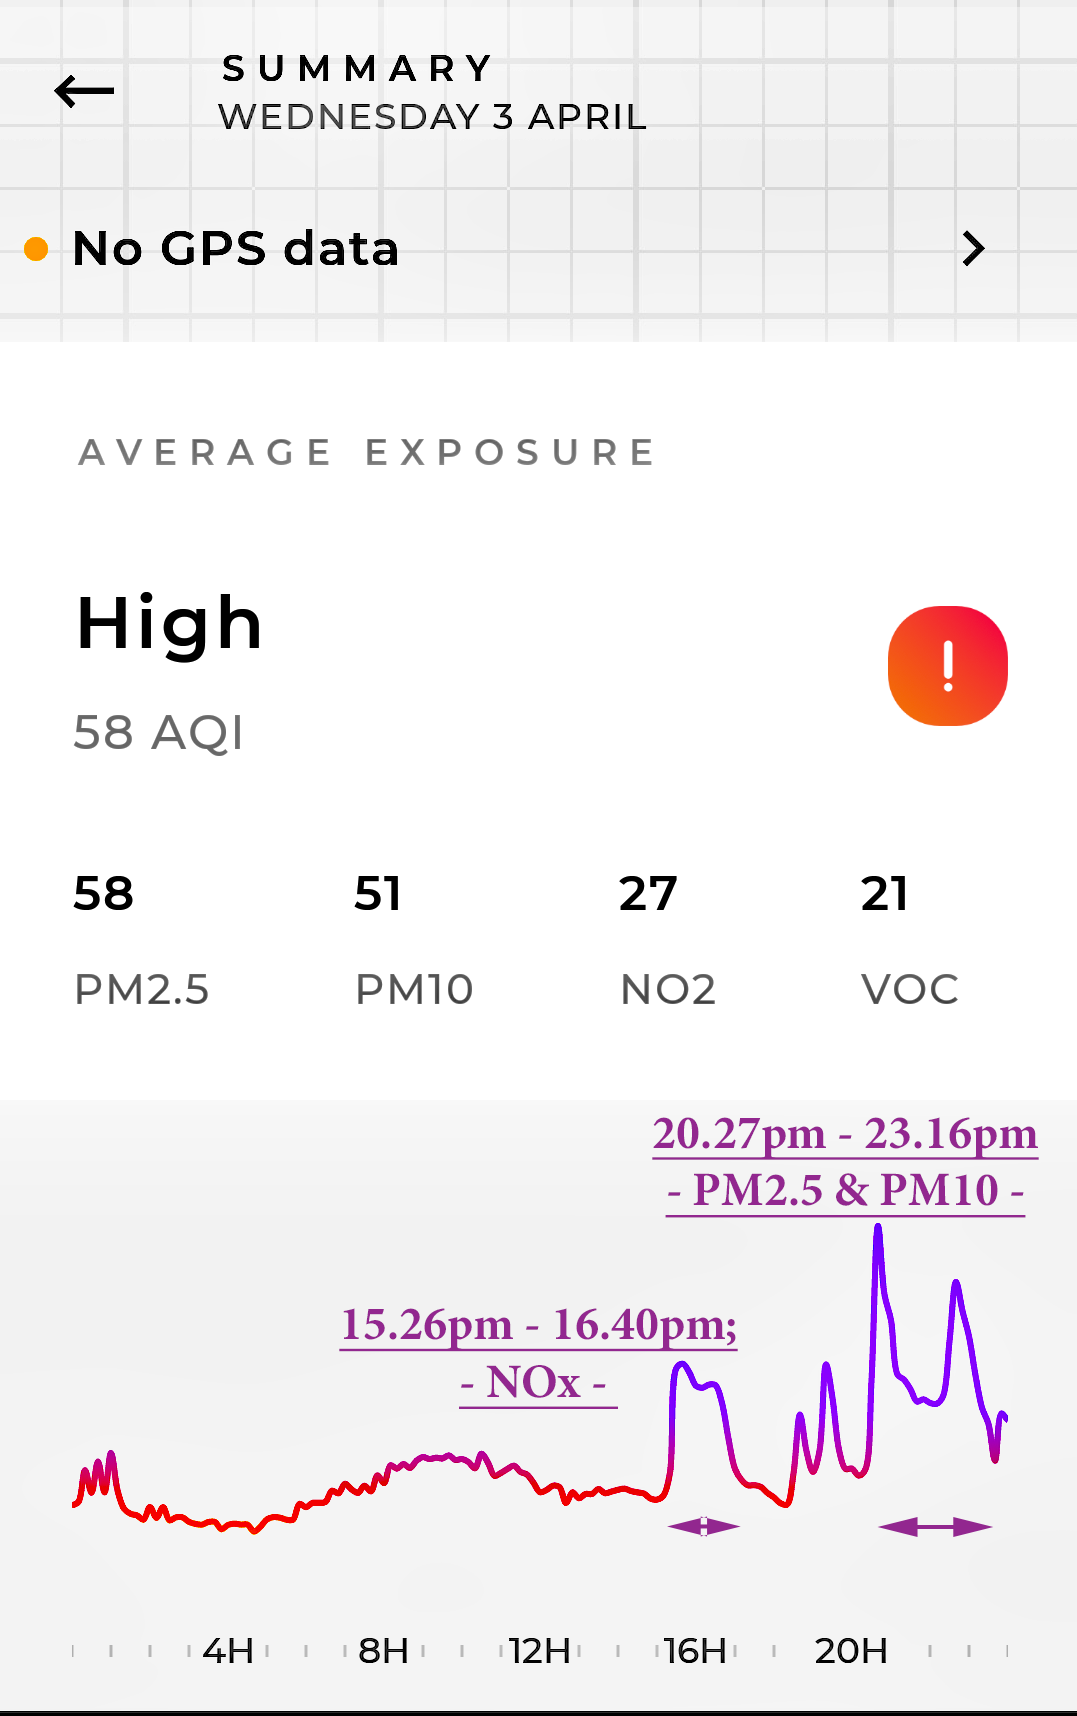
| 3 April | 58 | 51 | 27 | 21 | HIGH | Exceedance | Exceedances:- 15.26pm - 16.40pm; - NOx - 20.27pm - 23.16pm - PM2.5 & PM10 - |
Graph. Wind SW - N - SE - SSW (8kph); Rain 5.1mm |
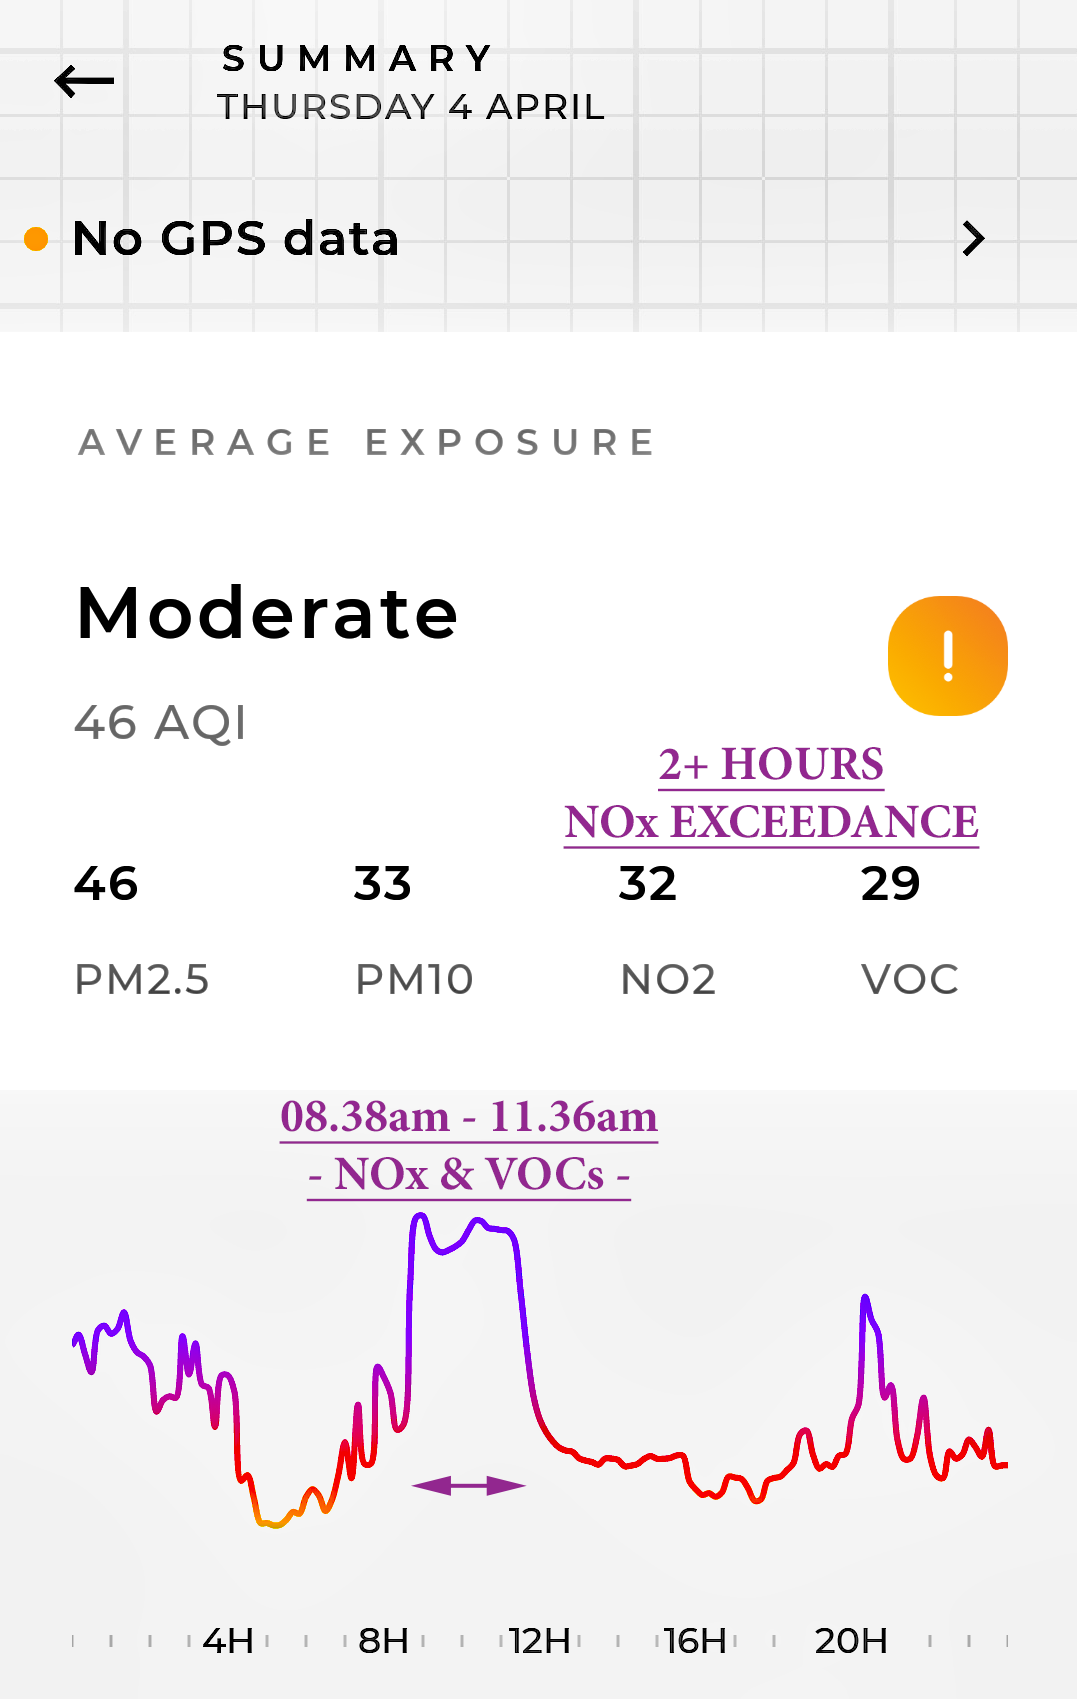
| 4 April | 46 | 33 | 32 | 29 | MODERATE | Exceedance:- 08.38am - 11.36am - NOx & VOCs - |
Graph. Wind S - SSE (25kph); Rain 1.2mm. | |
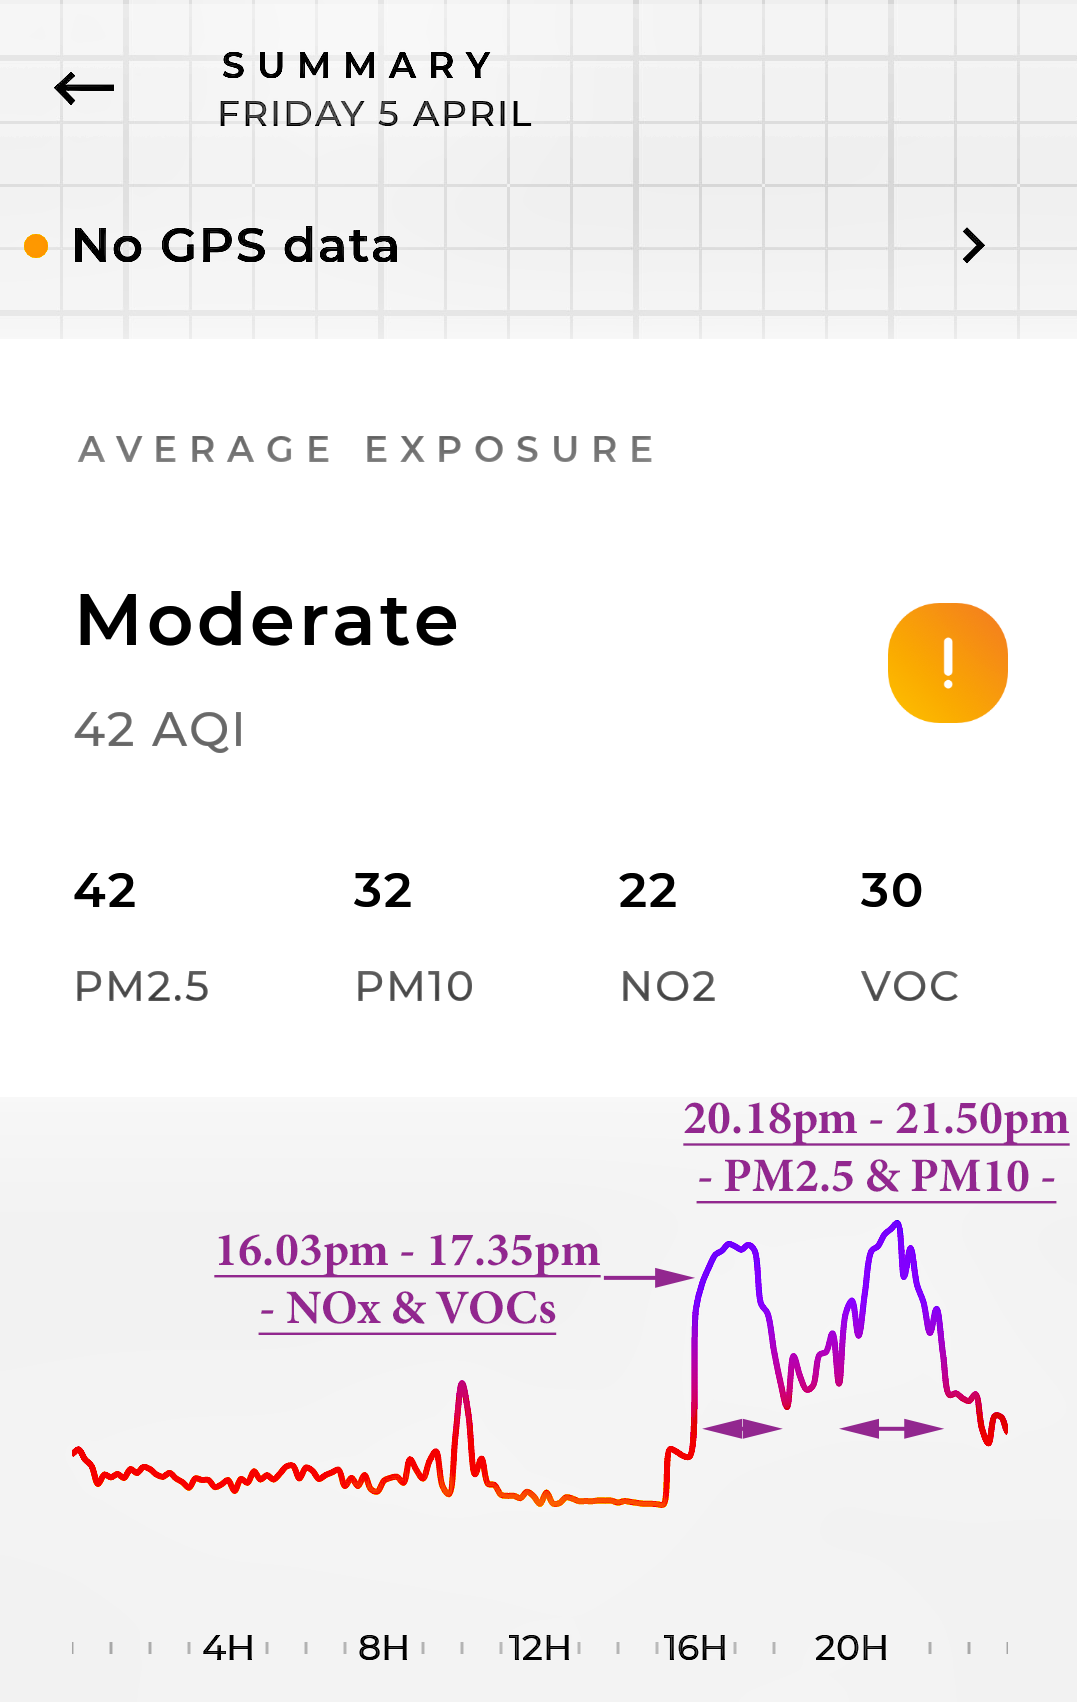
| 5 April | 42 | 32 | 22 | 30 | MODERATE | Exceedances:- 16.03pm - 17.35pm - NOx & VOCs - 20.18pm - 21.50pm - PM2.5 & PM10 - |
Graph. Wind SSE - SE - E (24kph); Dry. Very High exceedance of NOx and VOCs alongside PM2.5 and PM10 | |
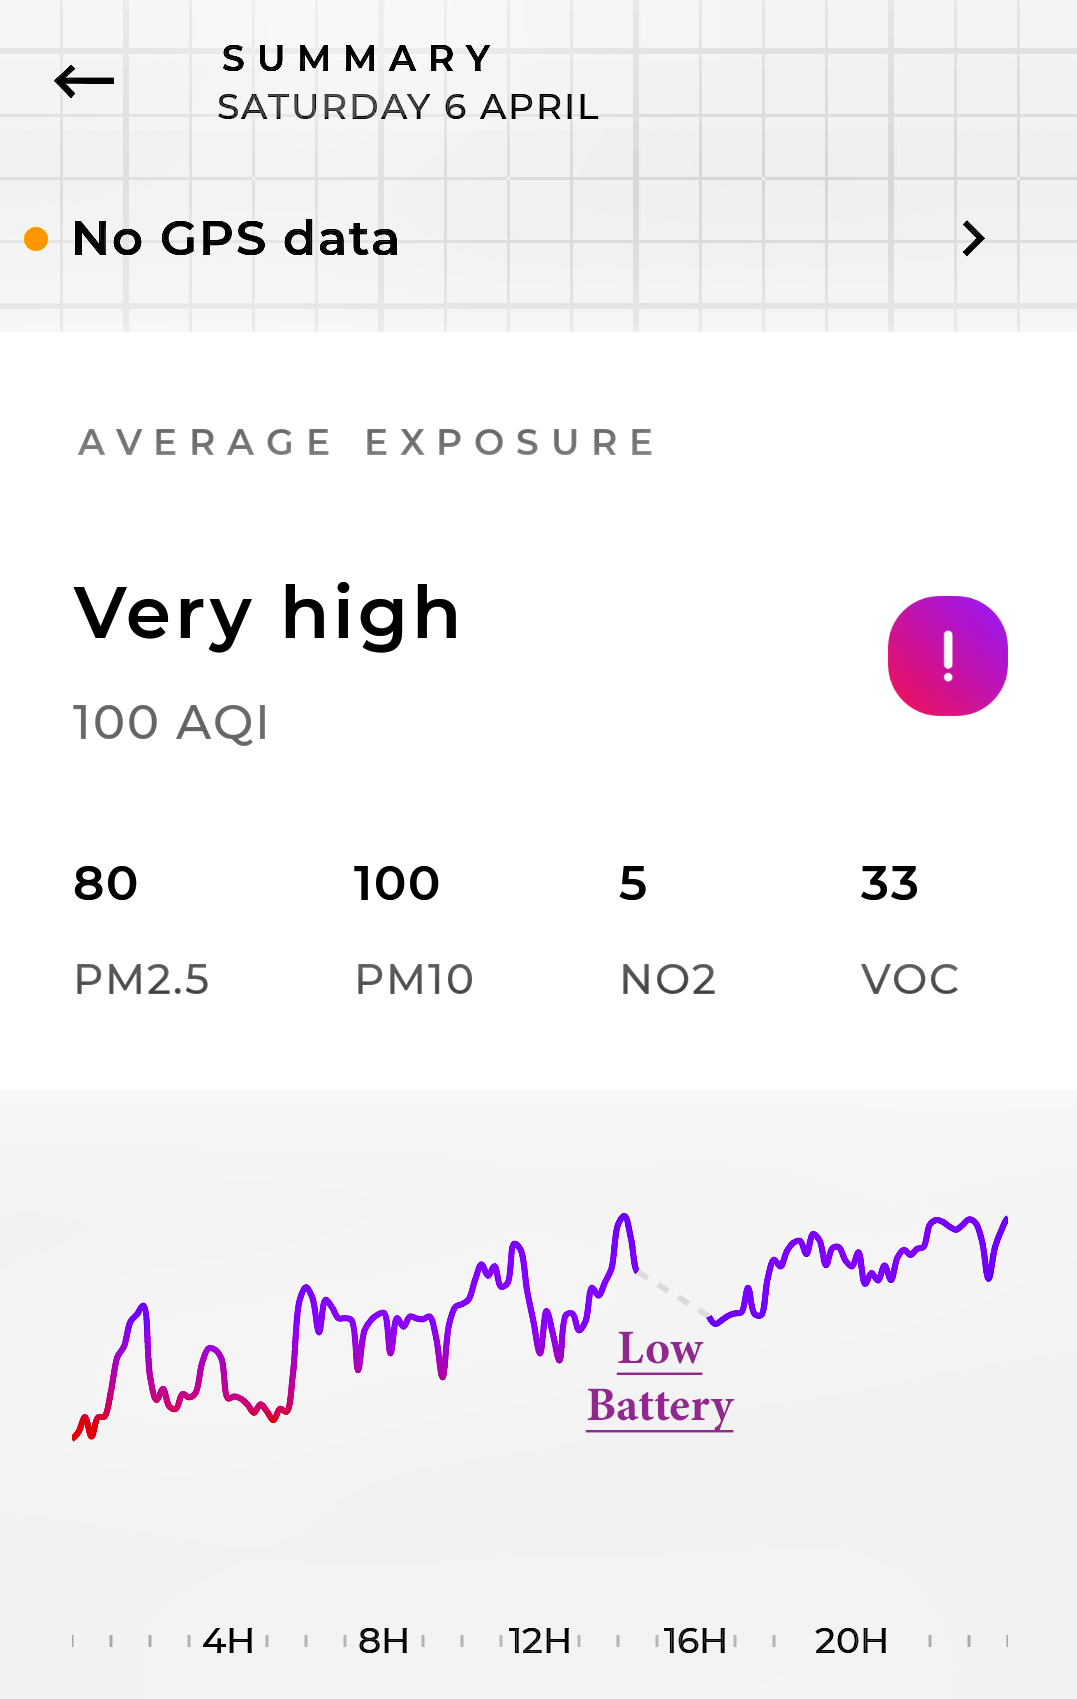
| 6 April | 80 | 100 | 5 | 33 | VERY HIGH |
Exceedance | Exceedances:- Average across the whole day - predominantly PM2.5 and PM10 |
Graph. Wind E - NE (20kph); Rain 0.3mm. Very High exceedances all day and night |
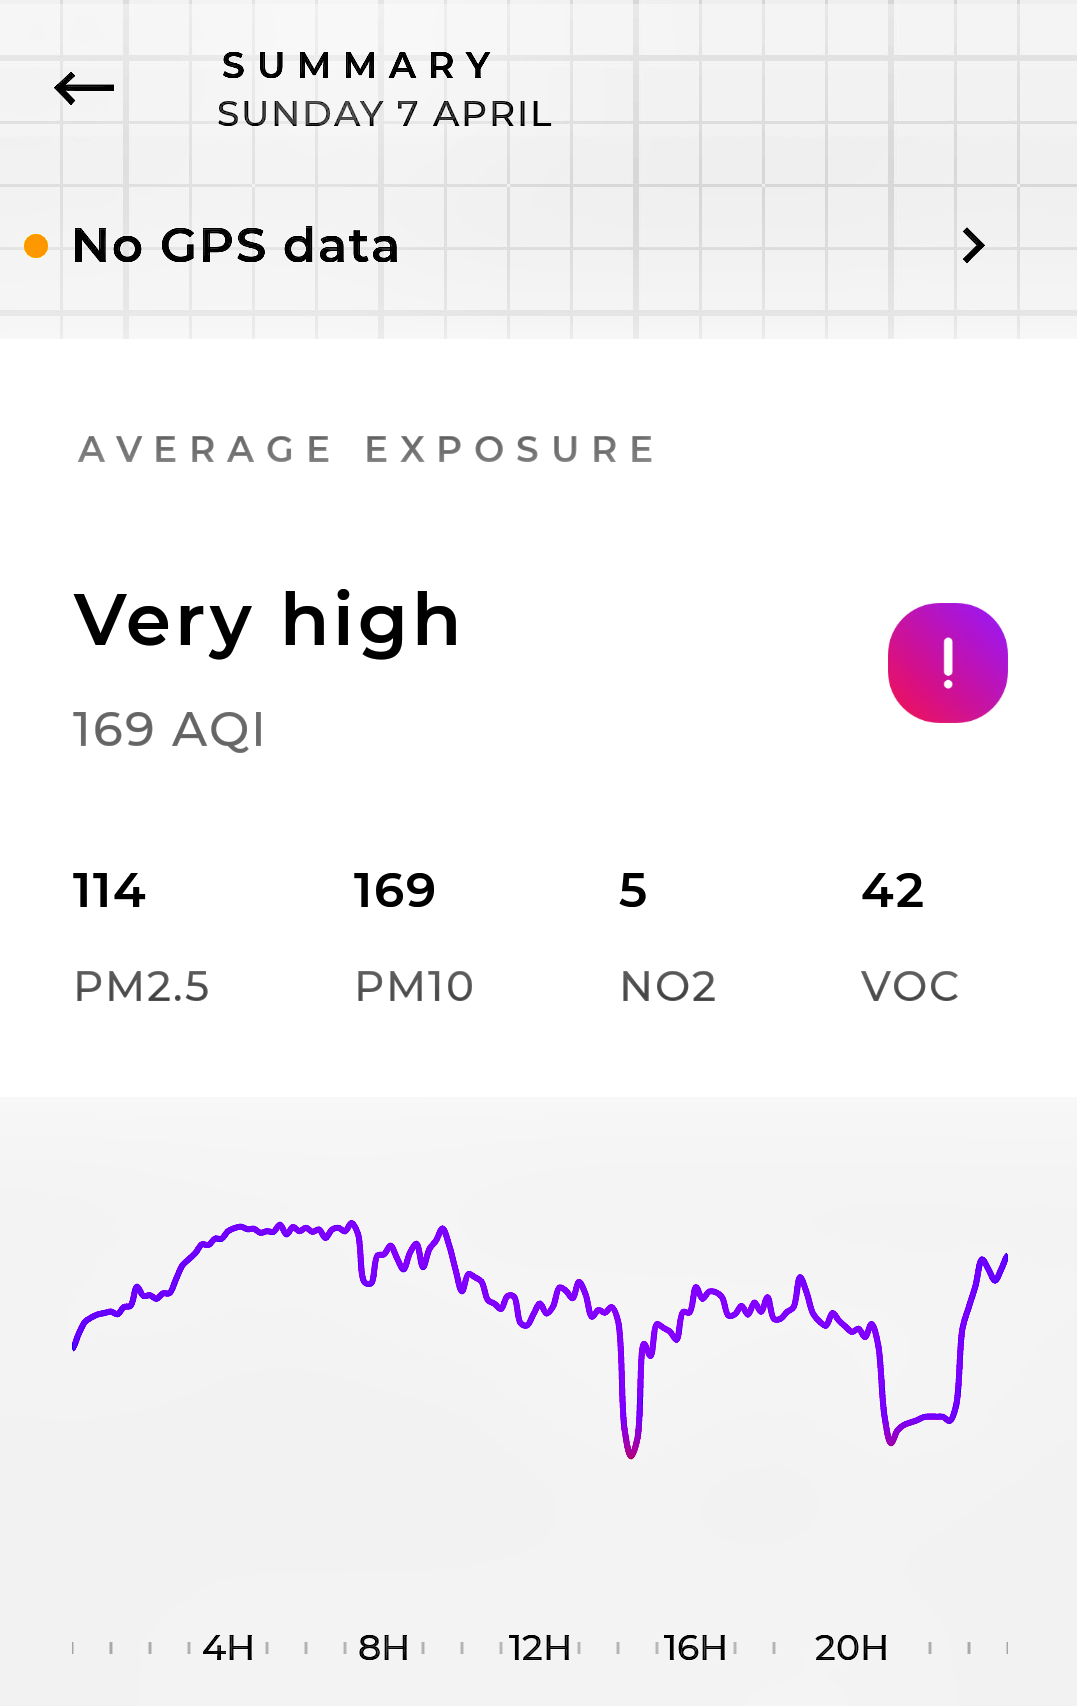
| 7 April | 114 | 169 | 5 | 42 | VERY HIGH |
Exceedance | Exceedances:- Average across the whole day - predominantly PM2.5 and PM10 |
Graph. Wind NE (13kph); Rain 0.3mm. Very High Exceedance all day and night. |
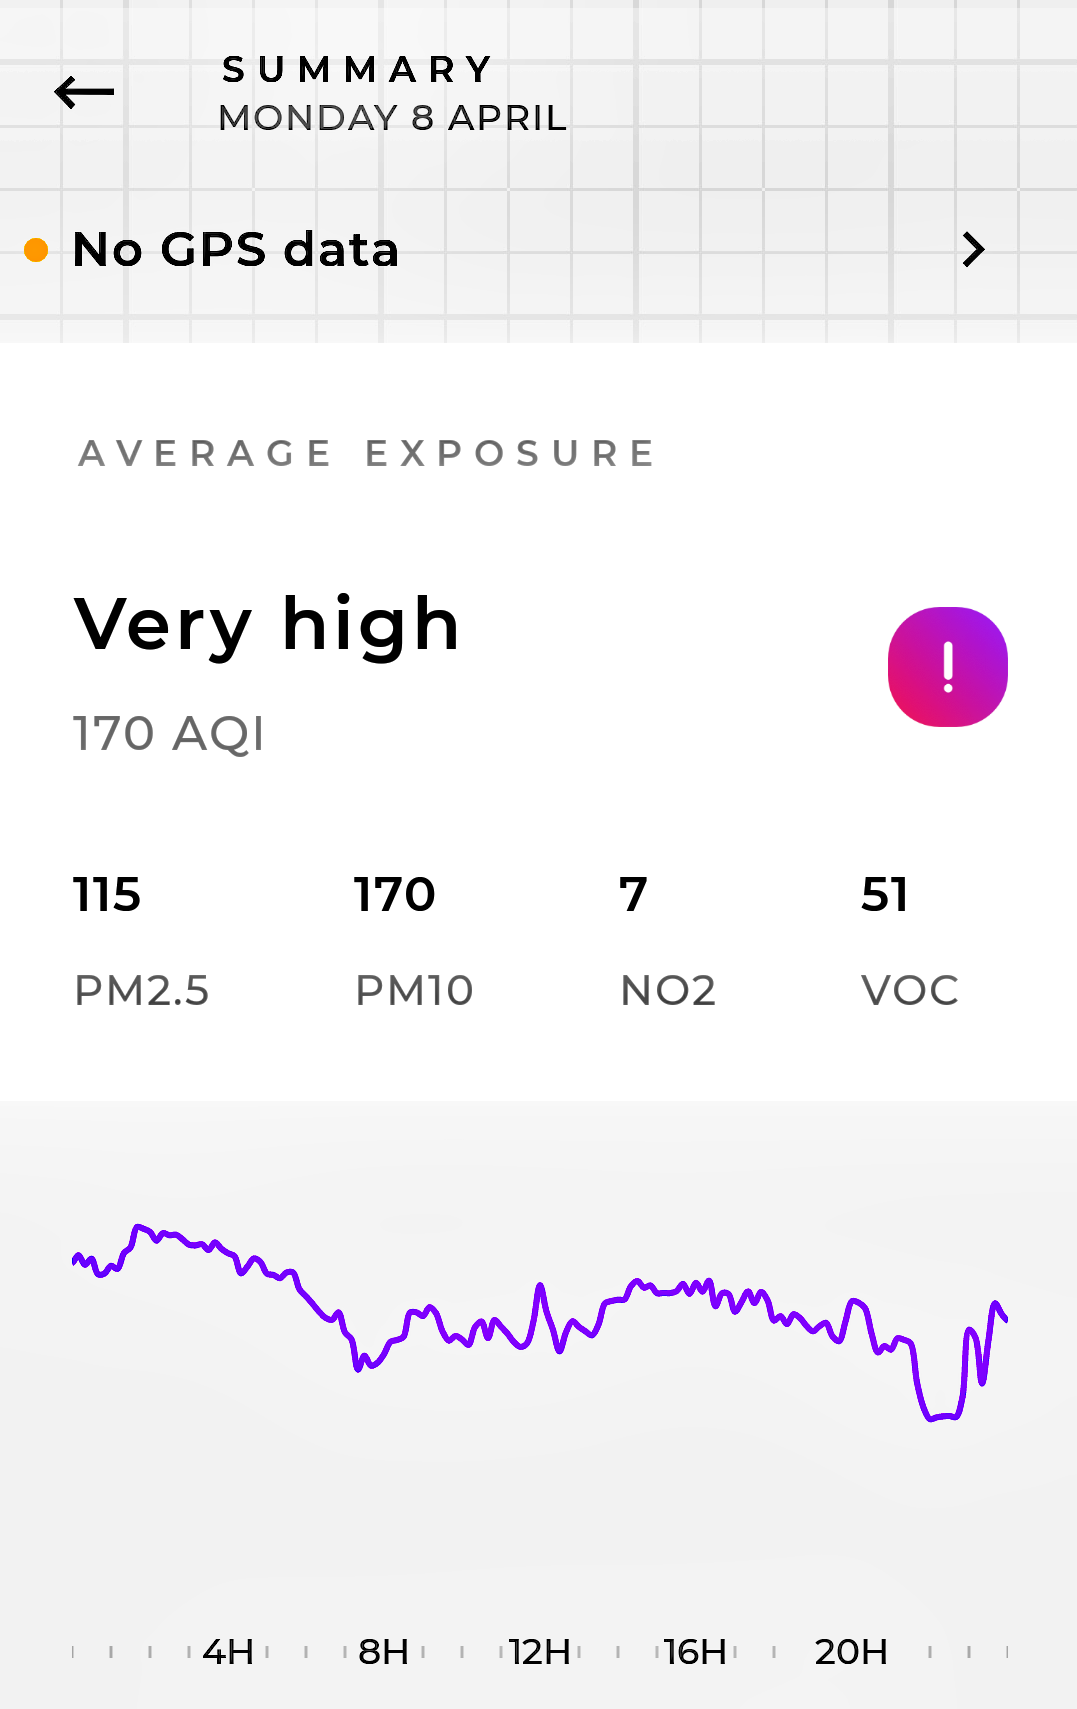
| 8 April | 115 | 170 | 7 | 51 | VERY HIGH |
Exceedance | Exceedances:- Average across the whole day - predominantly PM2.5 and PM10 |
Graph. Wind NNW - W - WSW - NNW (Light); Rain 6.30mm. Very High exceedances all day and night |
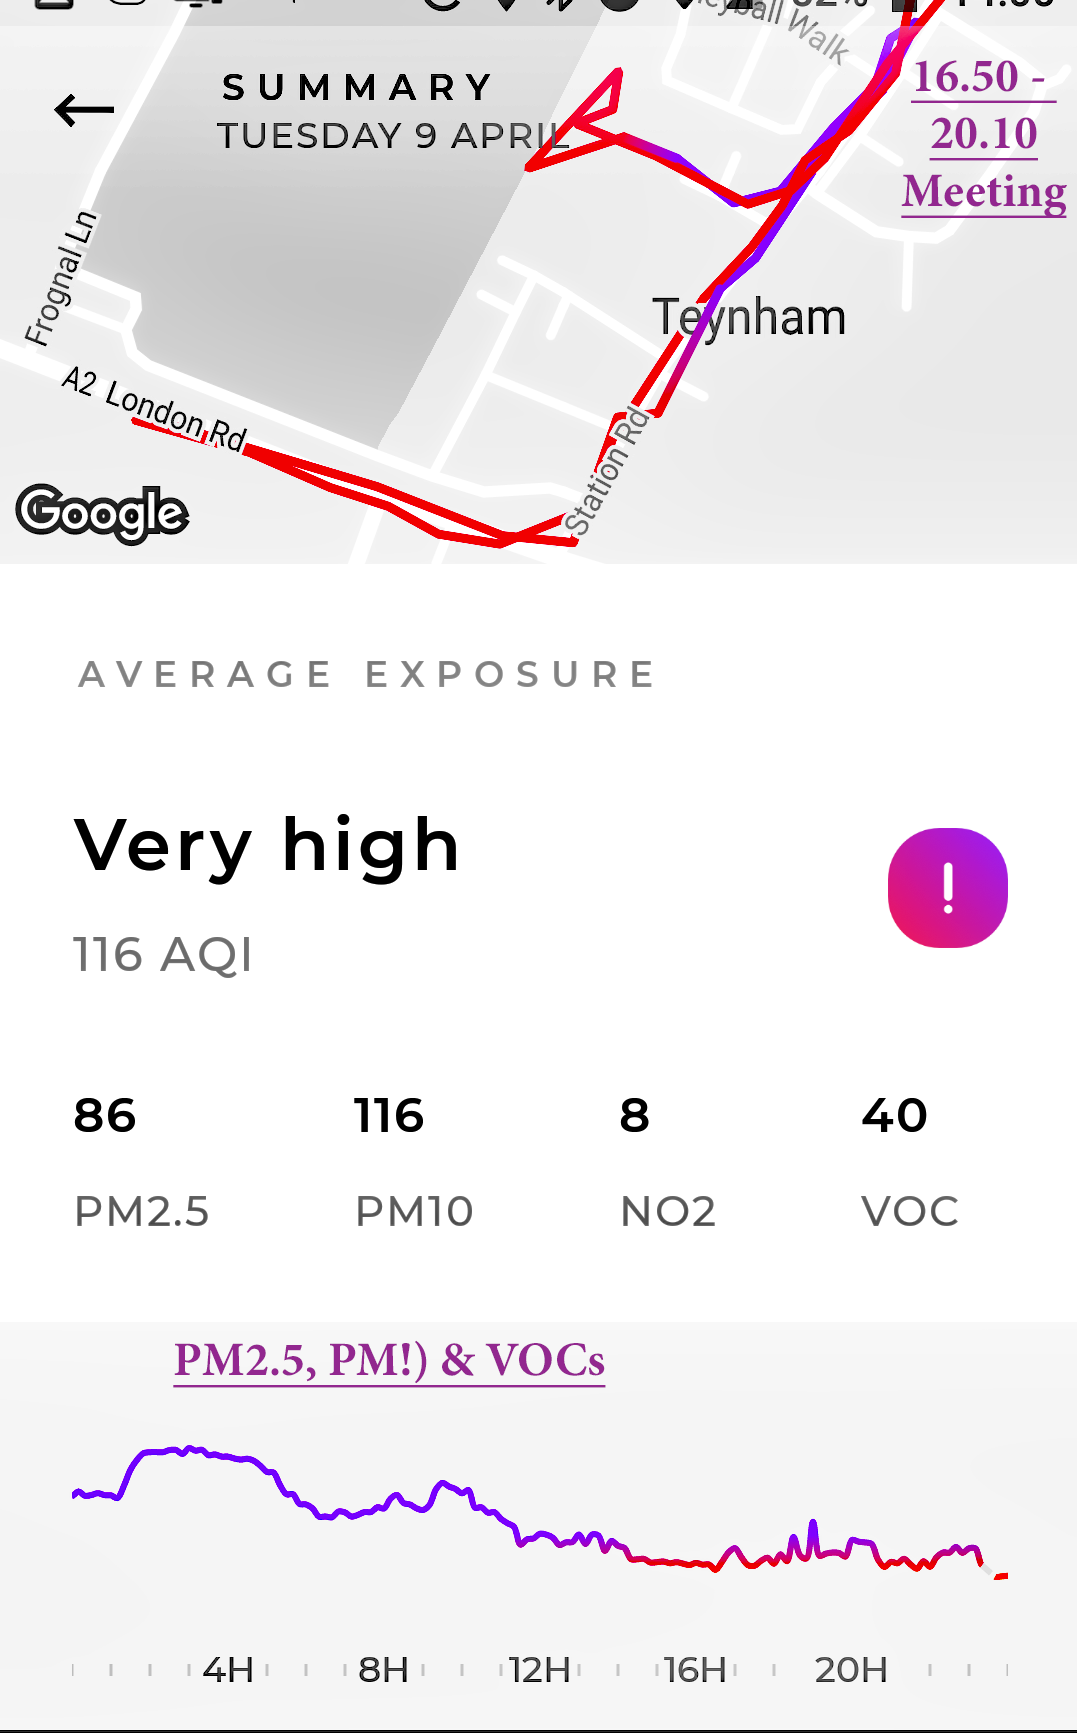
| 9 April | 86 | 116 | 8 | 40 | VERY HIGH |
Exceedance | Exceedances:- Average across the whole day - predominantly PM2.5 and PM10 |
Graph & Map. Wind NNE - NE (20kph); Rain 15.00mm |
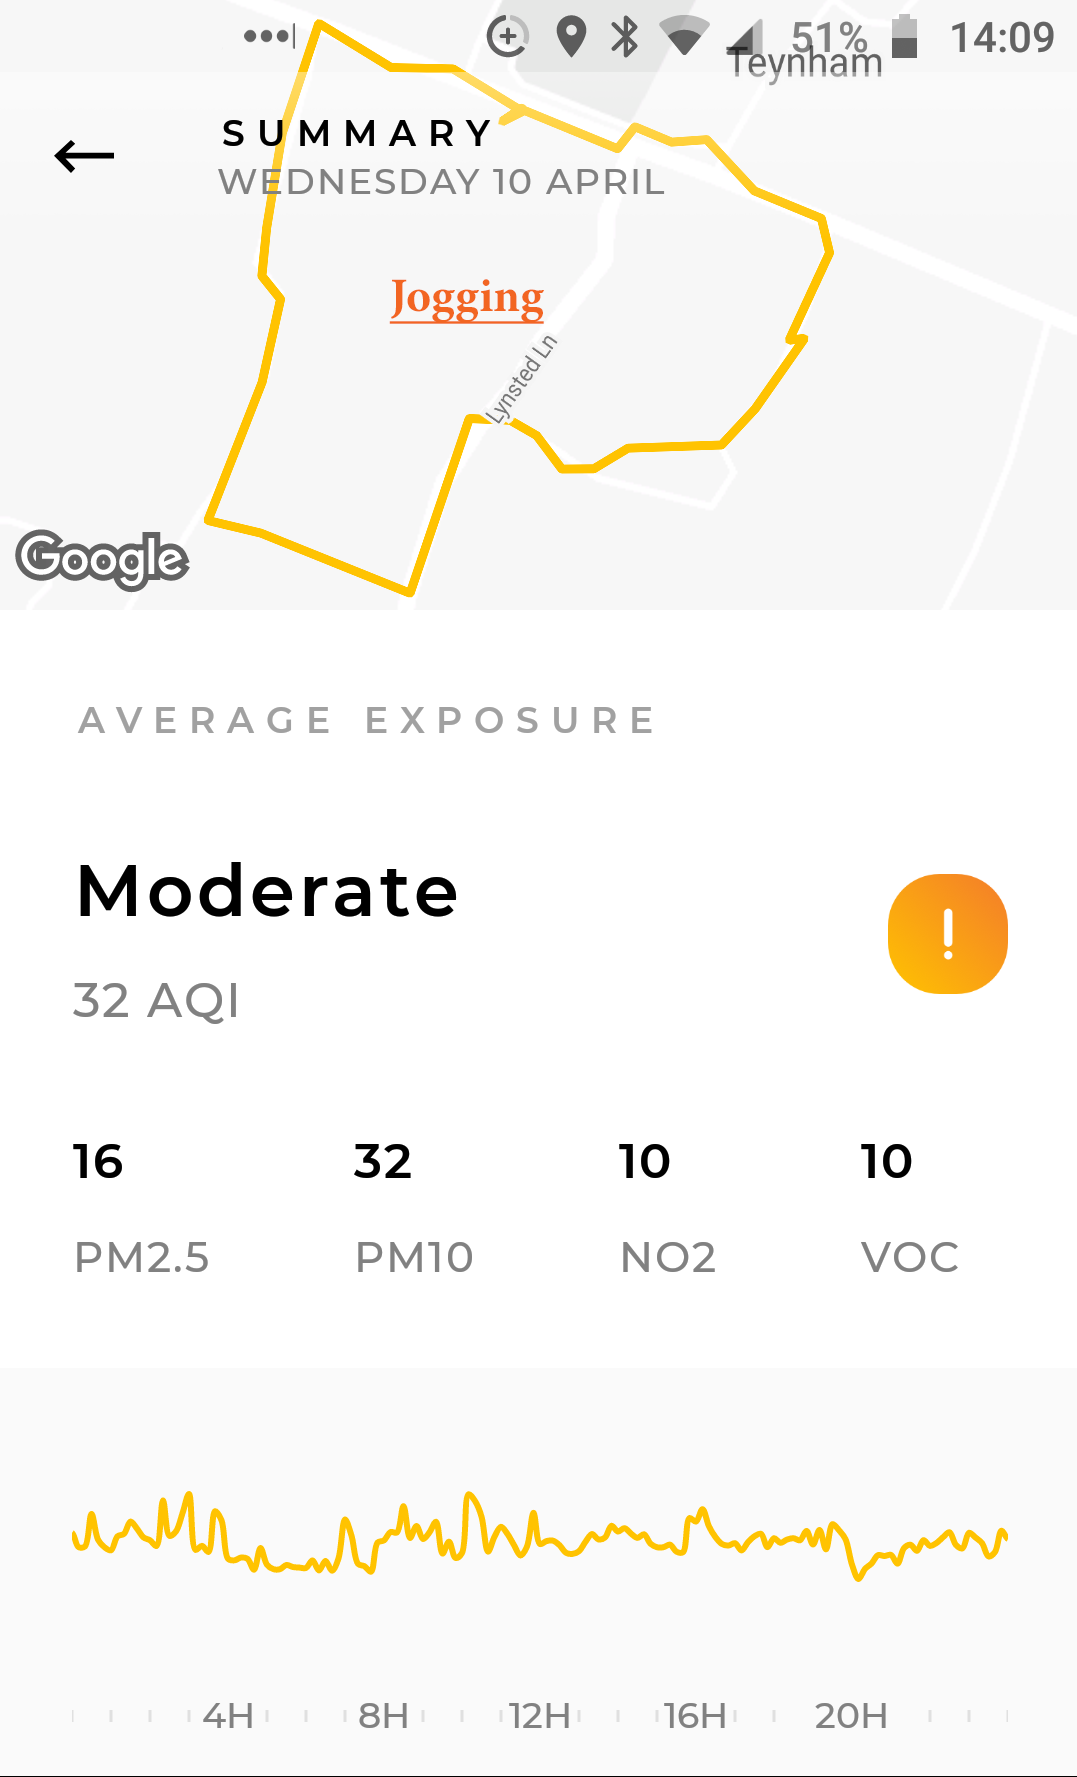
| 10 April | 16 | 32 | 10 | 10 | MODERATE | Graph & Map. Wind NE (25kph); Dry. | ||
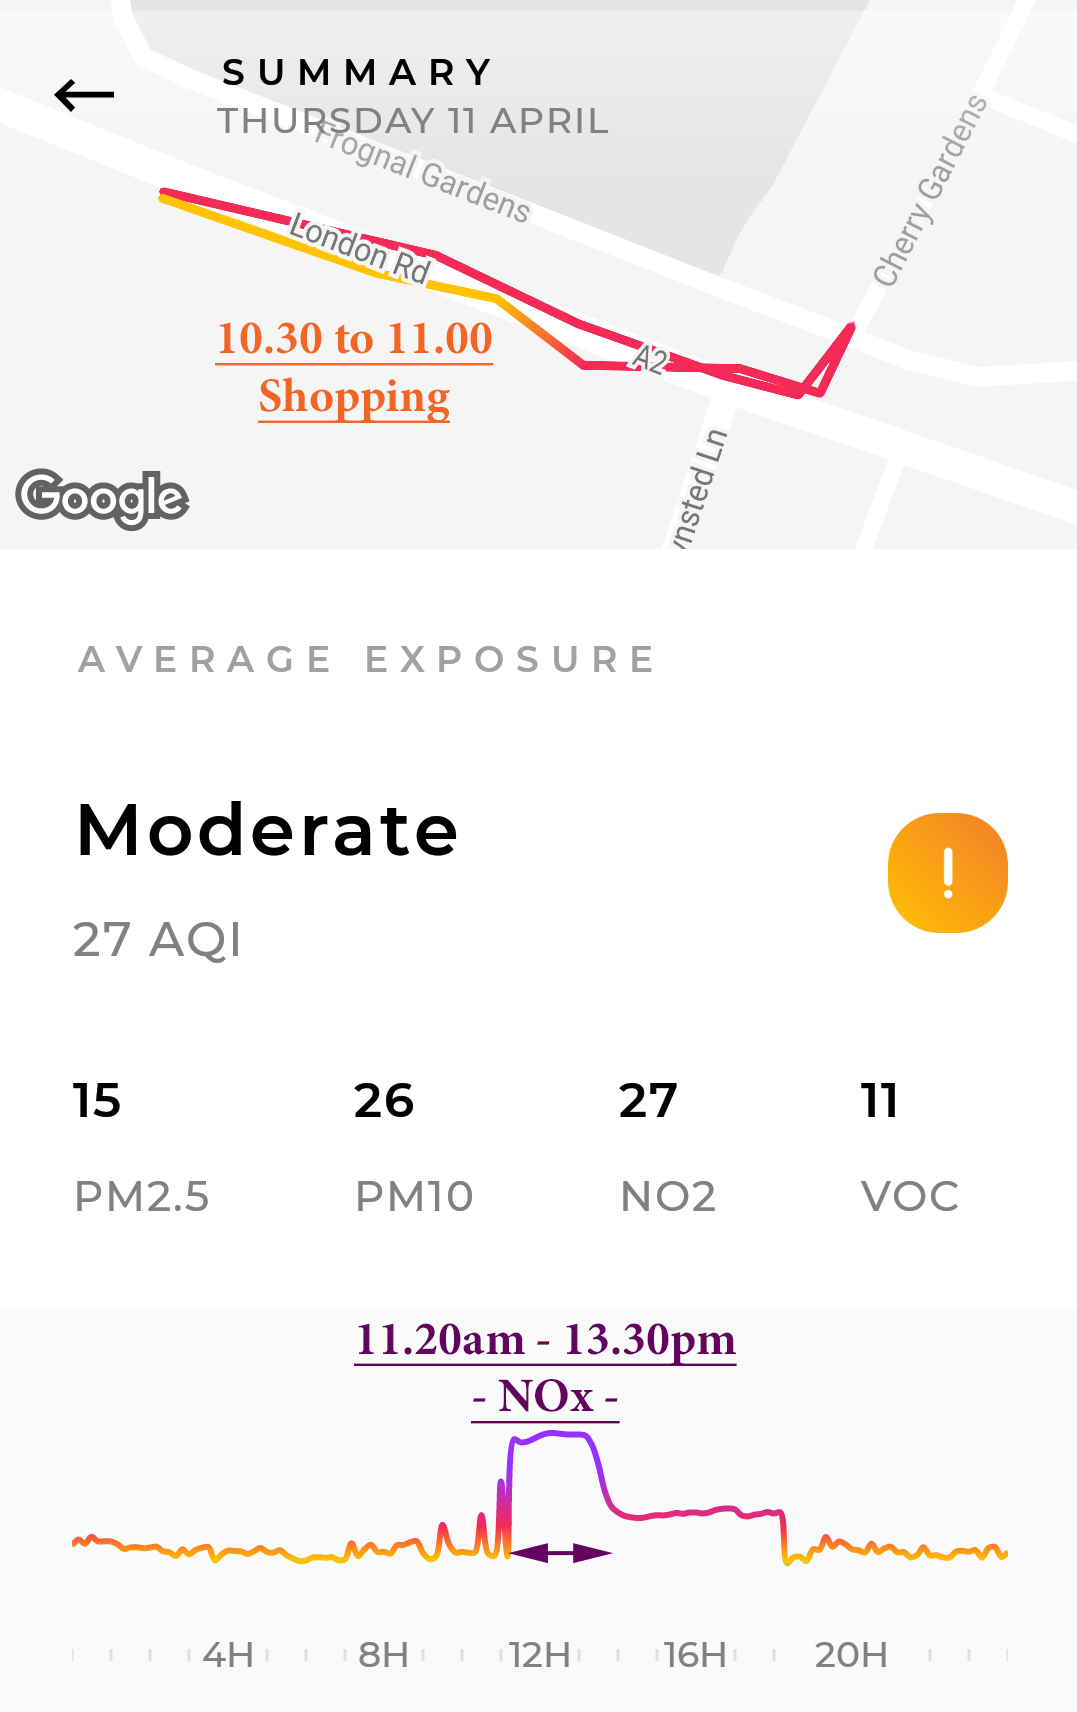
| 11 April | 15 | 26 | 27 | 11 | MODERATE | Exceedance:- 11.20am - 13.30pm - NOx - |
Graph & Map. Wind NE (18kph); Dry. Nitrogen Dioxide Exceedance (NOx) | |
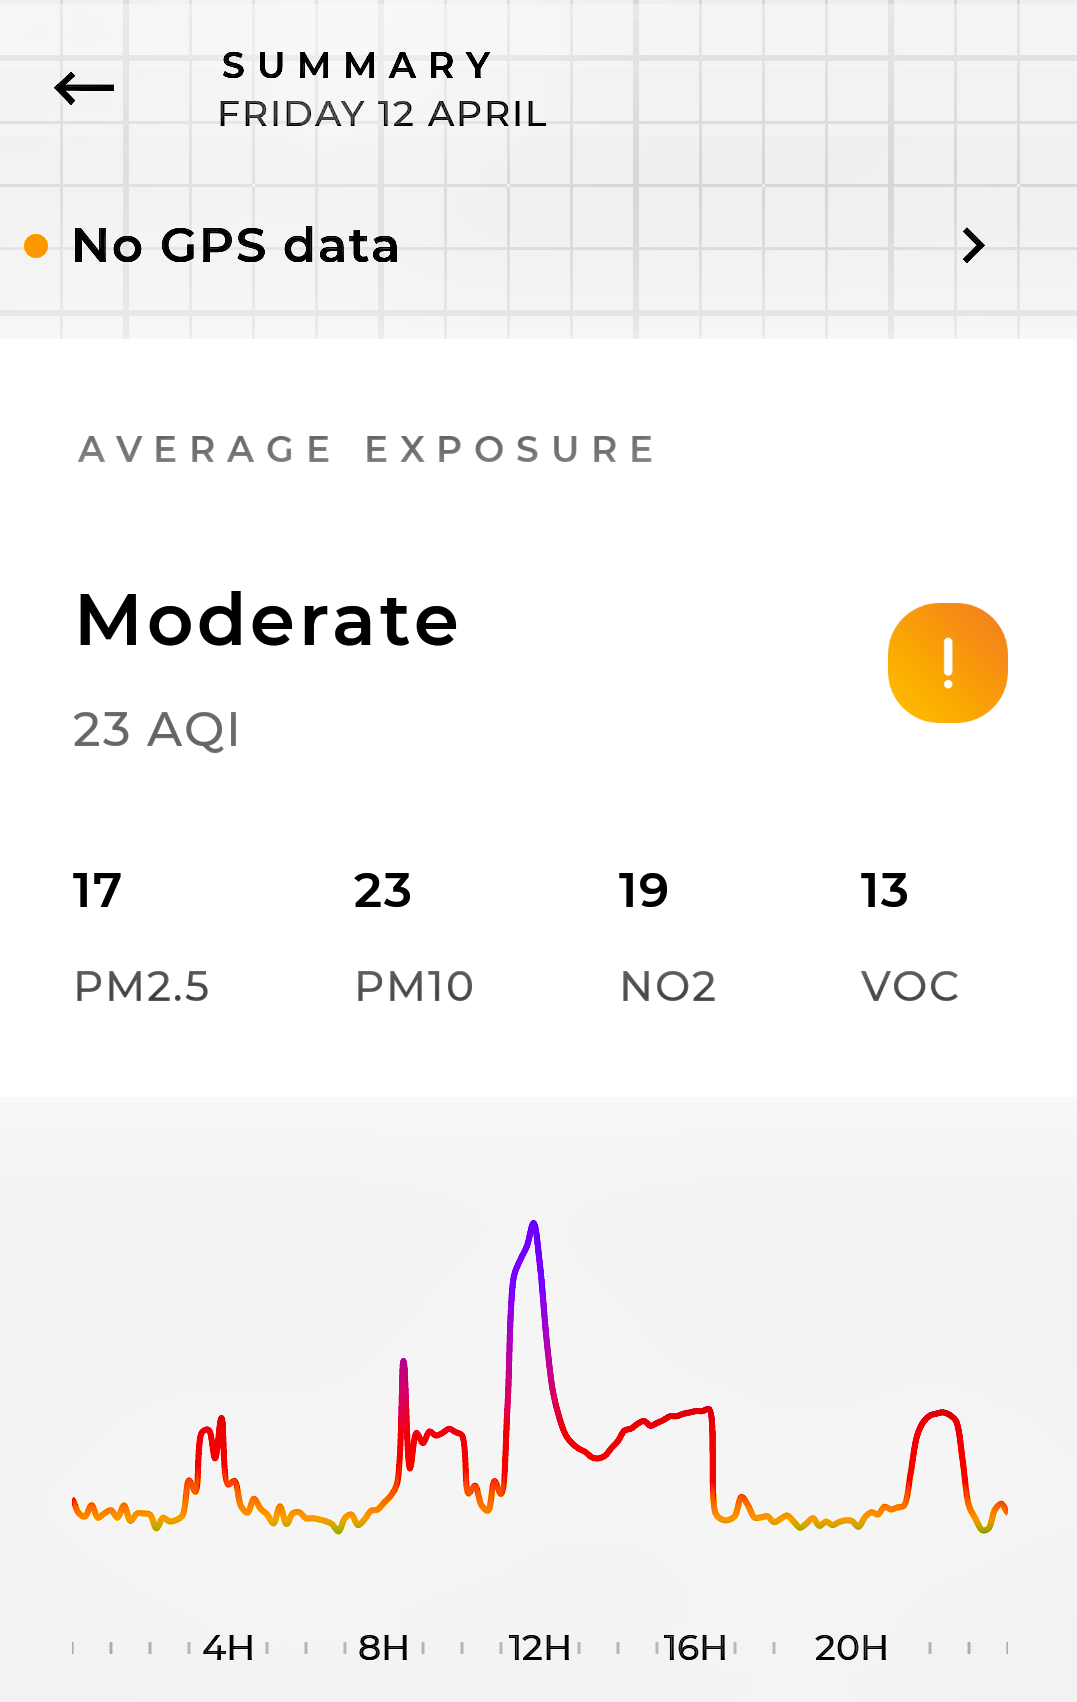
| 12 April | 17 | 23 | 19 | 13 | MODERATE | Graph. Wind NE - ENE (15kph); Rain 0.4mm | ||
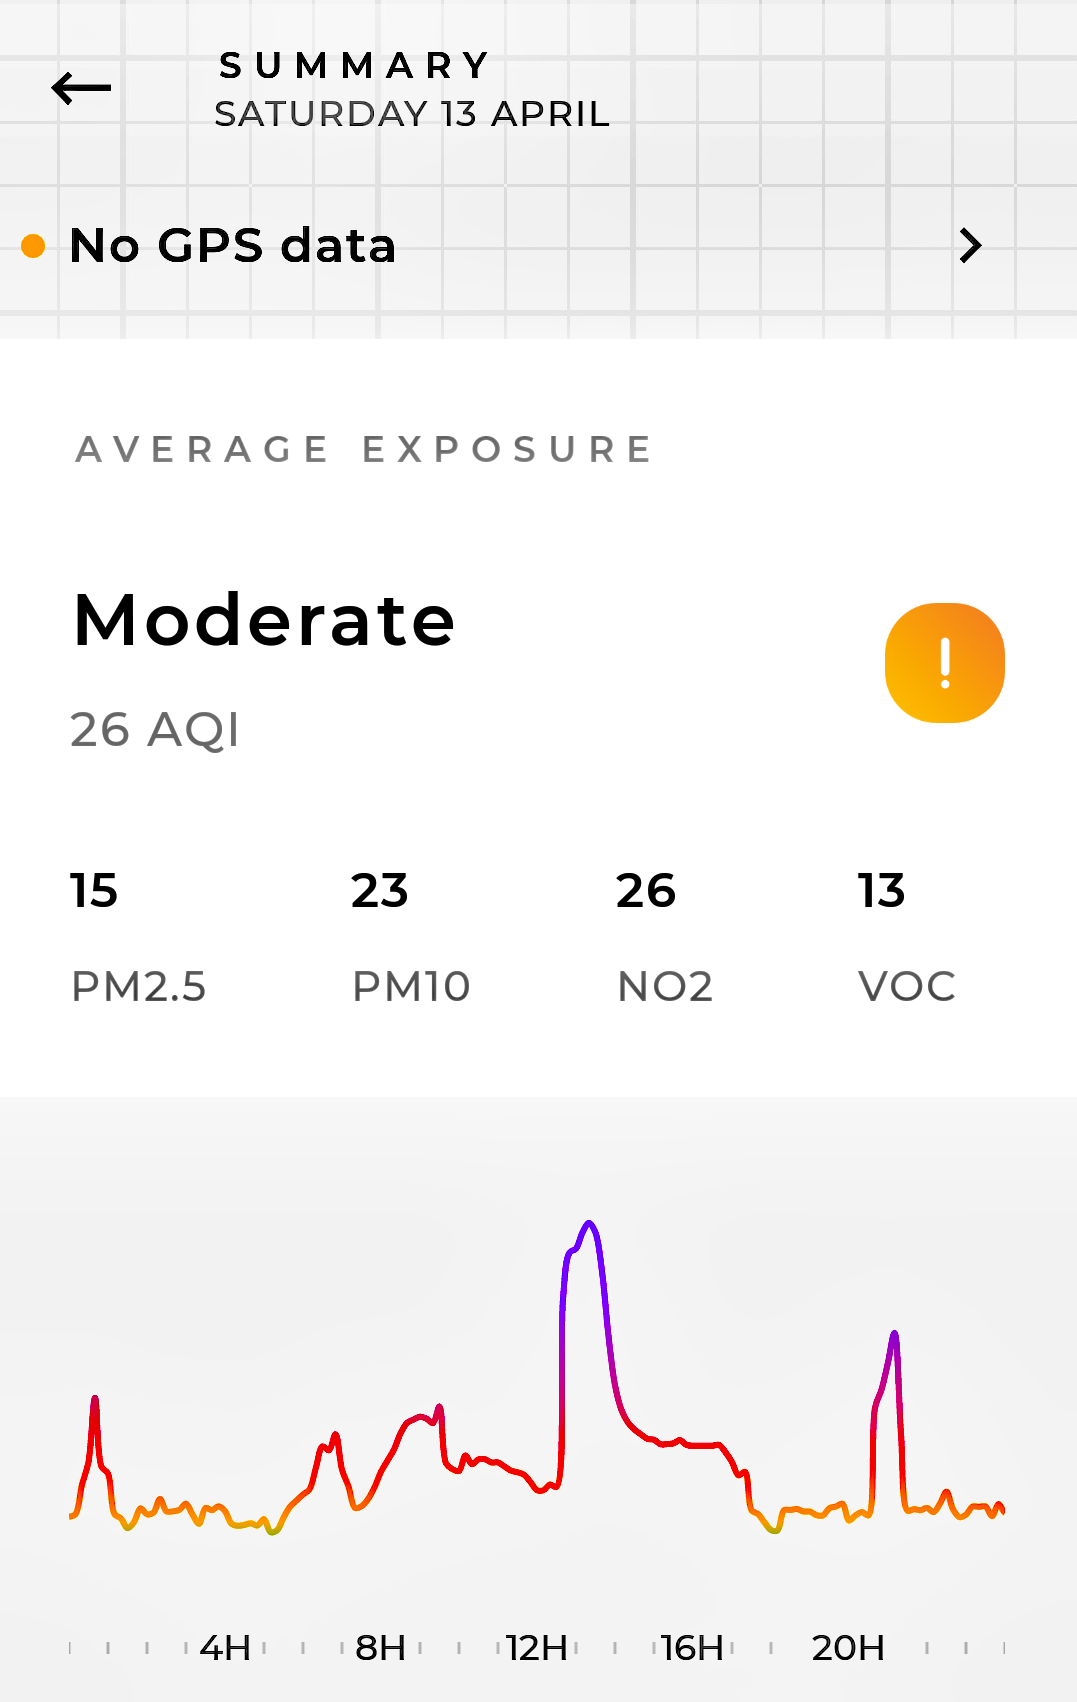
| 13 April | 15 | 23 | 26 | 13 | MODERATE | Graph. Wind ENE - E - ENE (15kph); Rain 1.40mm. | ||
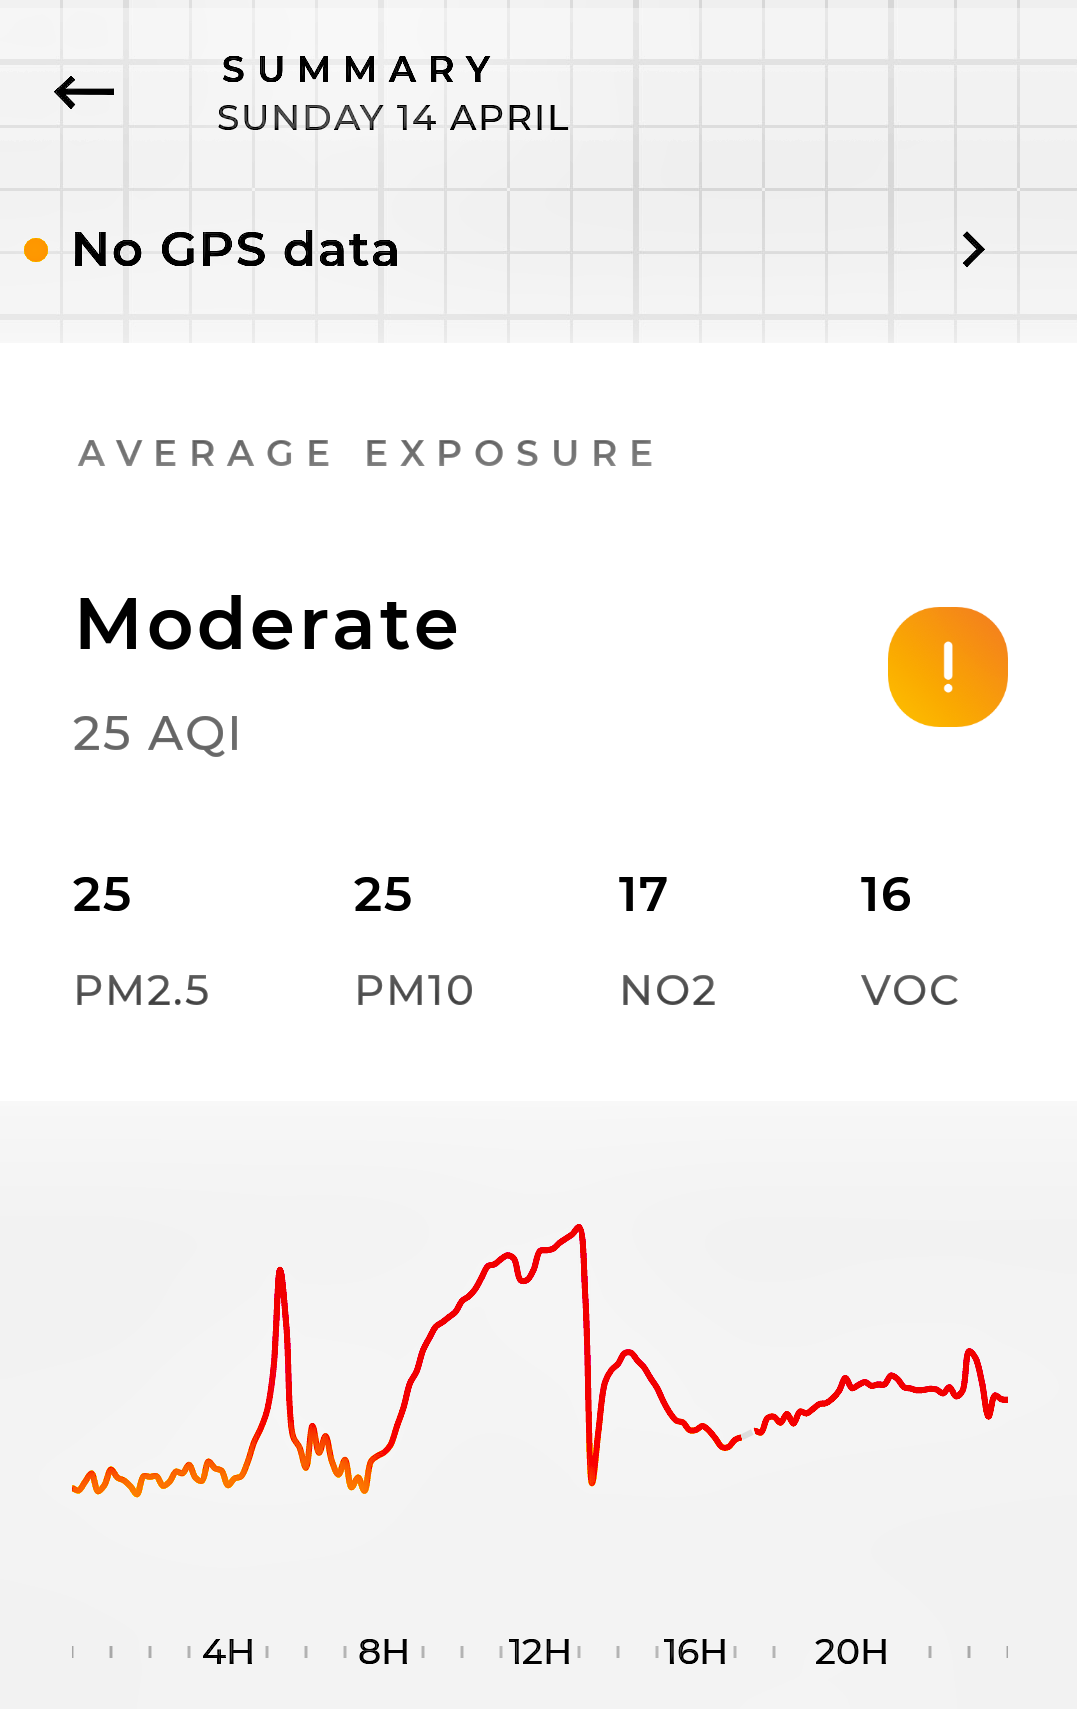
| 14 April | 25 | 25 | 17 | 16 | MODERATE | Graph. Wind NE - E (25kph); Rain 0.6mm | ||
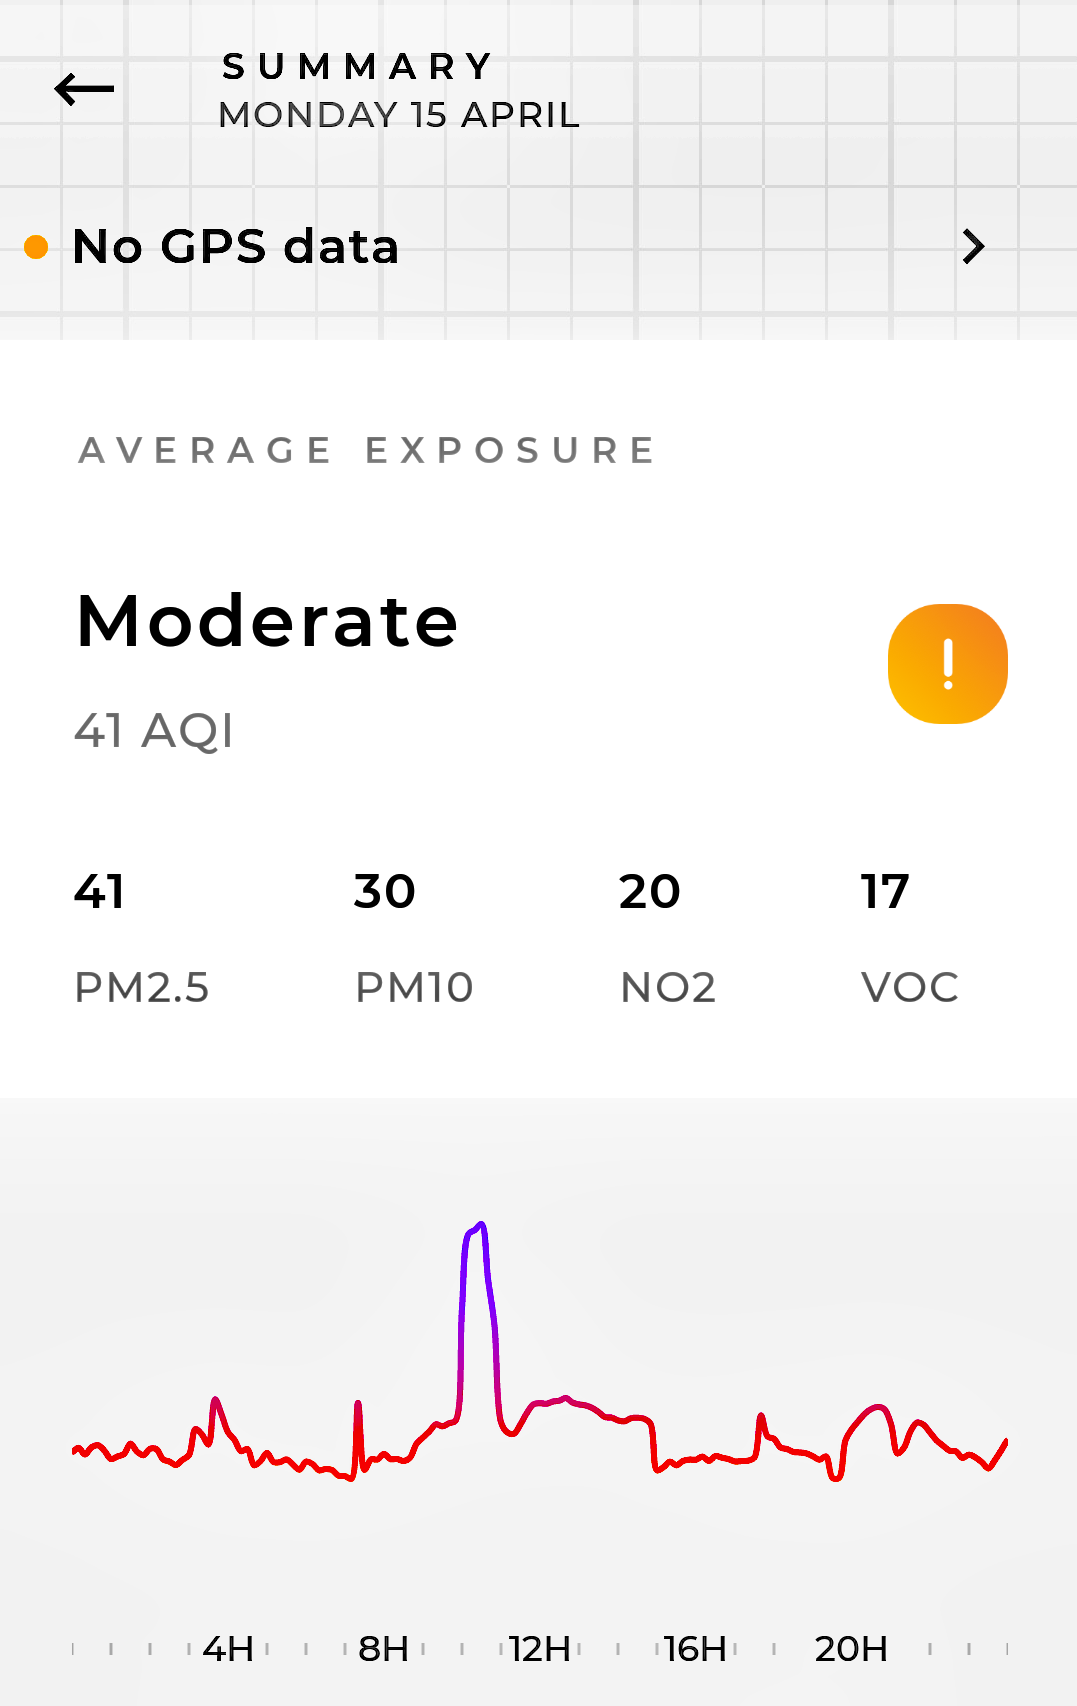
| 15 April | 41 | 30 | 20 | 17 | MODERATE | Graph. Wind ESE - E (20kph); Dry. | ||
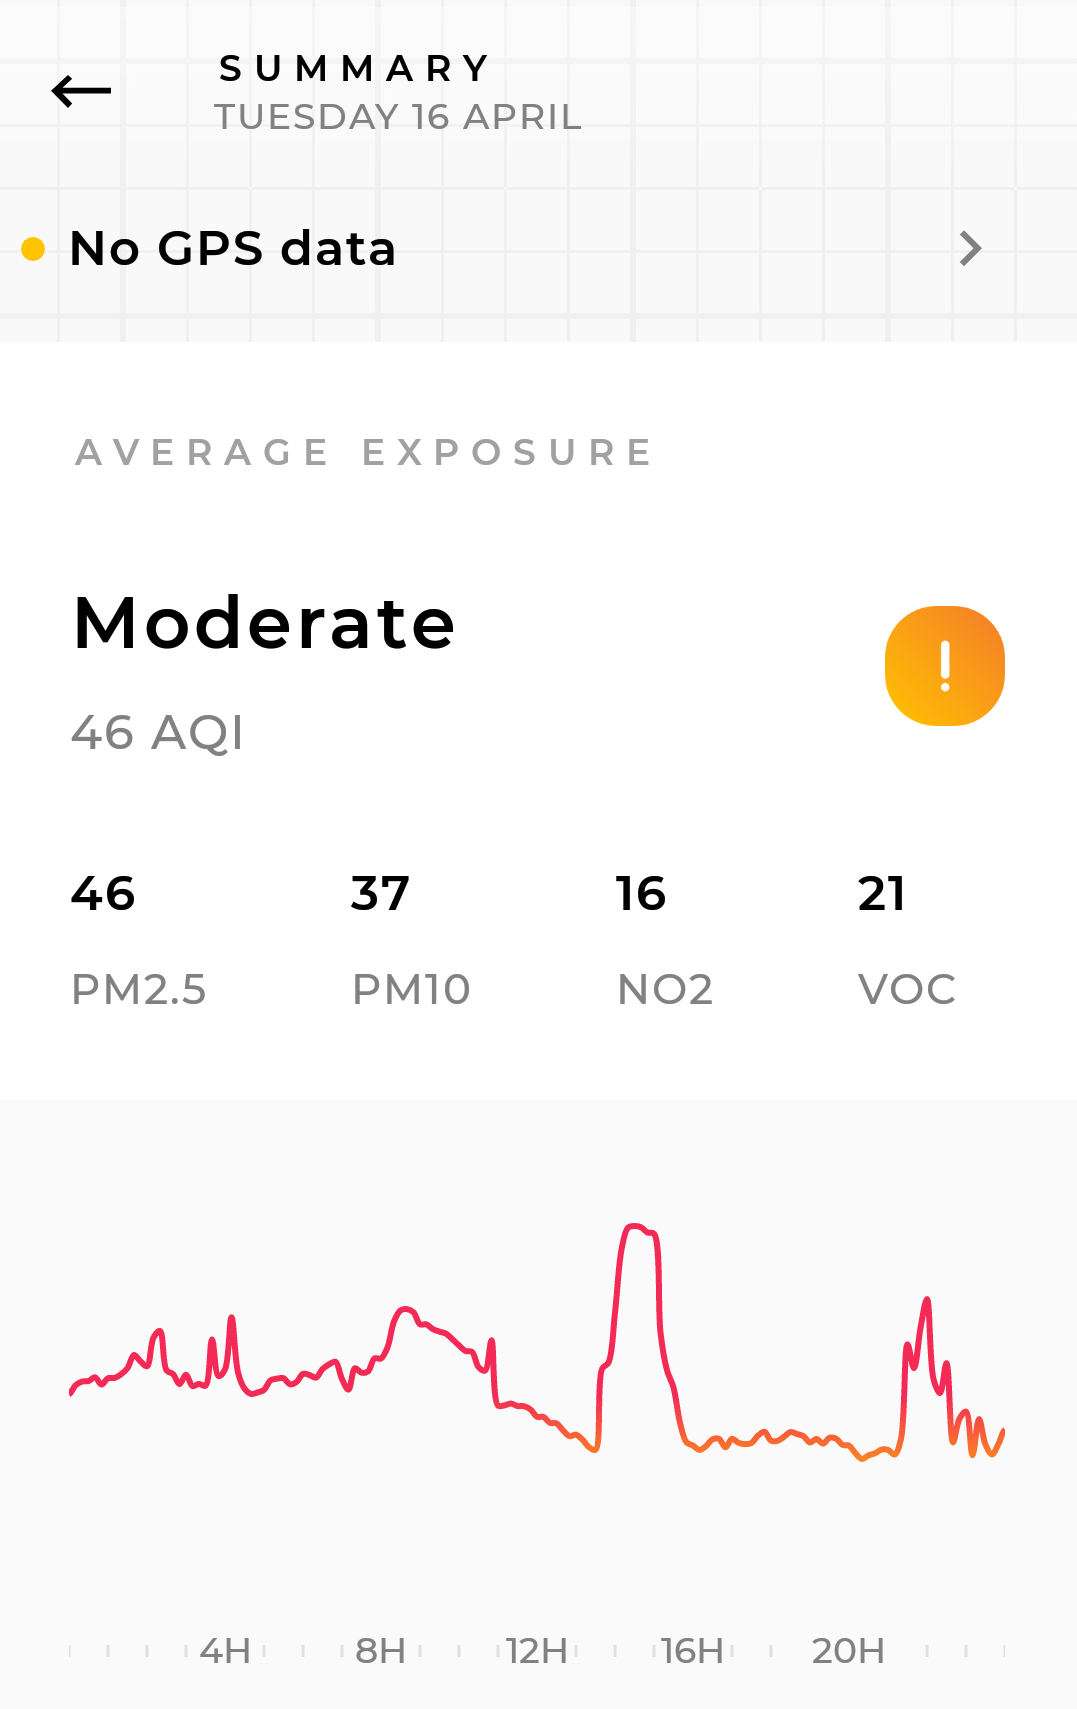
| 16 April | 46 | 37 | 16 | 21 | MODERATE | Graph. Wind ESE - E - NNE (10kph); Dry. | ||
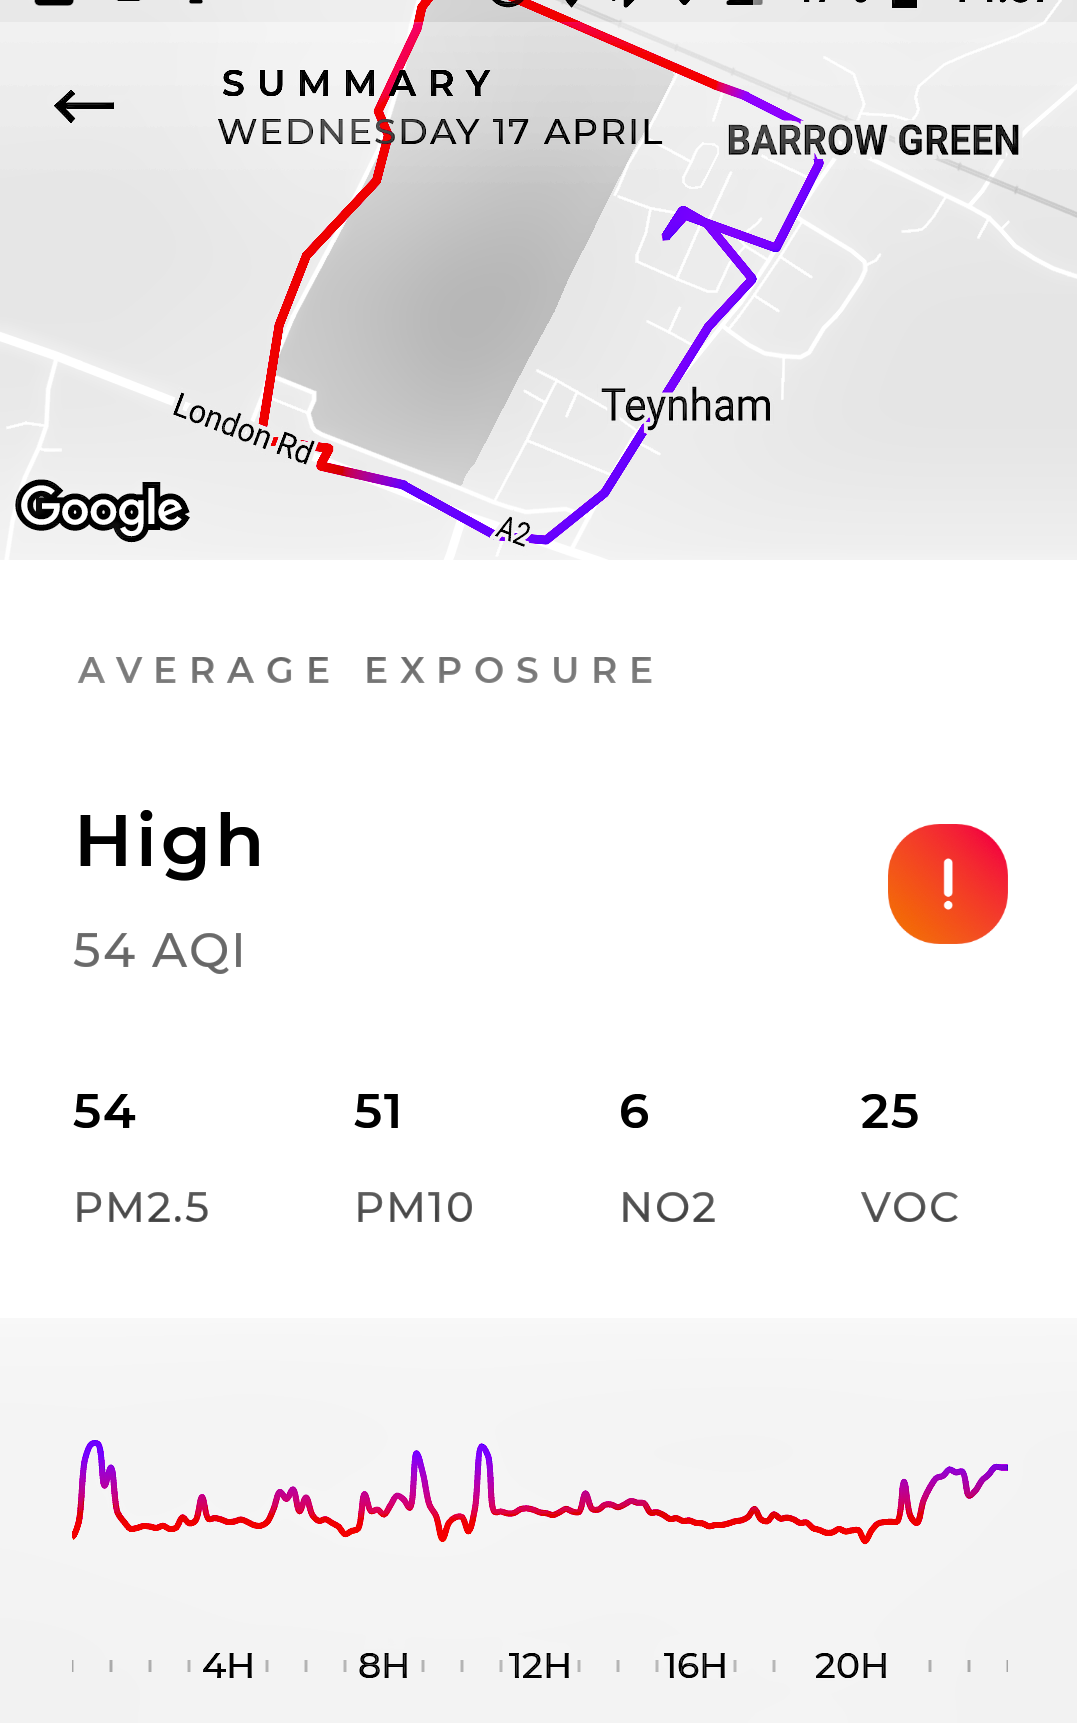
| 17 April | 54 | 51 | 6 | 25 | HIGH | Exceedance | Graph & Map. Wind NW - W - SE - E (8kph); Rain 0.1mm | |
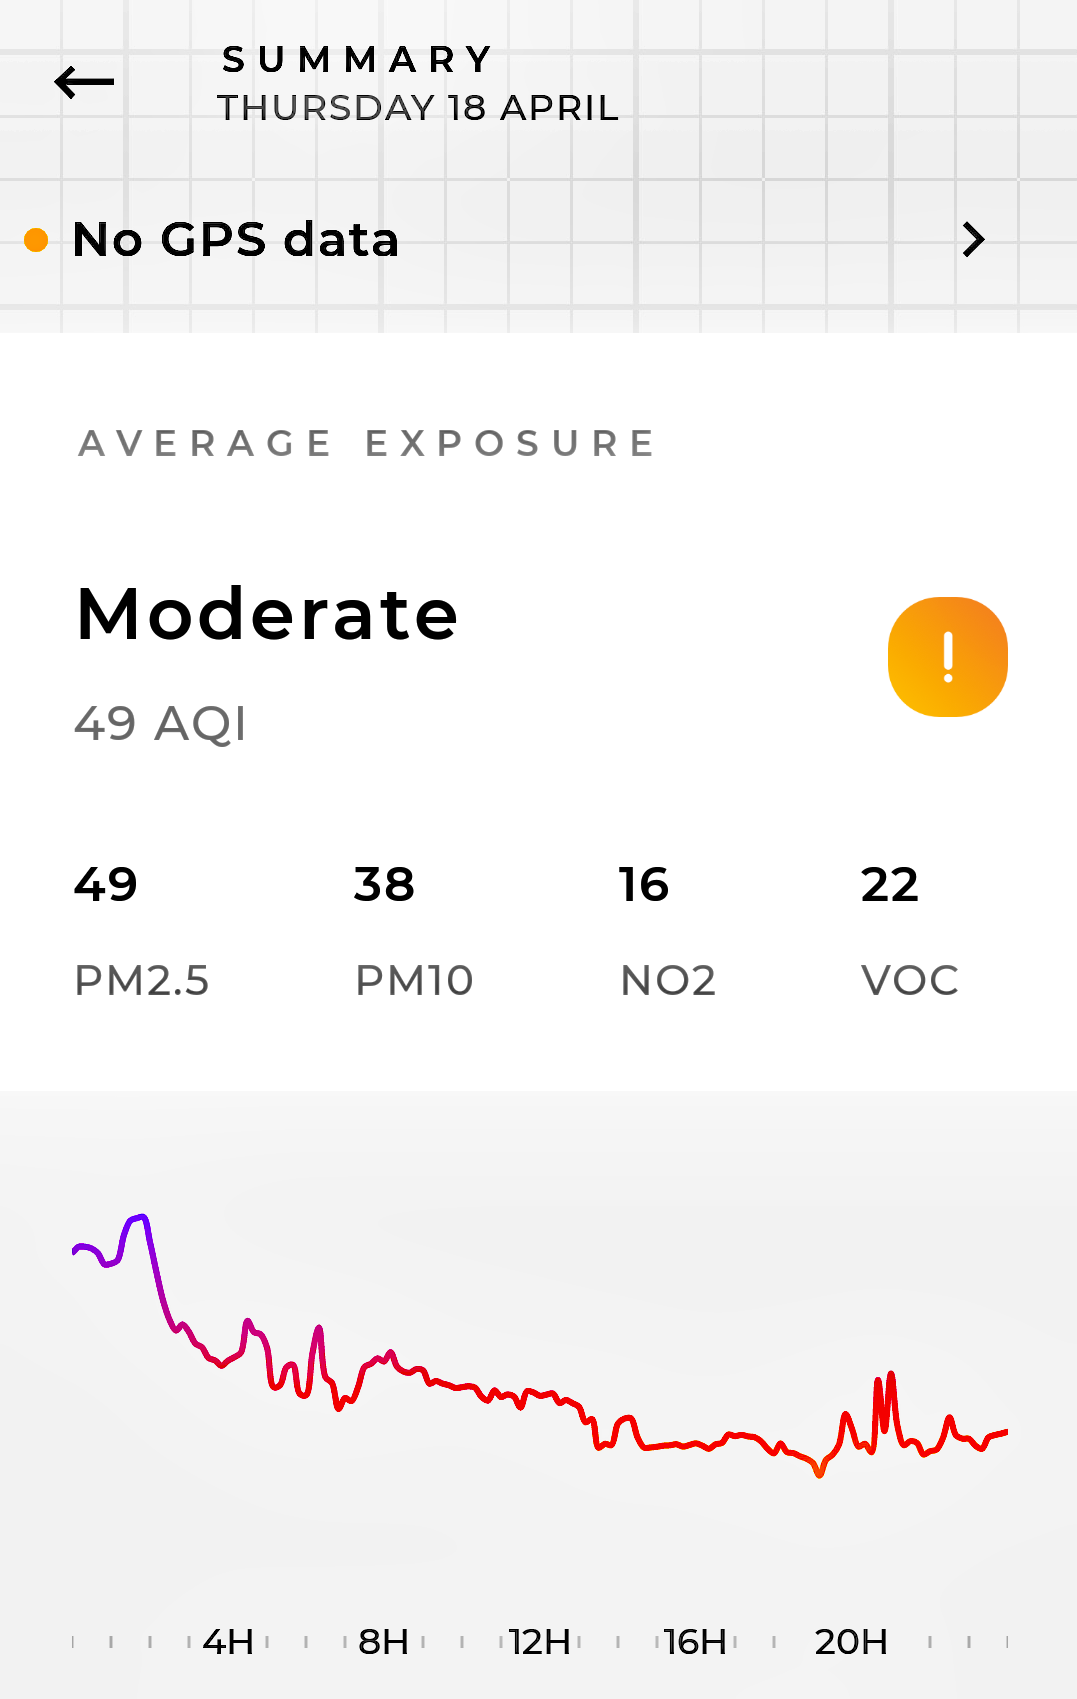
| 18 April | 49 | 38 | 16 | 22 | MODERATE | Graph. Wind ENE (16kph); Dry. | ||
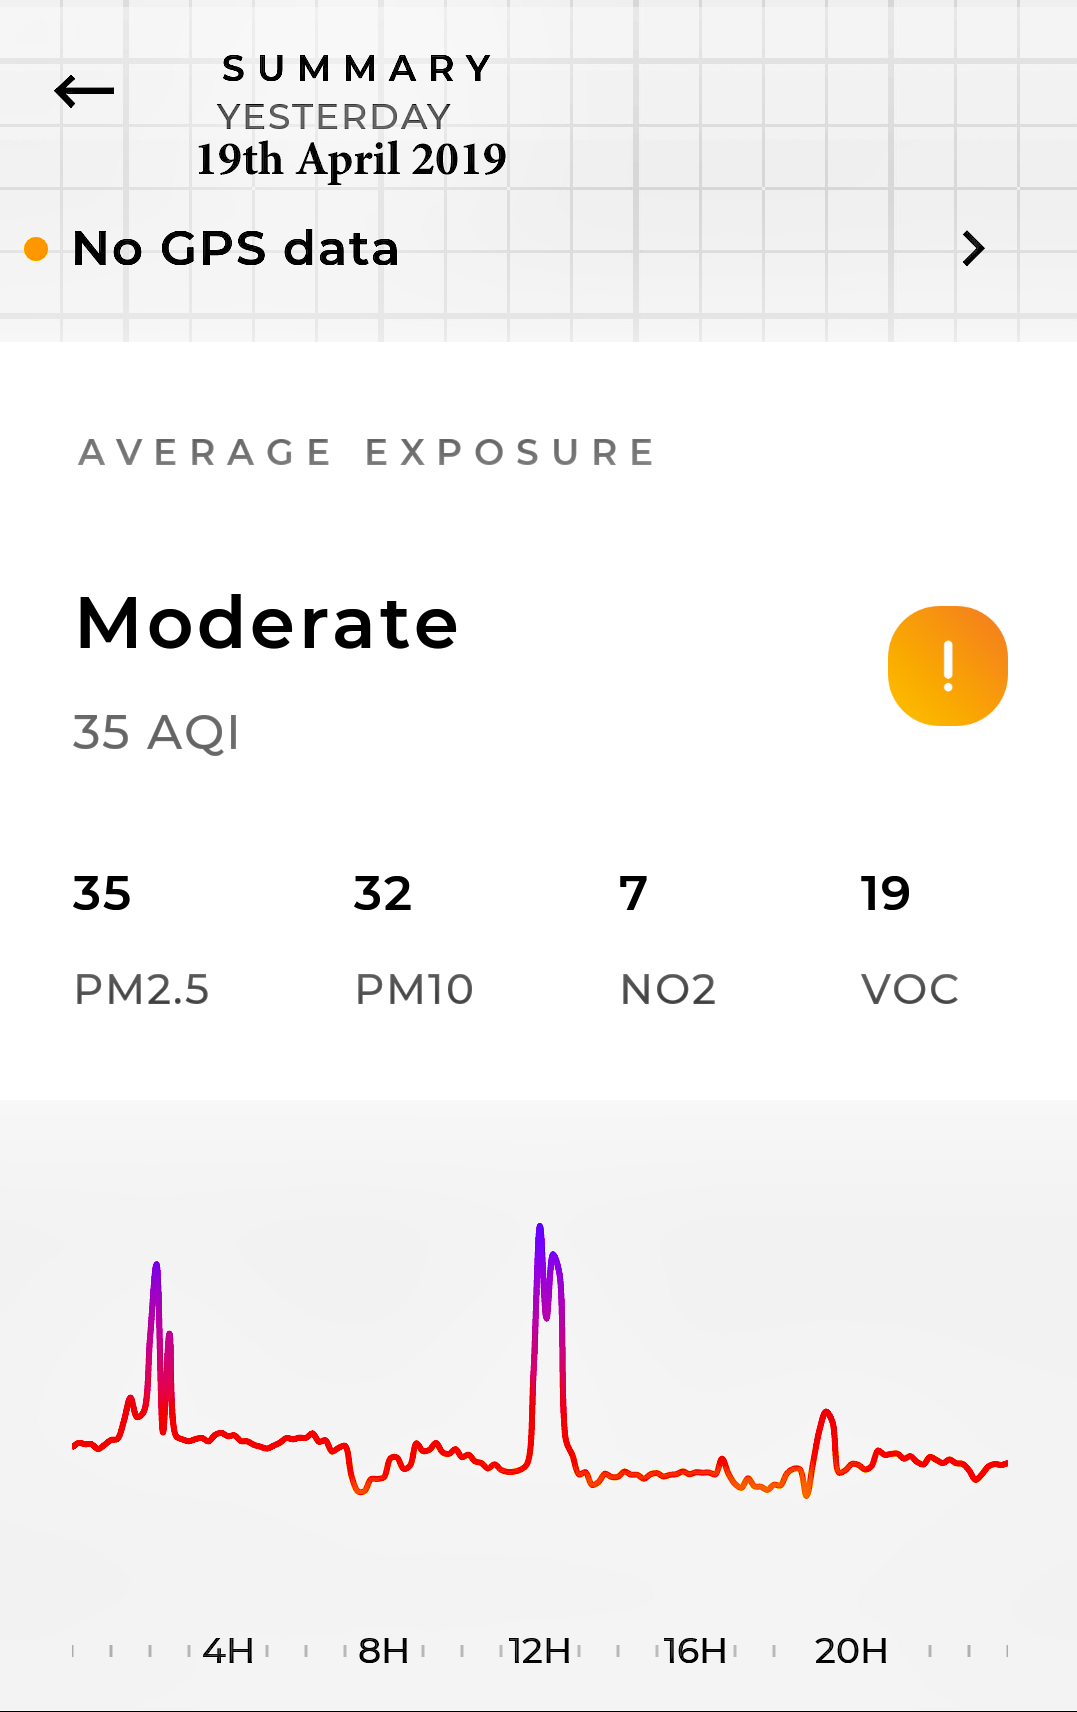
| 19 April | 35 | 32 | 7 | 19 | MODERATE | Graph. Wind ENE - N - NNE (15kph); Dry | ||
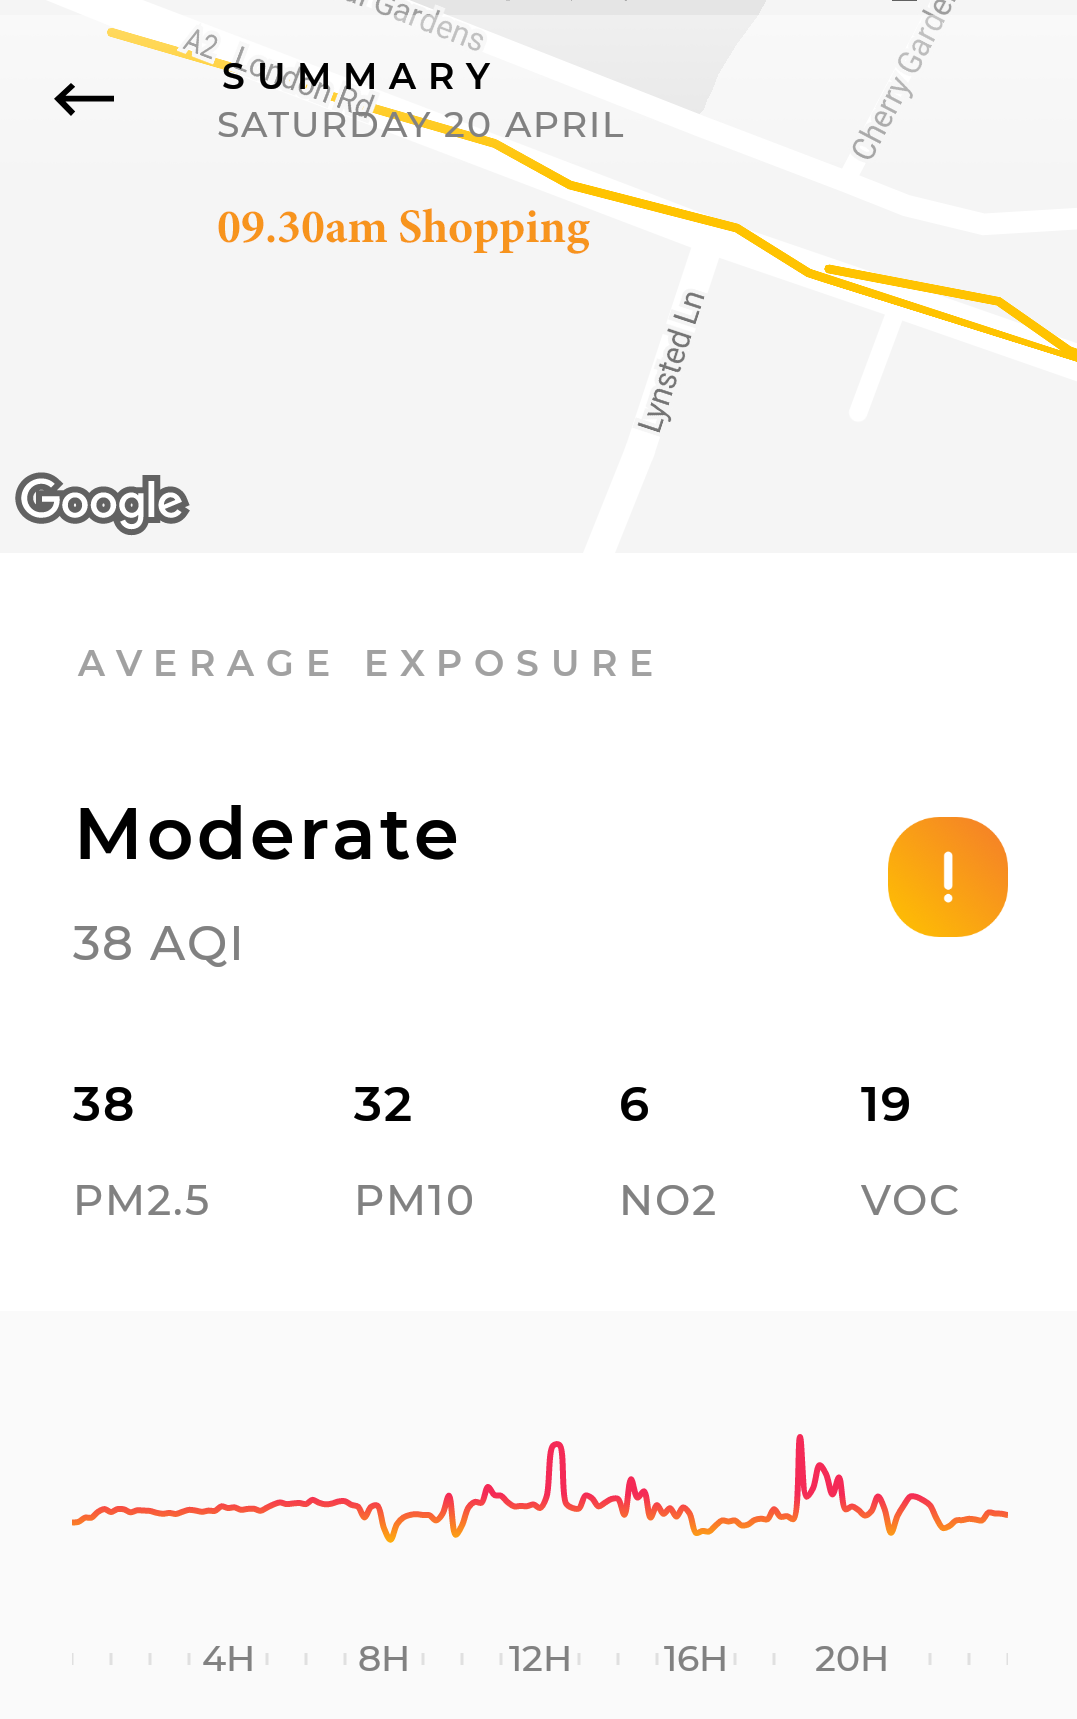
| 20 April | 38 | 32 | 6 | 19 | MODERATE | Graph & Map. Wind NNE - NE (14kph); Dry | ||
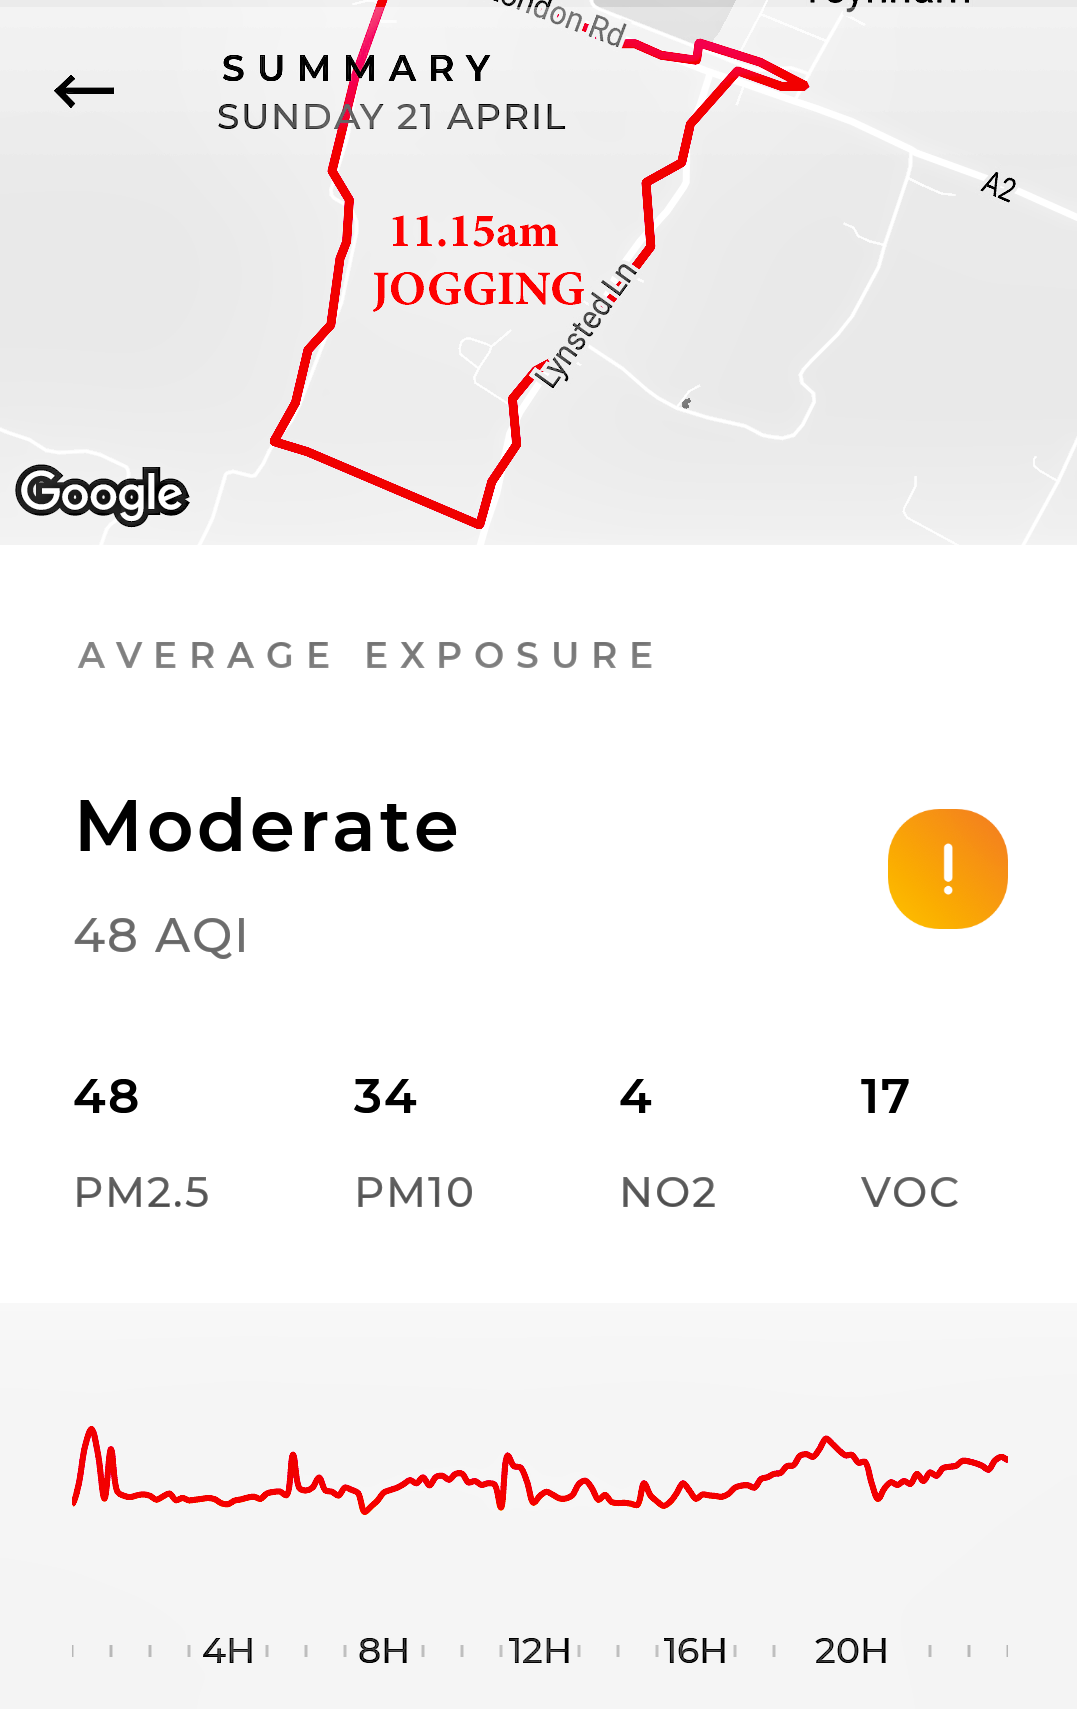
| 21 April | 48 | 34 | 4 | 17 | MODERATE | Graph & Map. Wind NE - ENE (12kph); Dry | ||
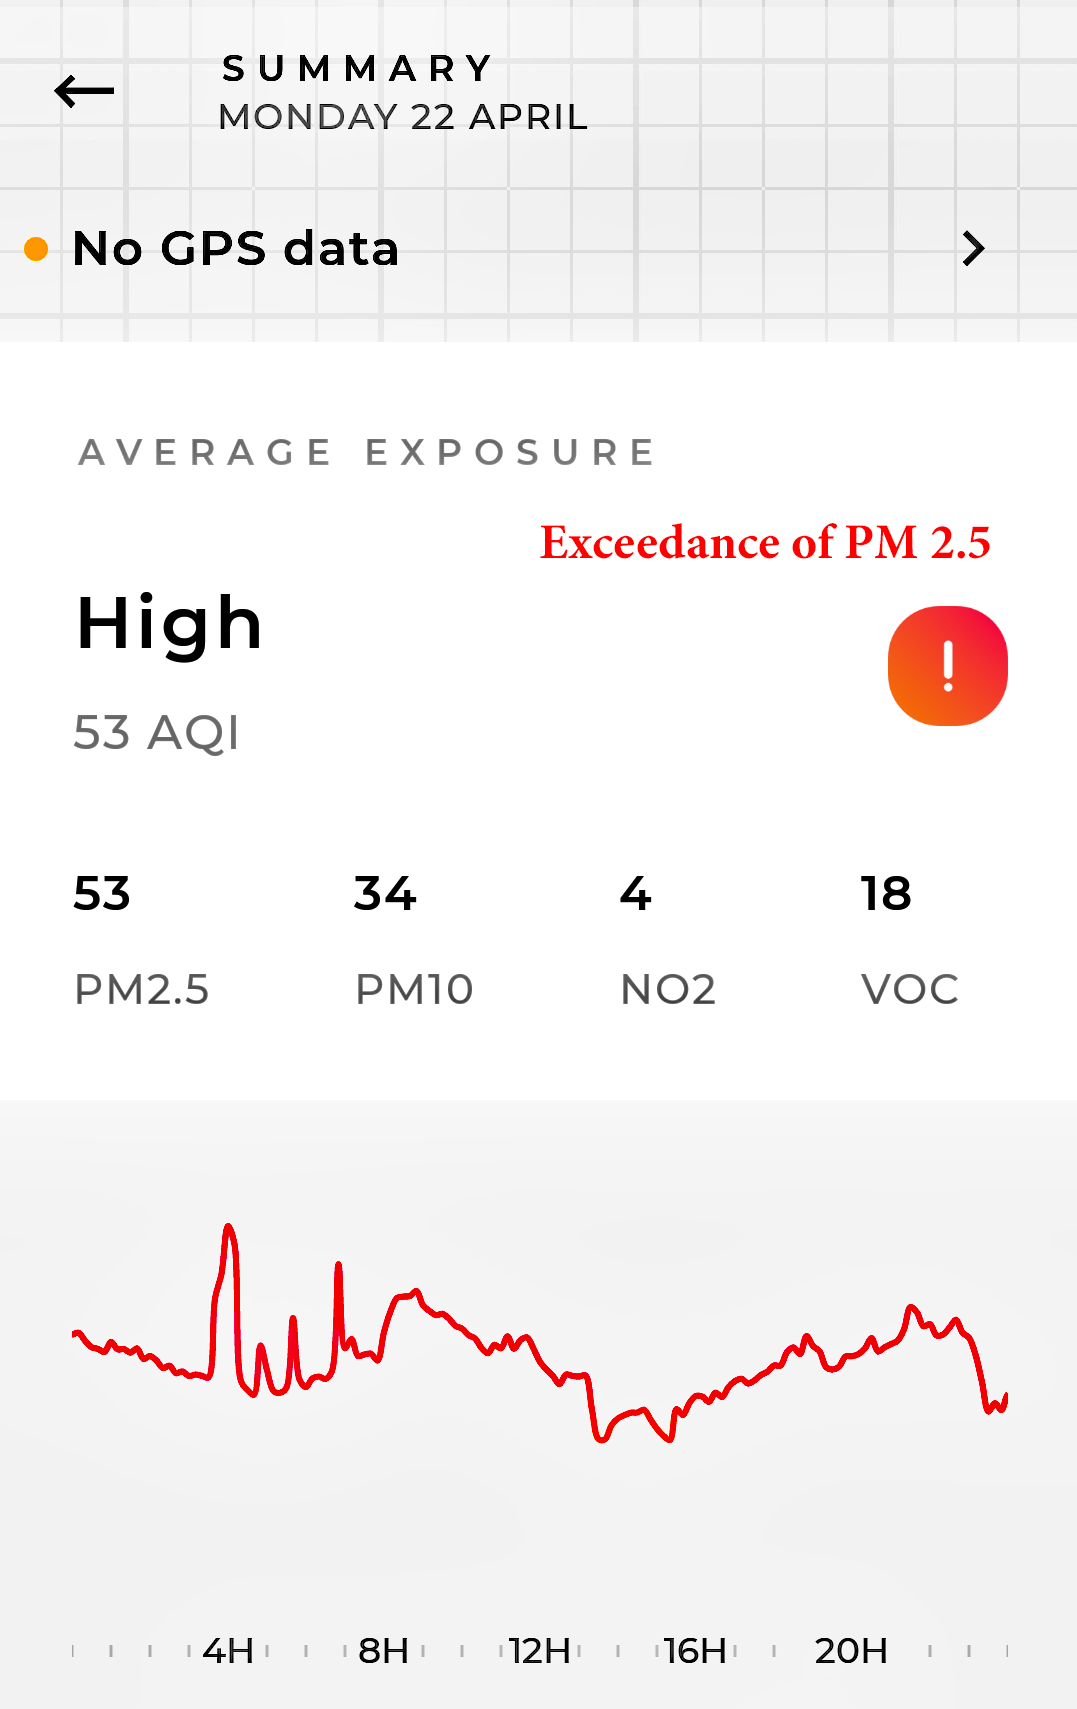
| 22 April | 53 | 34 | 4 | 18 | HIGH | Exceedance | Graph.Wind ENE - ESE - SE - ENE (10kph); Dry | |
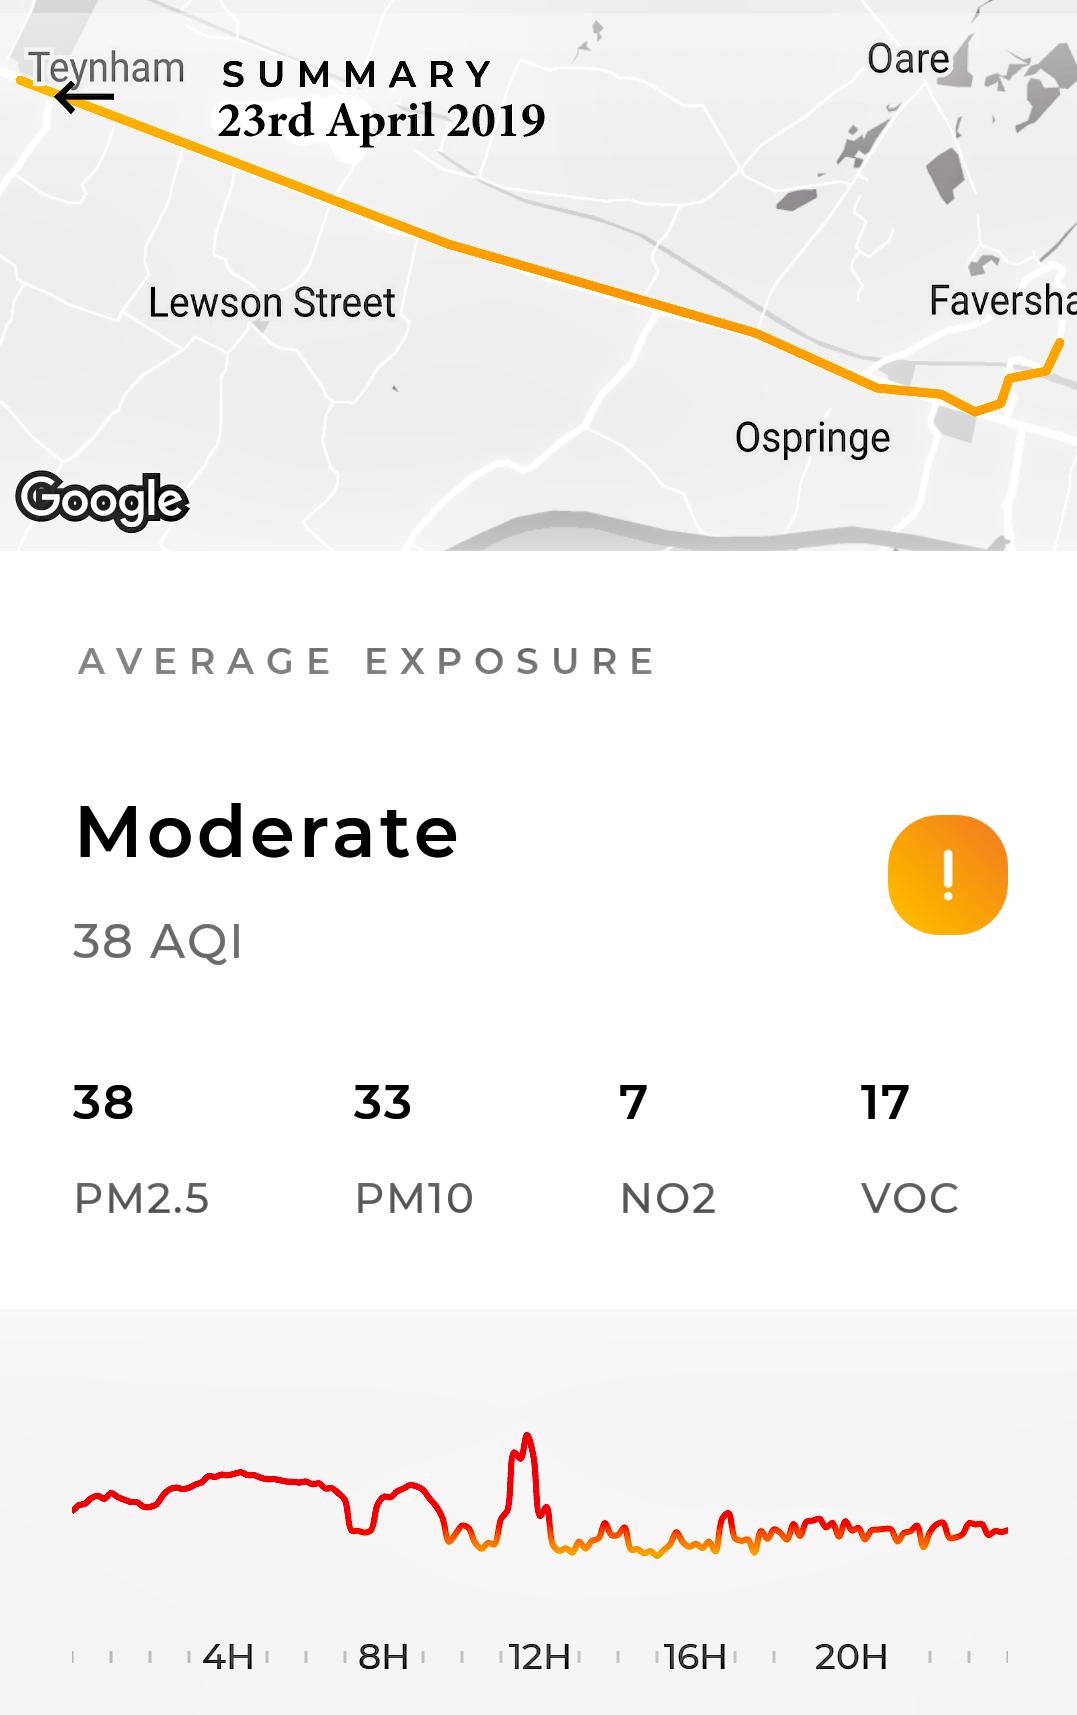
| 23 April | 38 | 33 | 7 | 17 | MODERATE | Graph & Map. Wind E - ENE - NE (13kph). Dry | ||
| 24 April - 2 May | - | - | - | - | NO DATA | 2nd May was VERY close to being GREEN! Possibly due to wind direction and strength. 26th April - 2nd May: Background pollution HIGH at times. Ozone in particular! | ||
| MAY 2019 | ||||||||
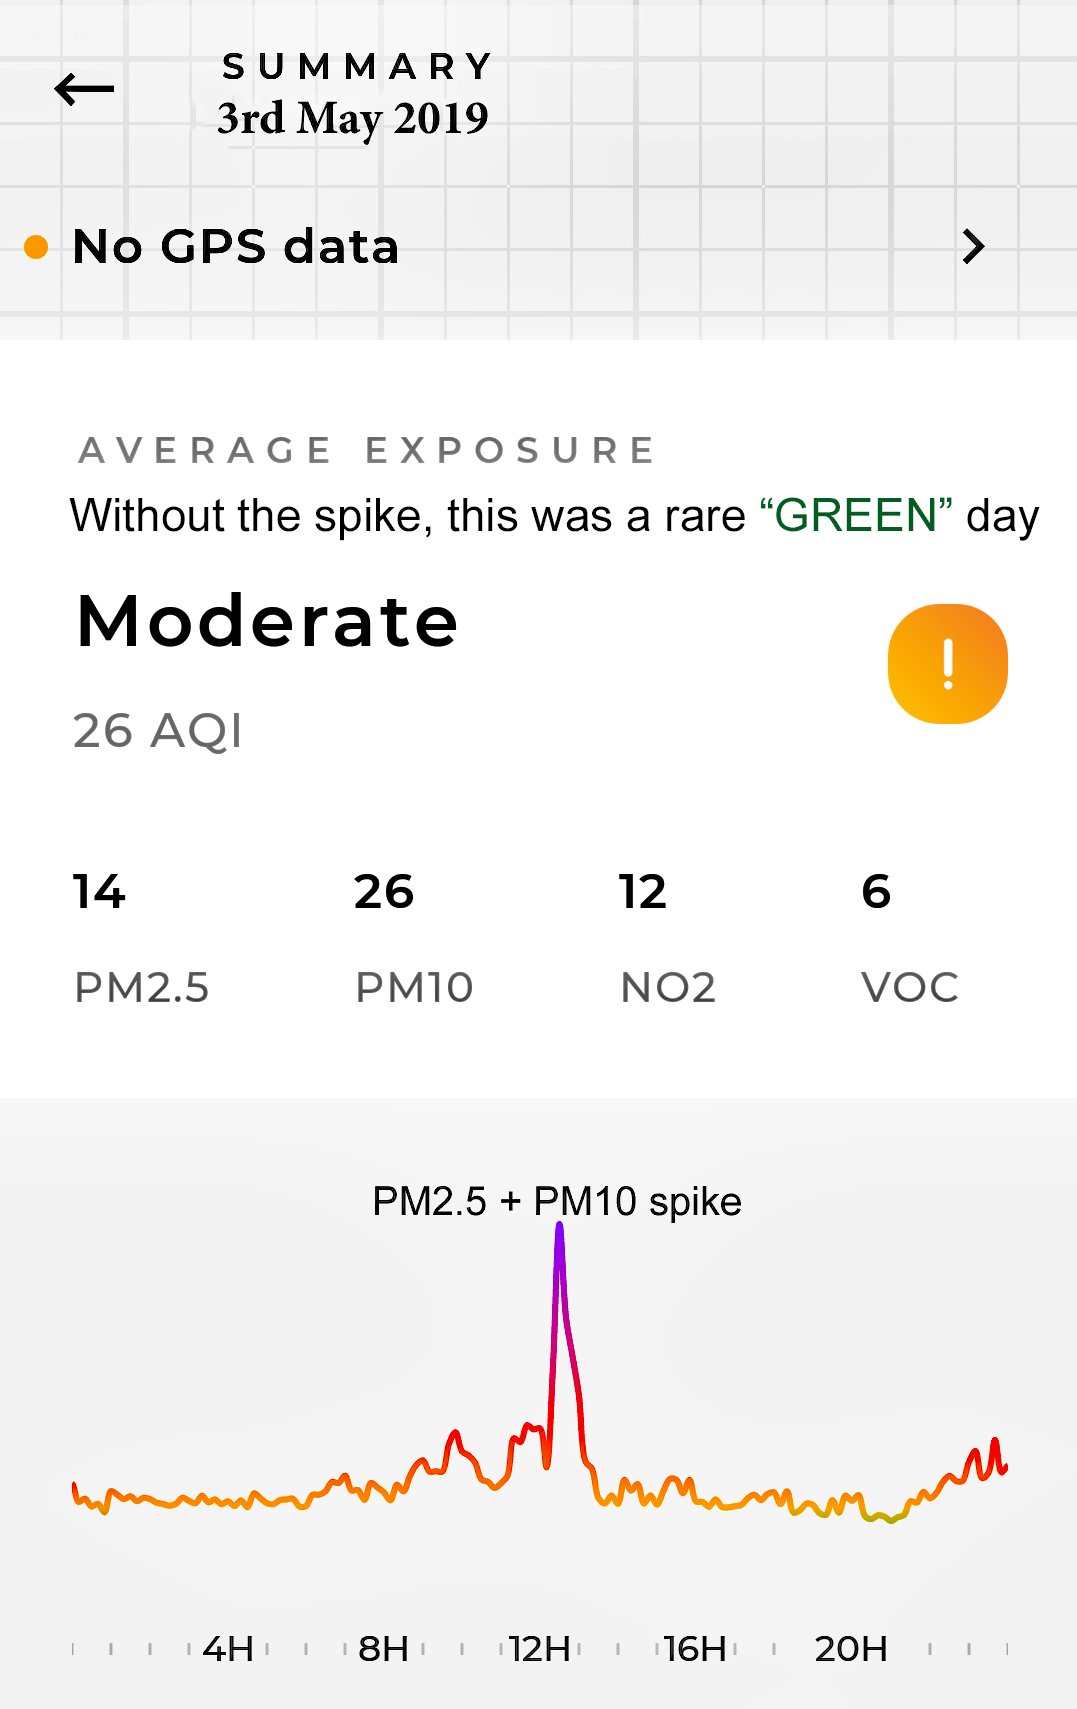
| 3 May | 14 | 26 | 12 | 6 | MODERATE | Graph. Wind NNE - SW - NNE (12 kph). 10.7 mm. Spike of PM2.5/10 at 12.30 = sudden traffic jam. |
||
| 4 May | 12 | 31 | 7 | 5 | MODERATE | Graph. Wind NNE - N (28 kph). 6.4mm - all day | ||
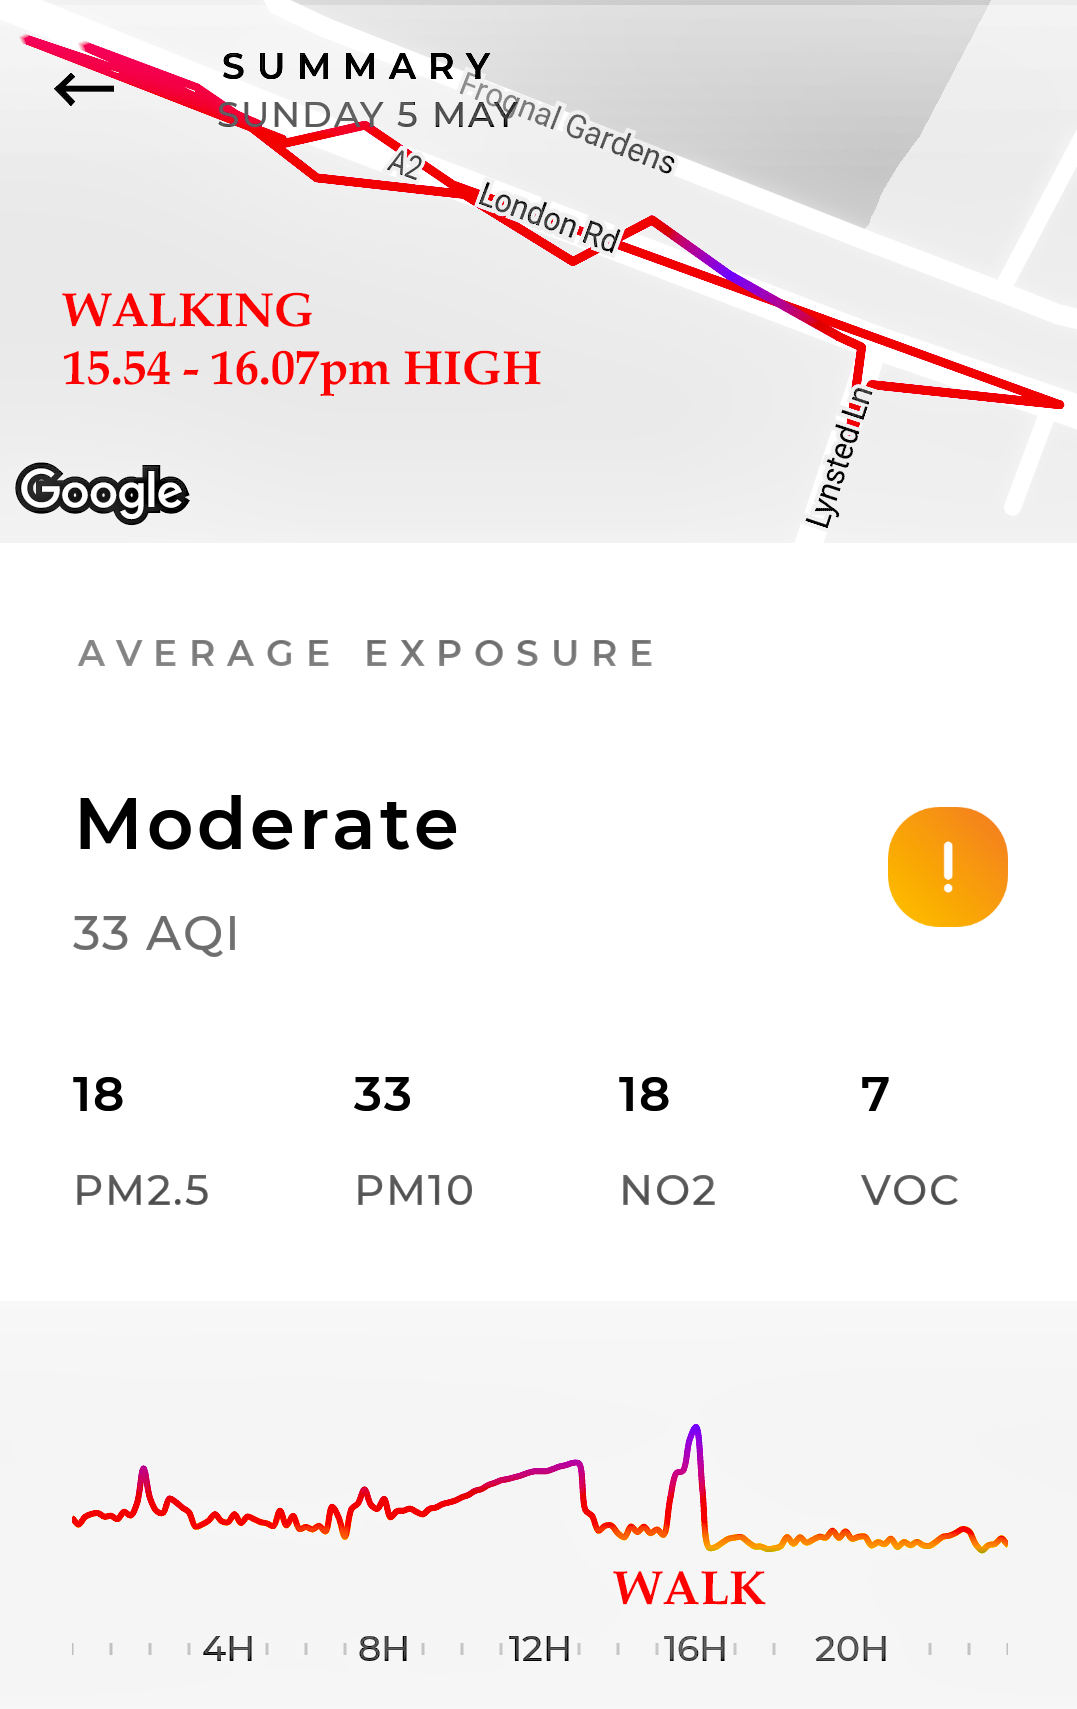
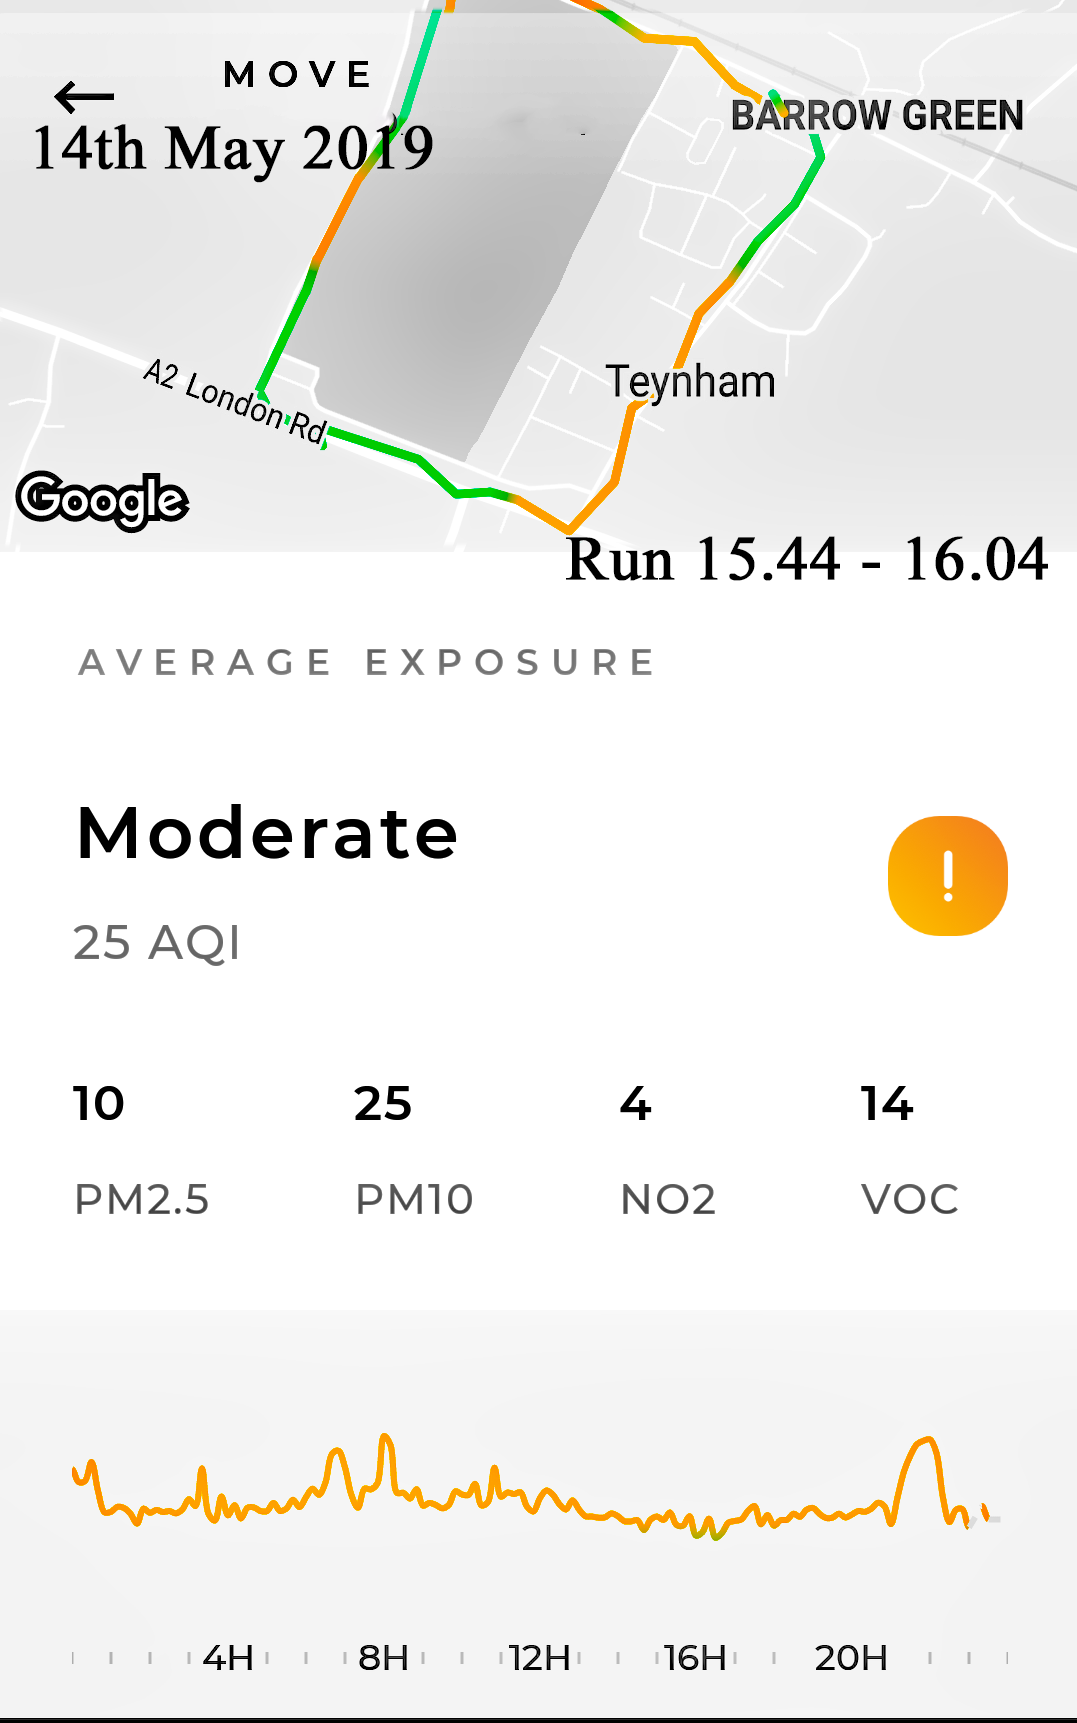
| 5 May | 18 | 33 | 18 | 7 | MODERATE | Graph & Map (15.54-16.07 HIGH). Wind NNW - NNE (16kph). Rain 0.8mm | ||
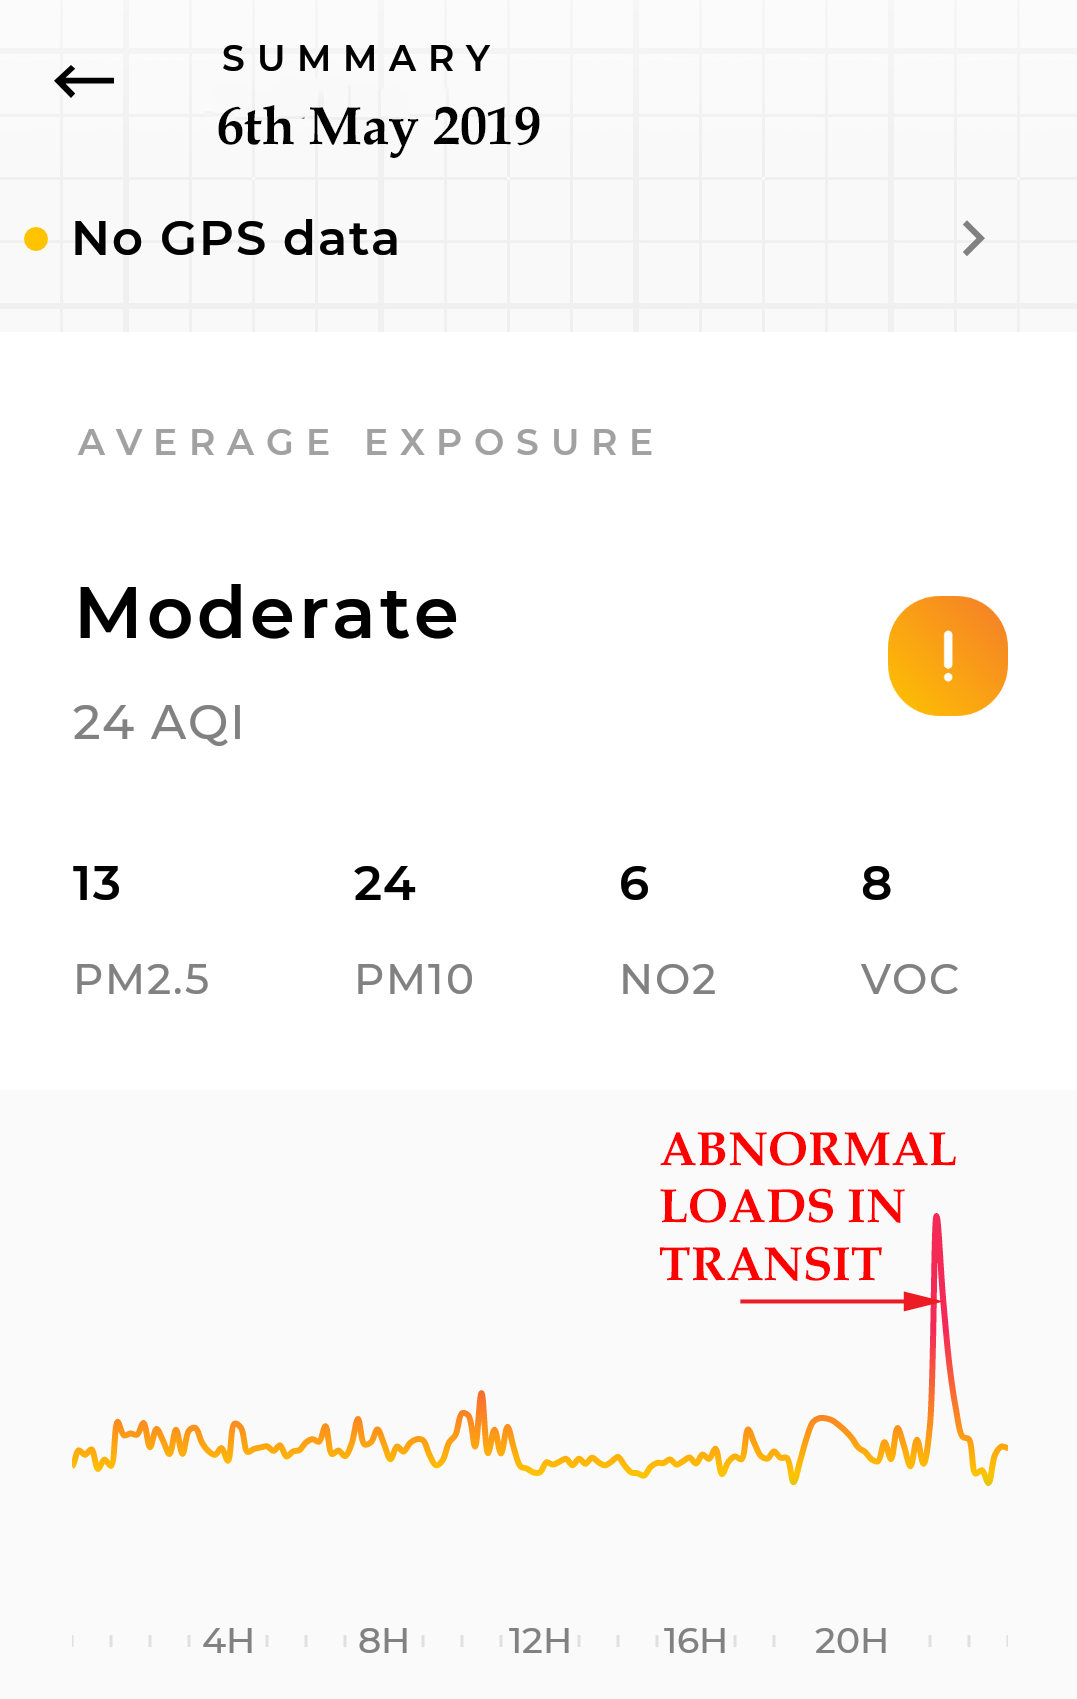
| 6 May | 13 | 24 | 6 | 8 | MODERATE | Graph. Wind WSW - WNW - NW - ENE - E (13 kph)Rain: 1.6mm | ||
| A second "Flow" Device has been added south of Lynsted Village! So, I shall add that data from now on:- | ||||||||
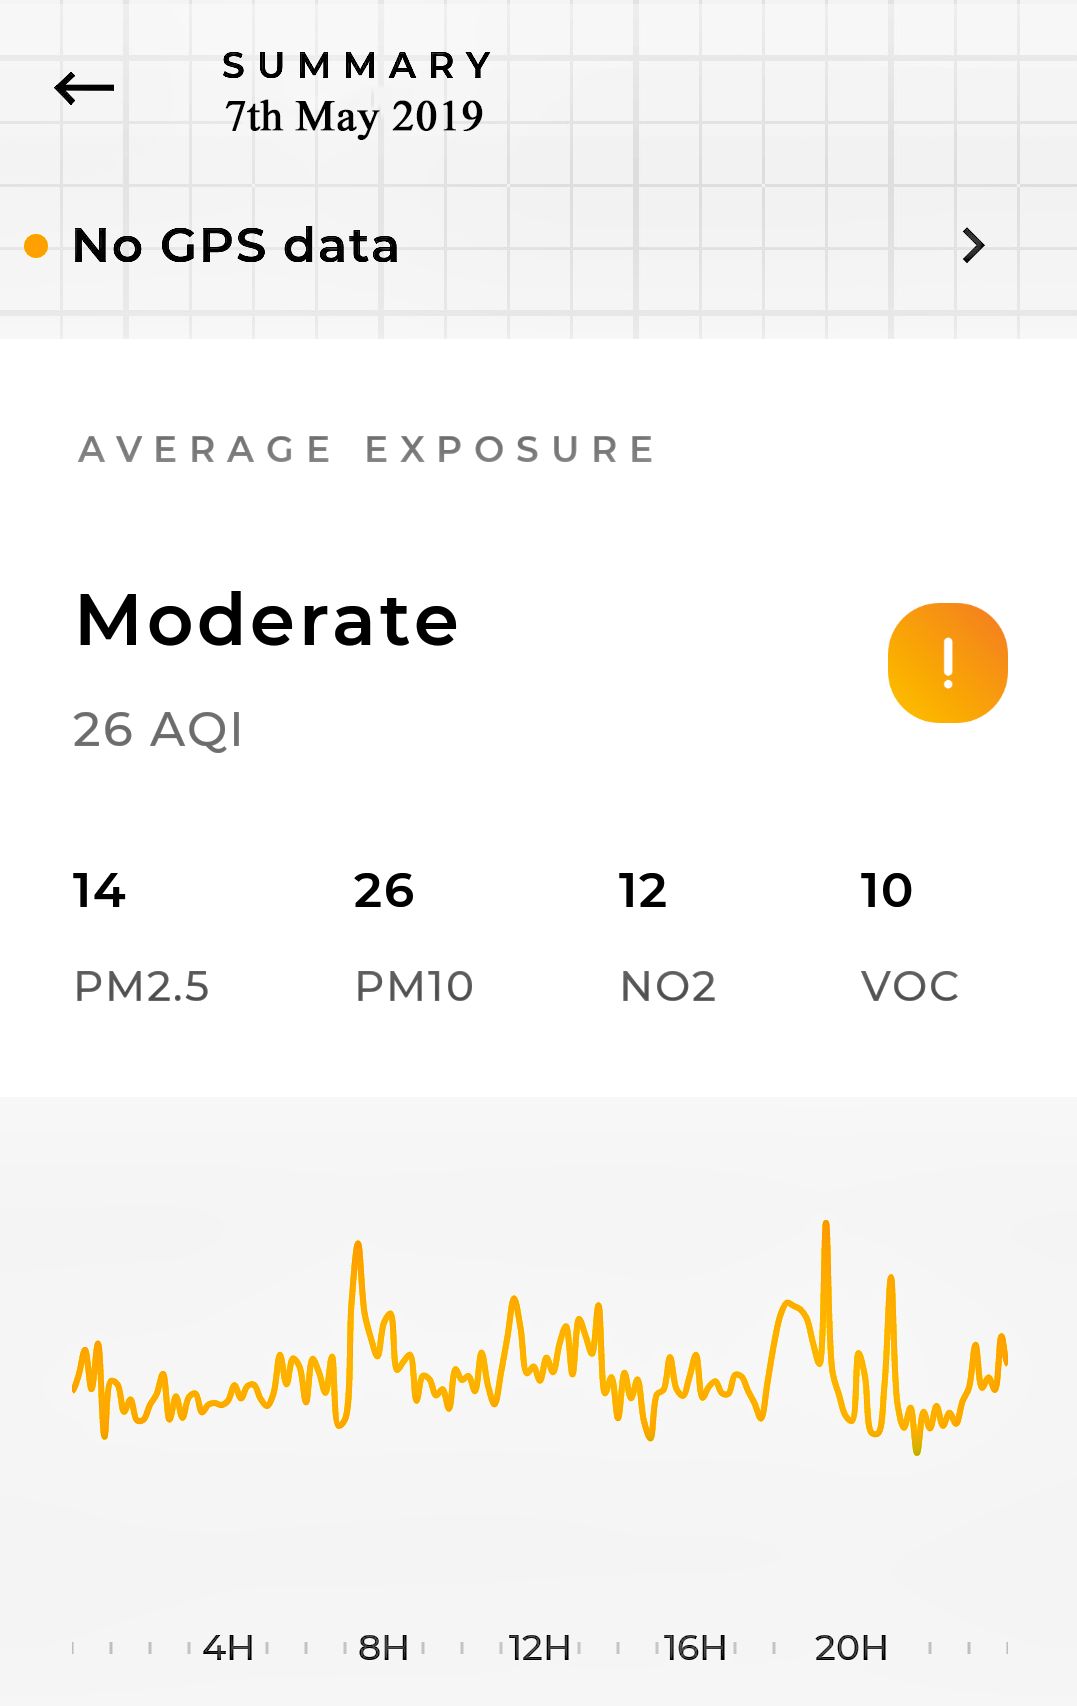
| 7 May | 14 | 26 | 12 | 10 | MODERATE | Graph. Wind WSW - SW - S - SSE (13 kph) Rain: 2.9mm | ||
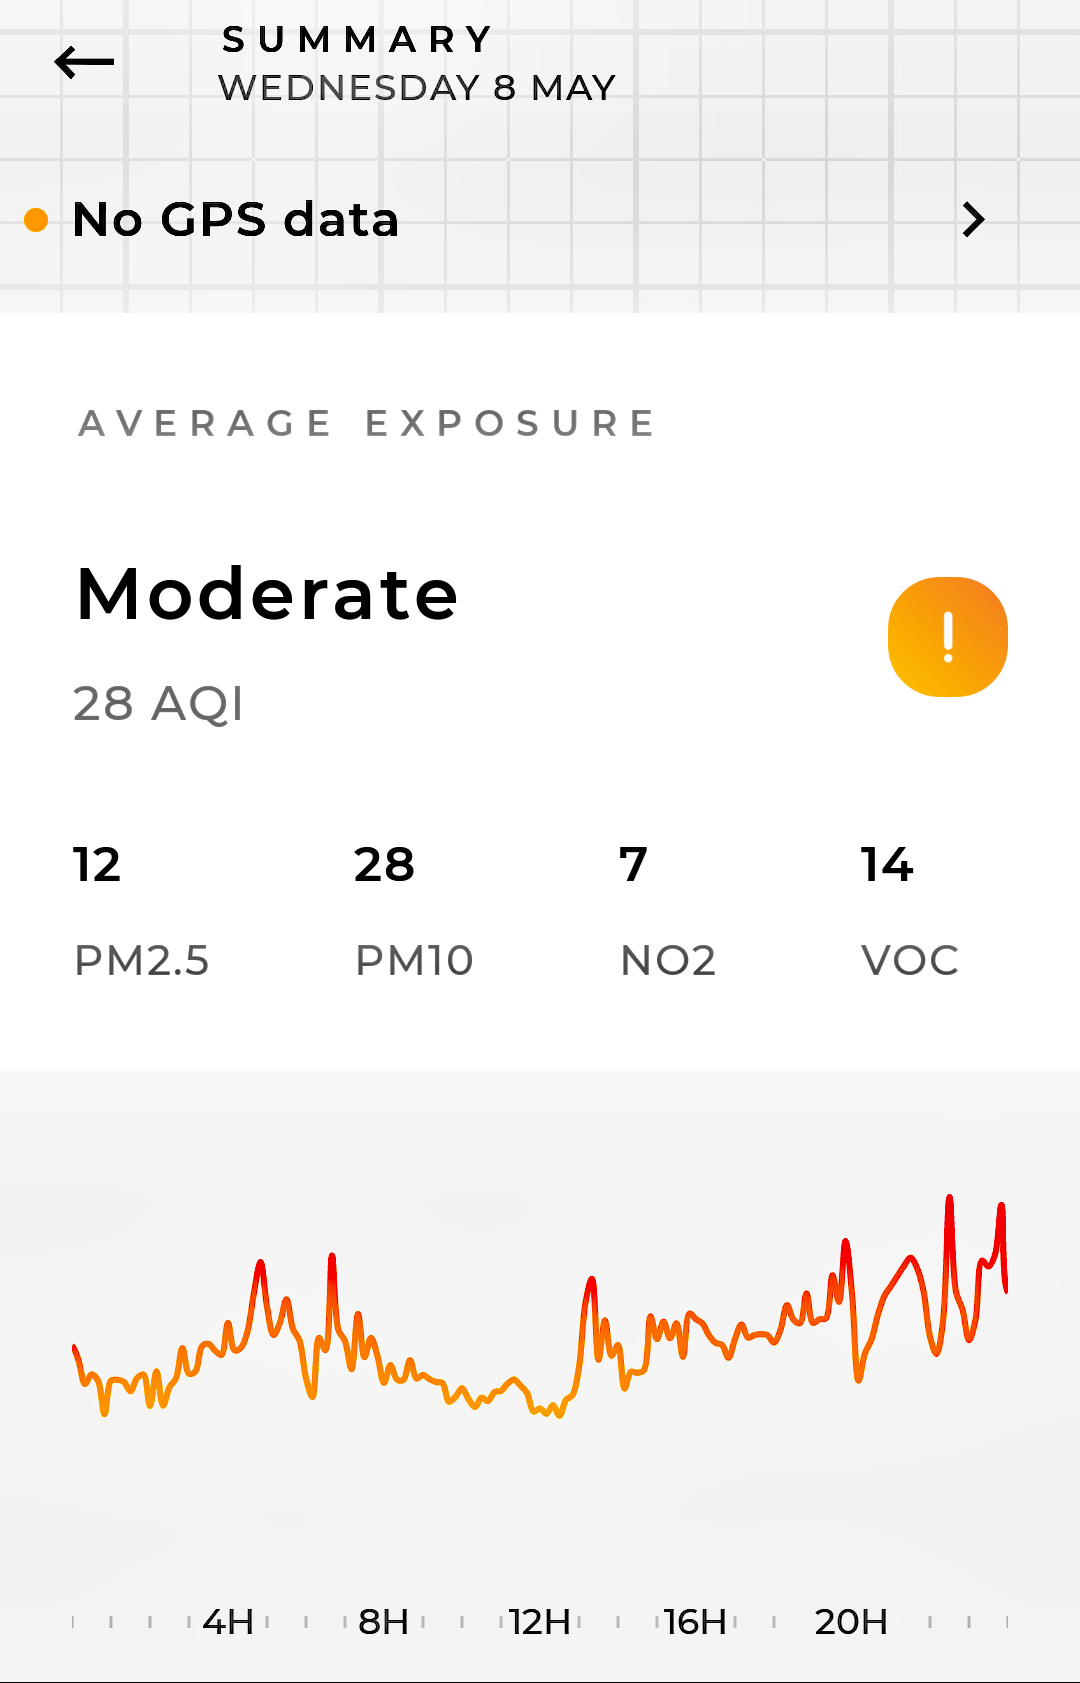
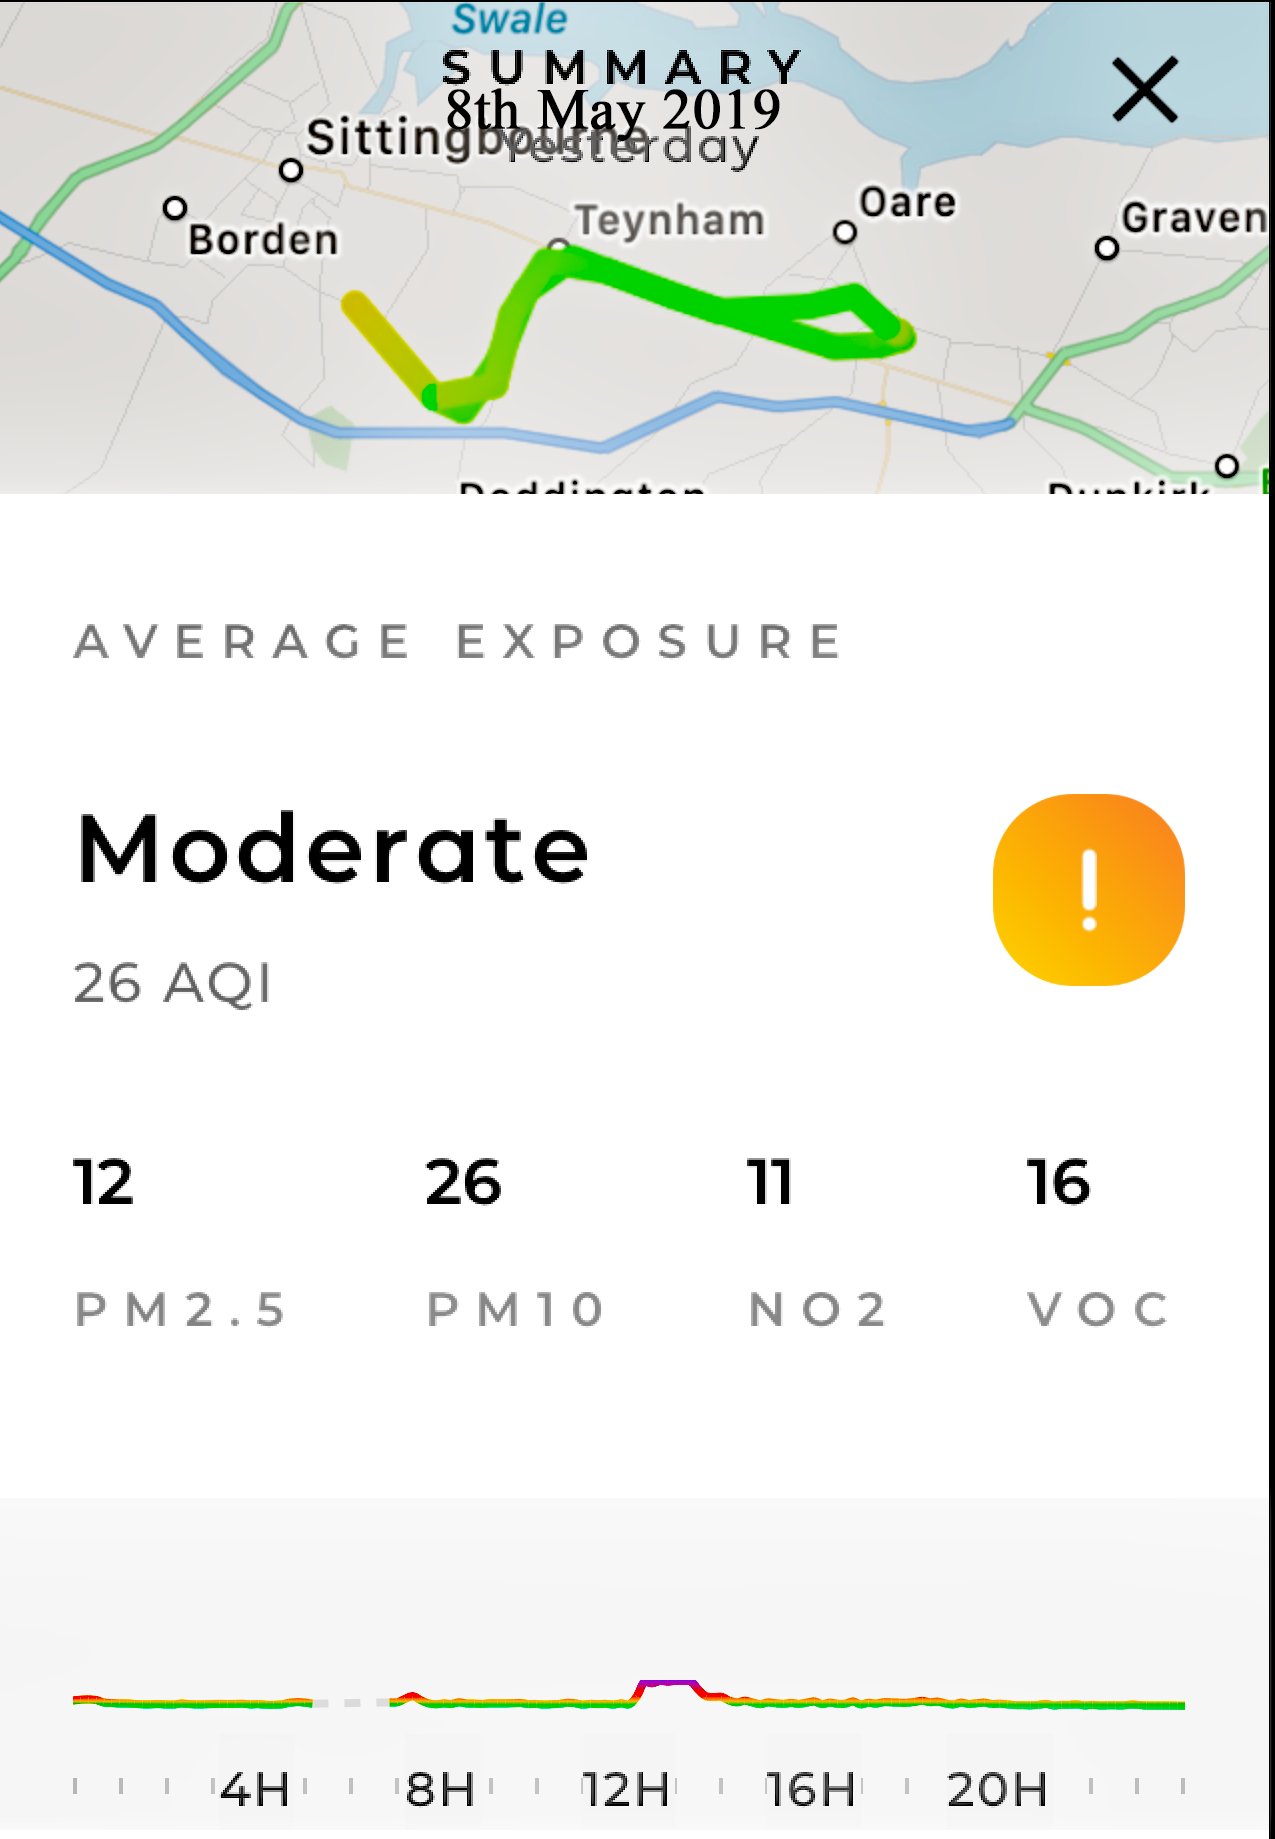
| 8 May Flow 1 A2 Flow 2 Kingsdown |
12 12 |
28 26 |
7 11 |
14 16 |
MODERATE MODERATE |
Graph. Wind SE - SSE - SSW - SW (ave: 26kph - peaking 34kph) Rain 21.6mm all day Flow 2: Graph and map |
||
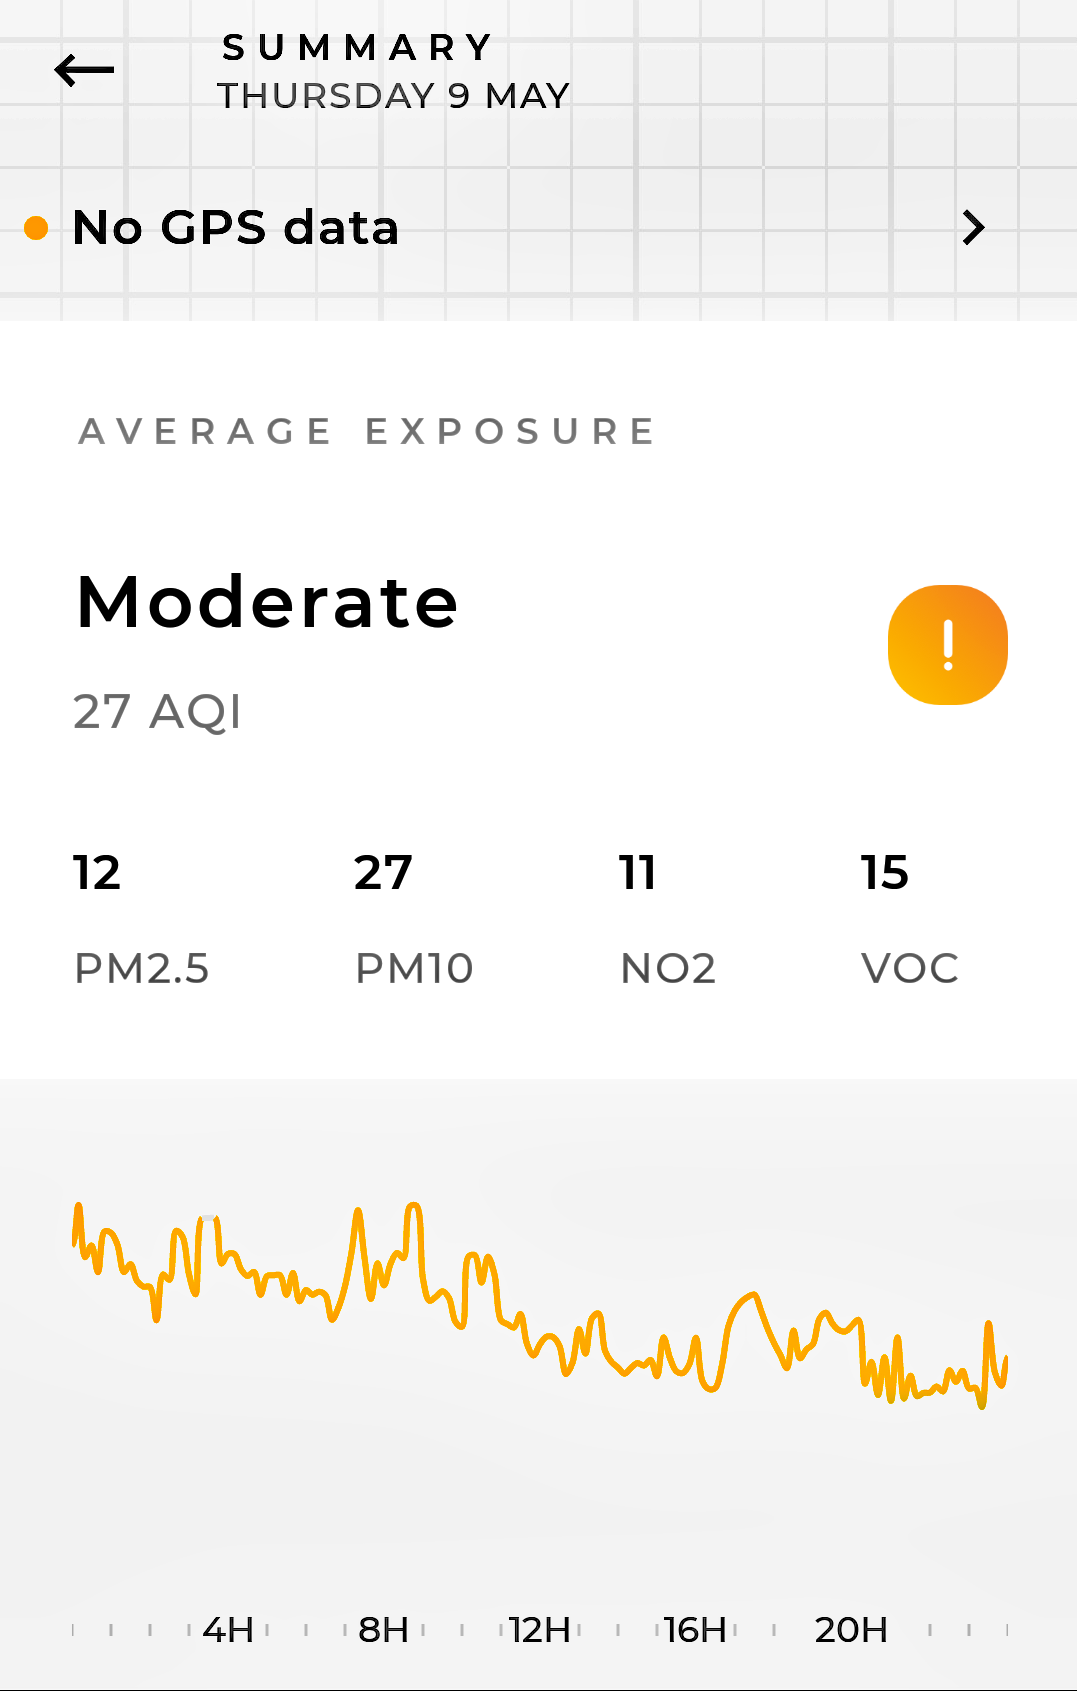
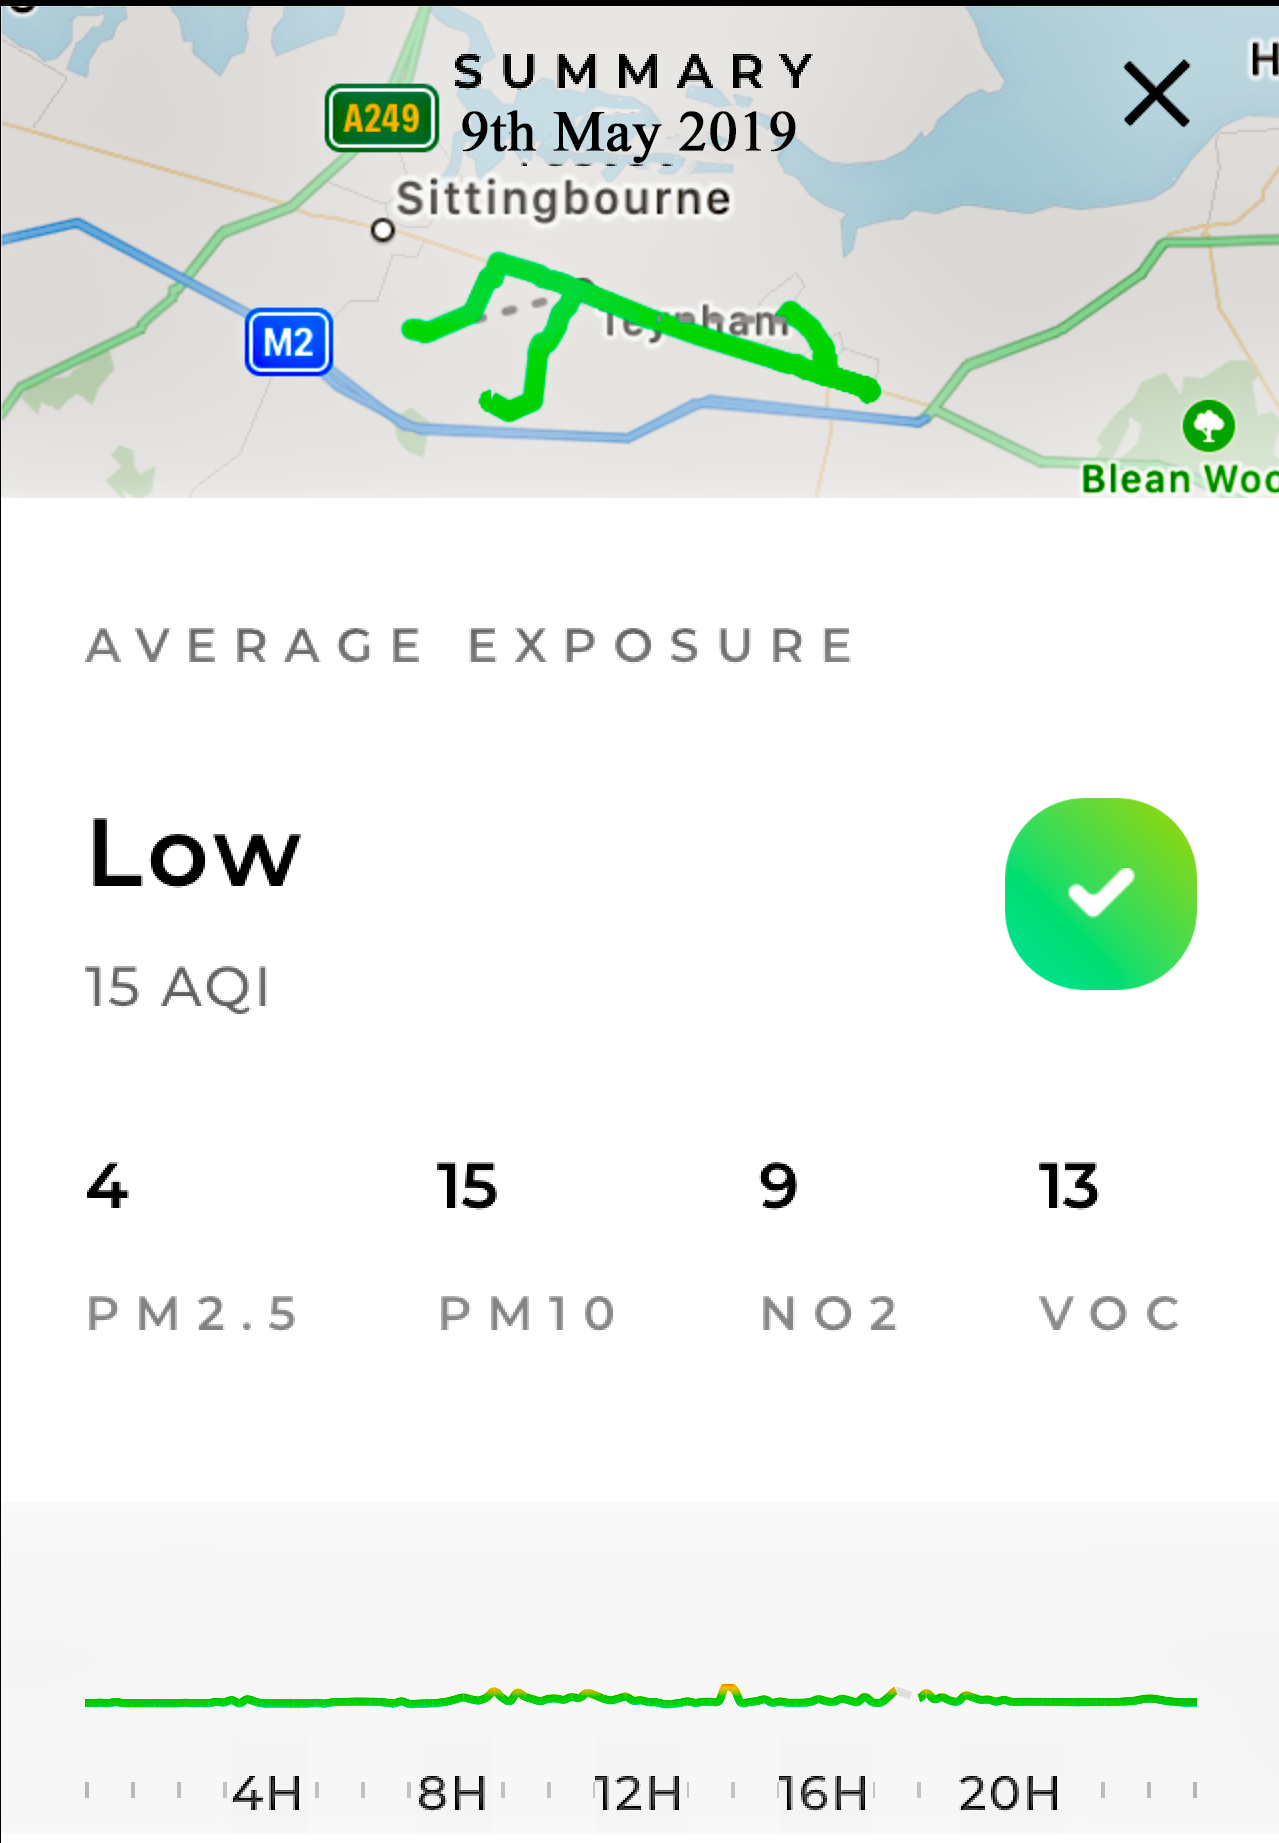
| 9 May Flow 1 A2 Flow 2 Kingsdown |
12 4 |
27 15 |
11 9 |
15 13 |
MODERATE GREEN |
Graph. Wind SSW - WSW - W - SW - NW - NNW (ave: 12kph) Rain 15.10 mm (patchy) Flow 2: Graph and map |
||
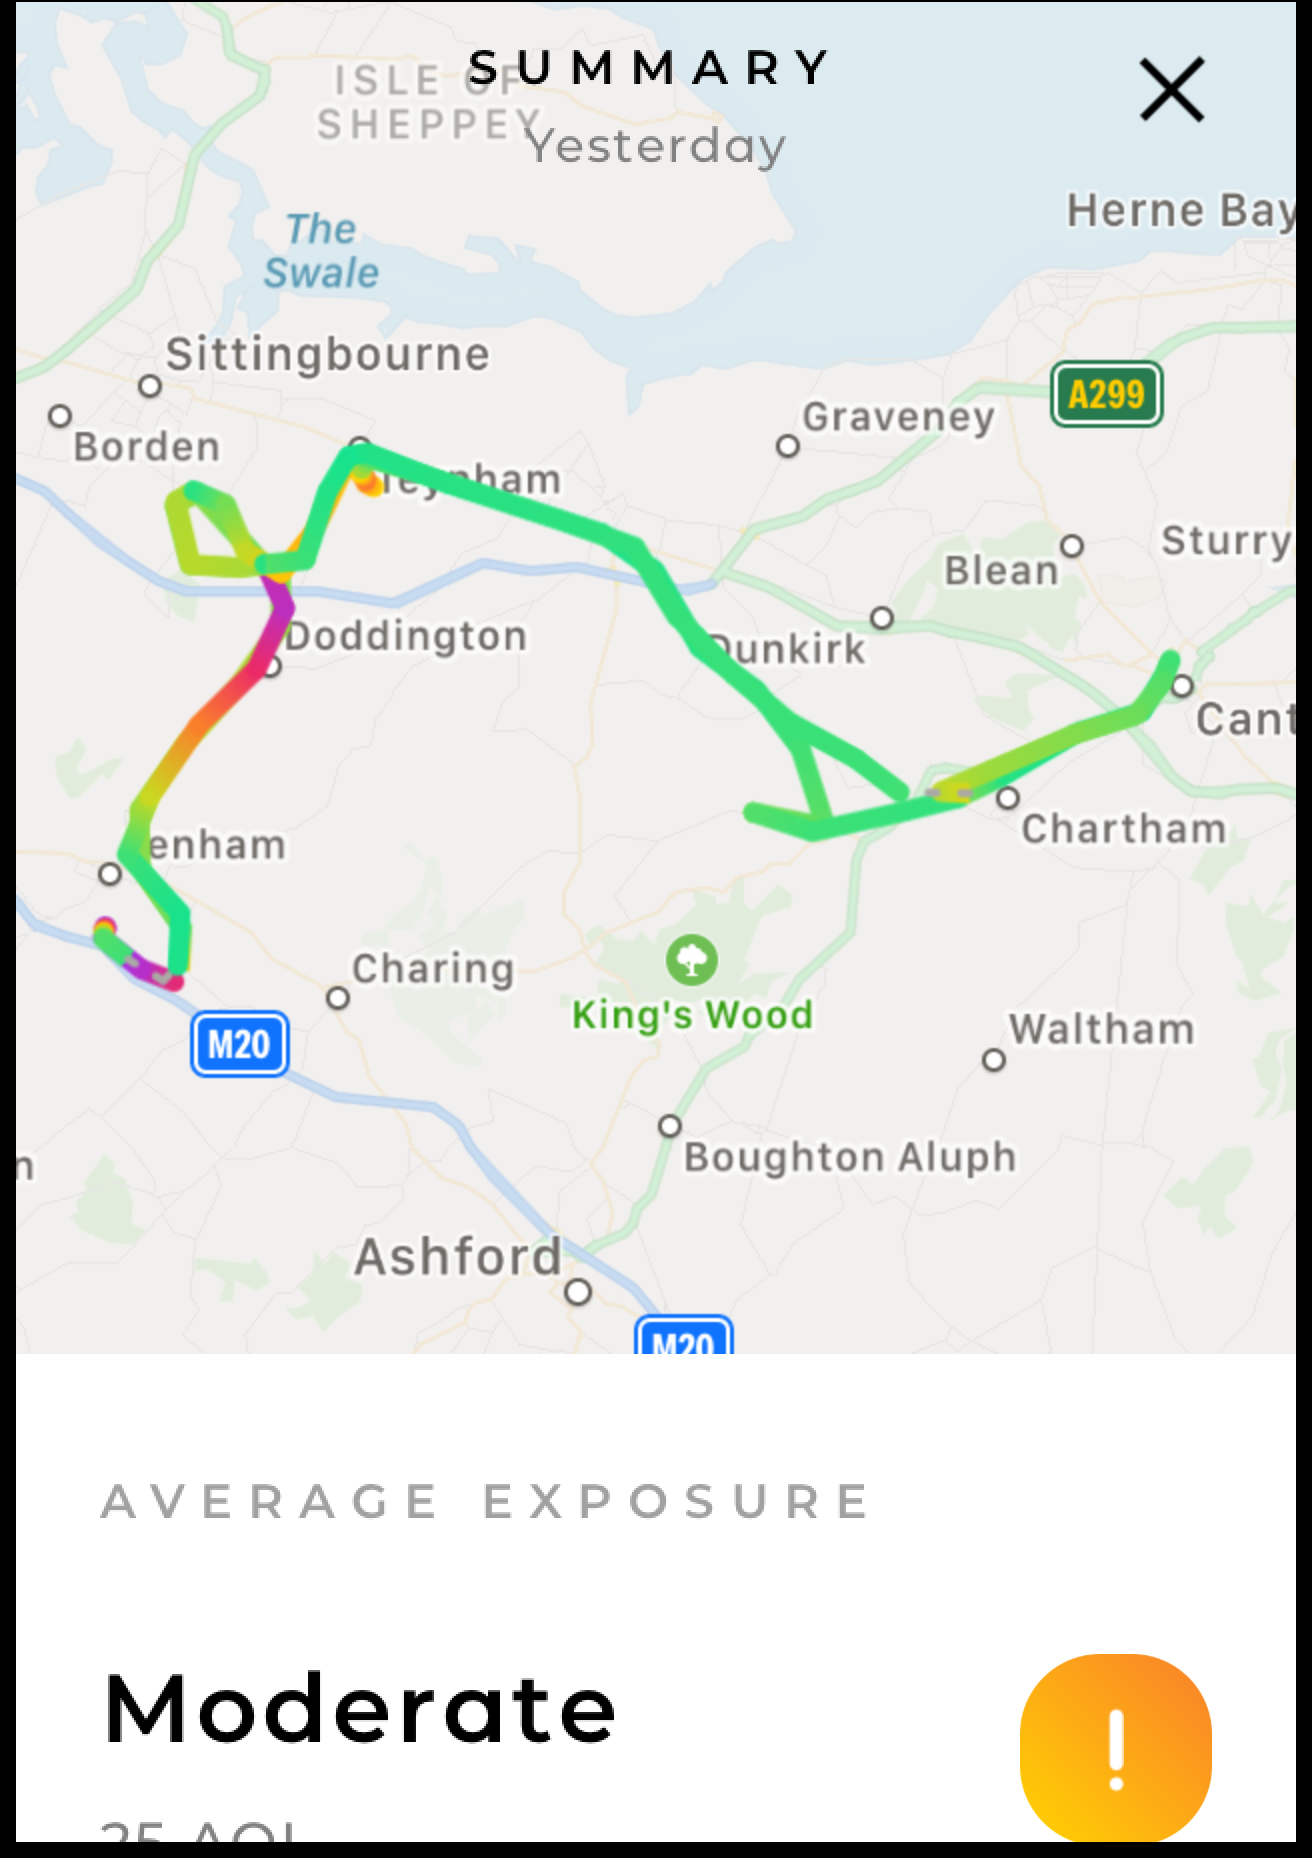
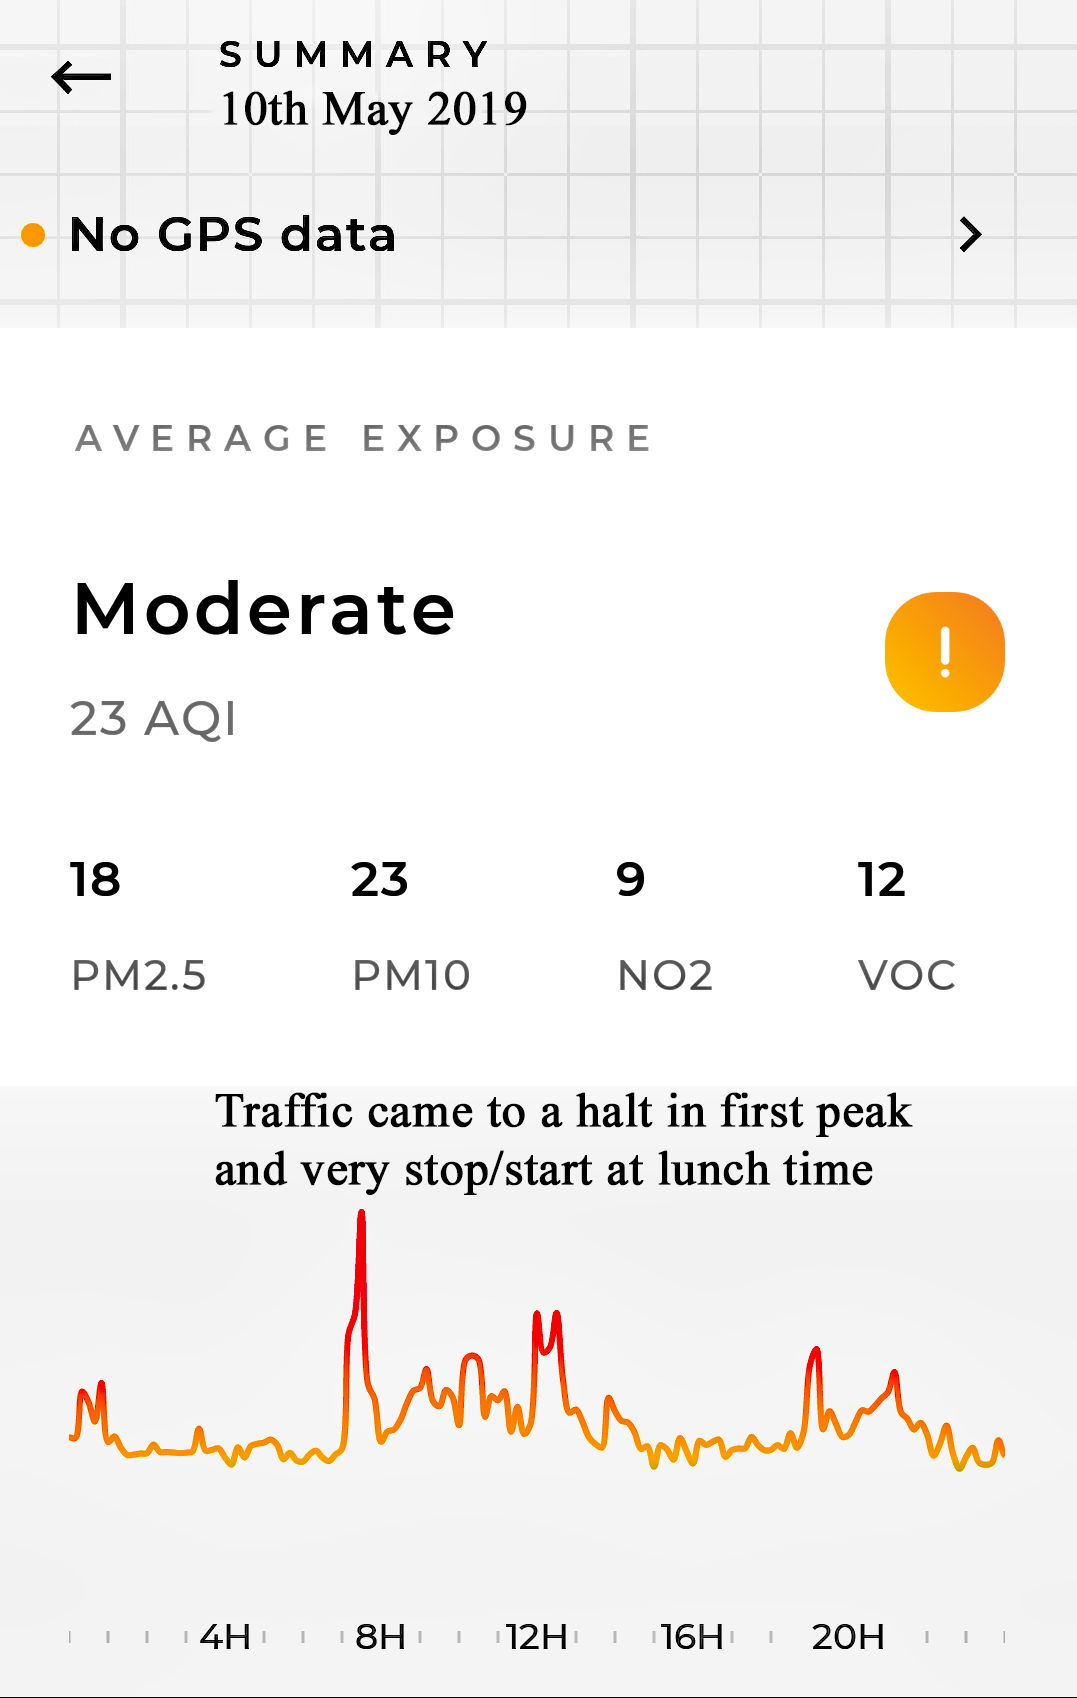
| 10 May Flow 1 Flow 2 |
18 12 |
23 25 |
9 6 |
12 13 |
MODERATE Greenstreet Kingsdown+ |
Graph. Wind NW - W - WSW - SSW - S (ave: 9kph) Rain 4.9mm (most of the day - patchy) Flow 2 Map: M2 and M20. Averages shown |
||
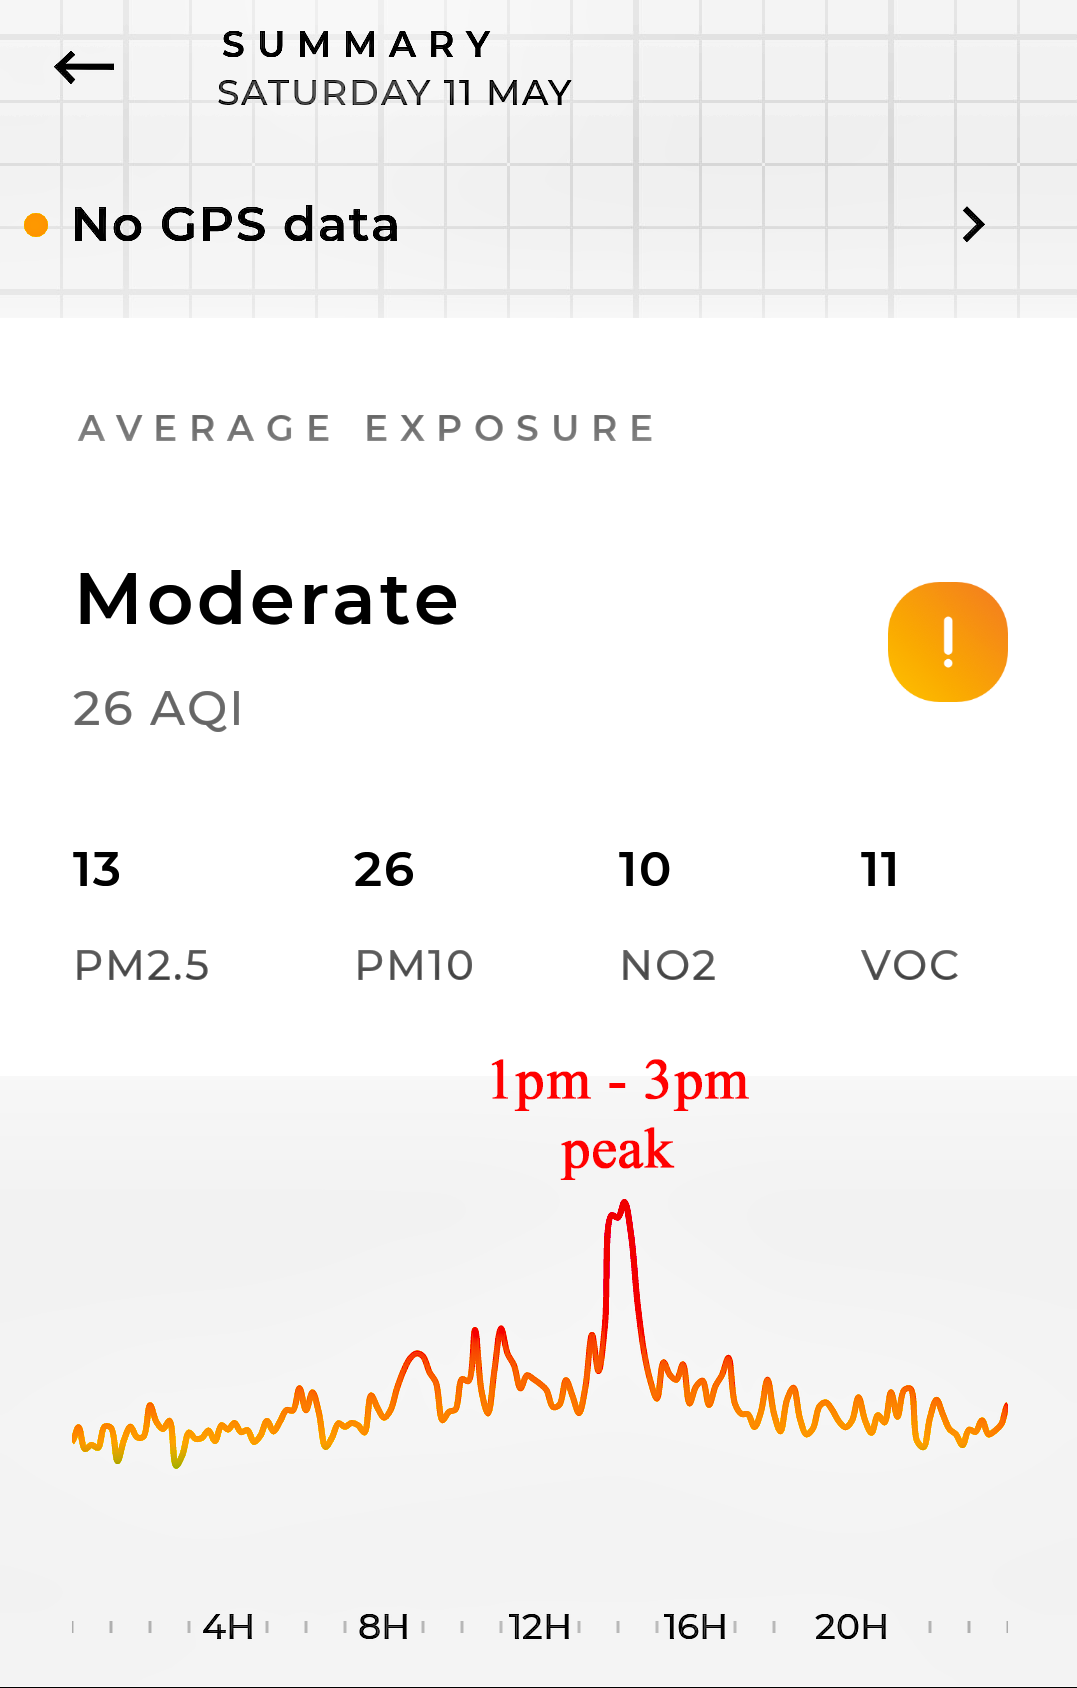
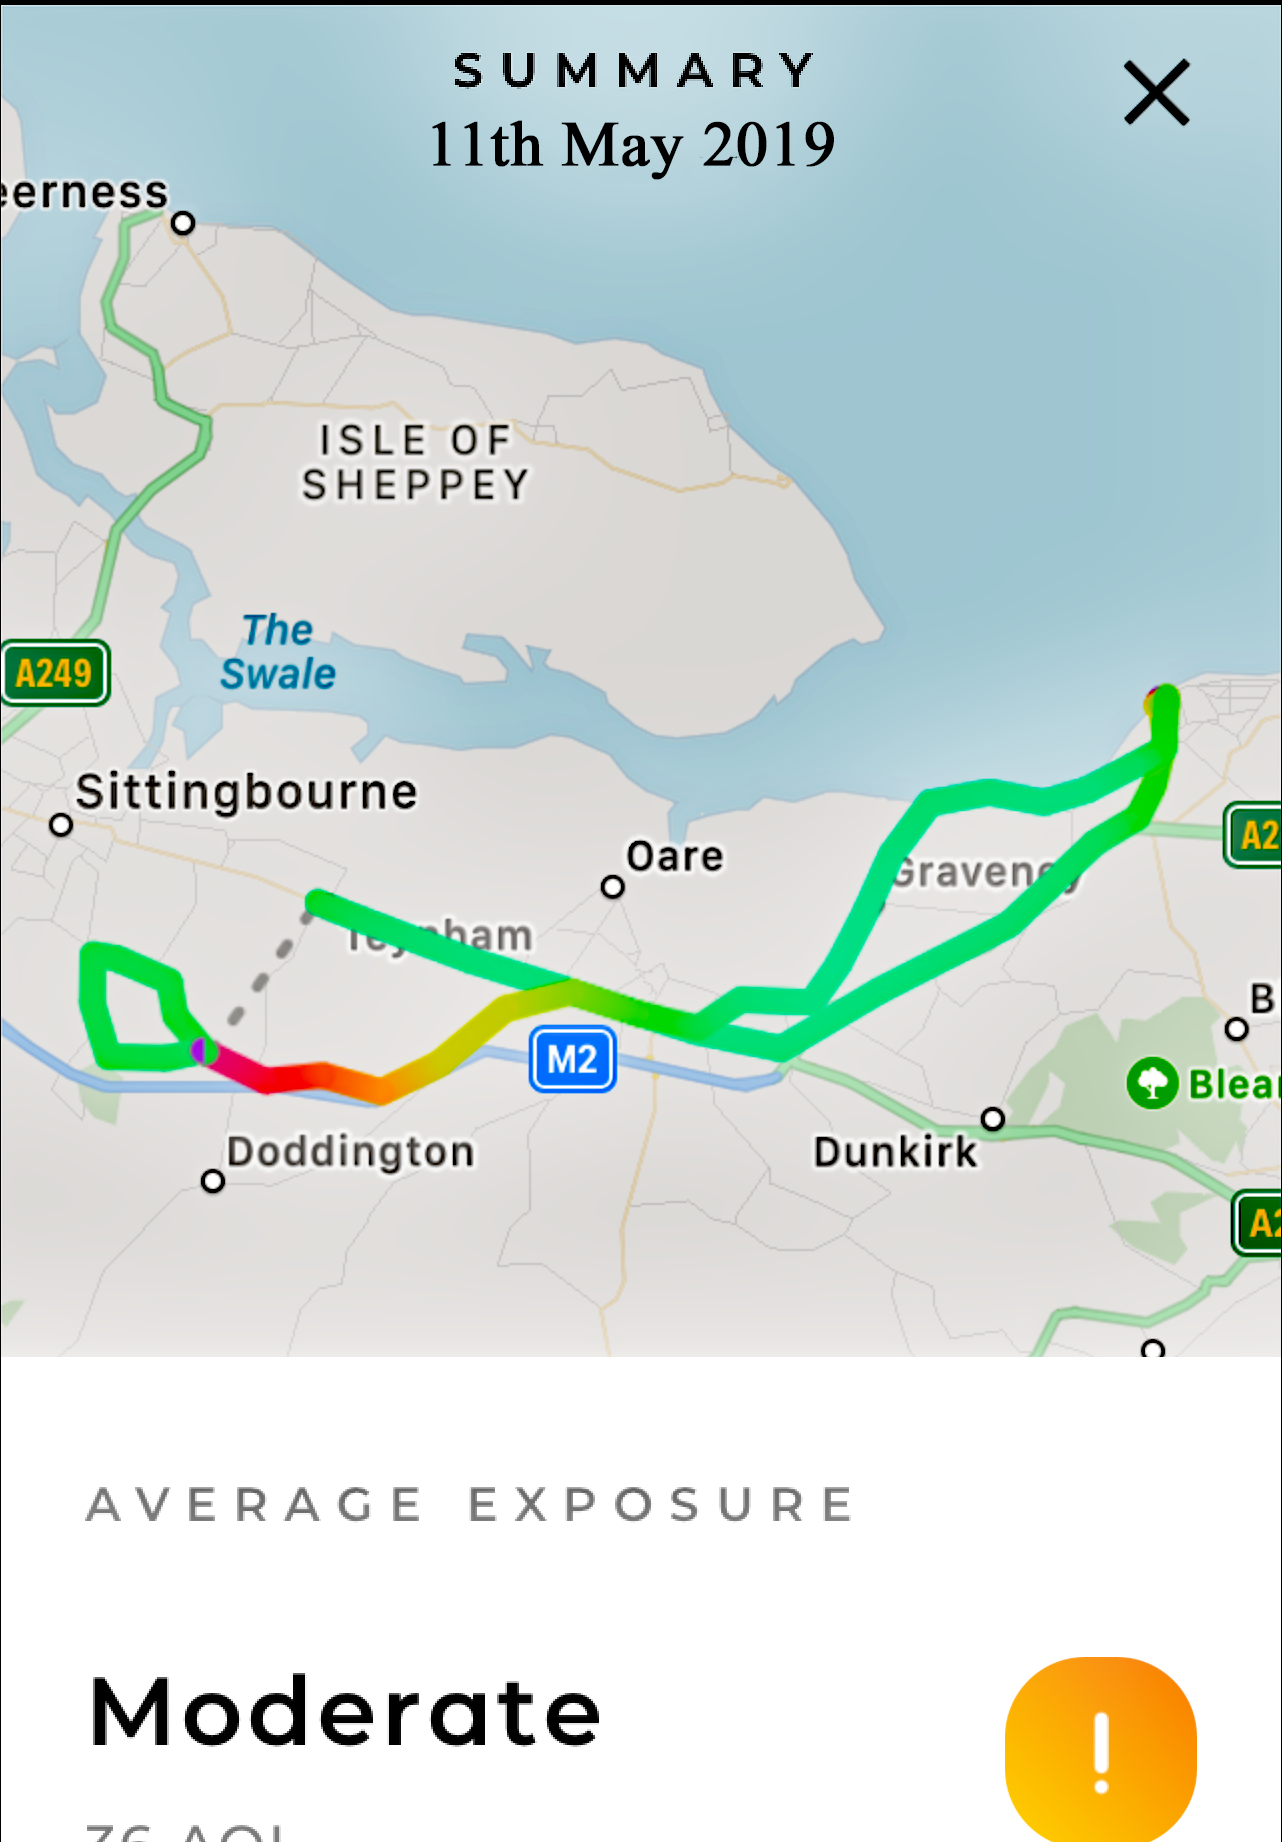
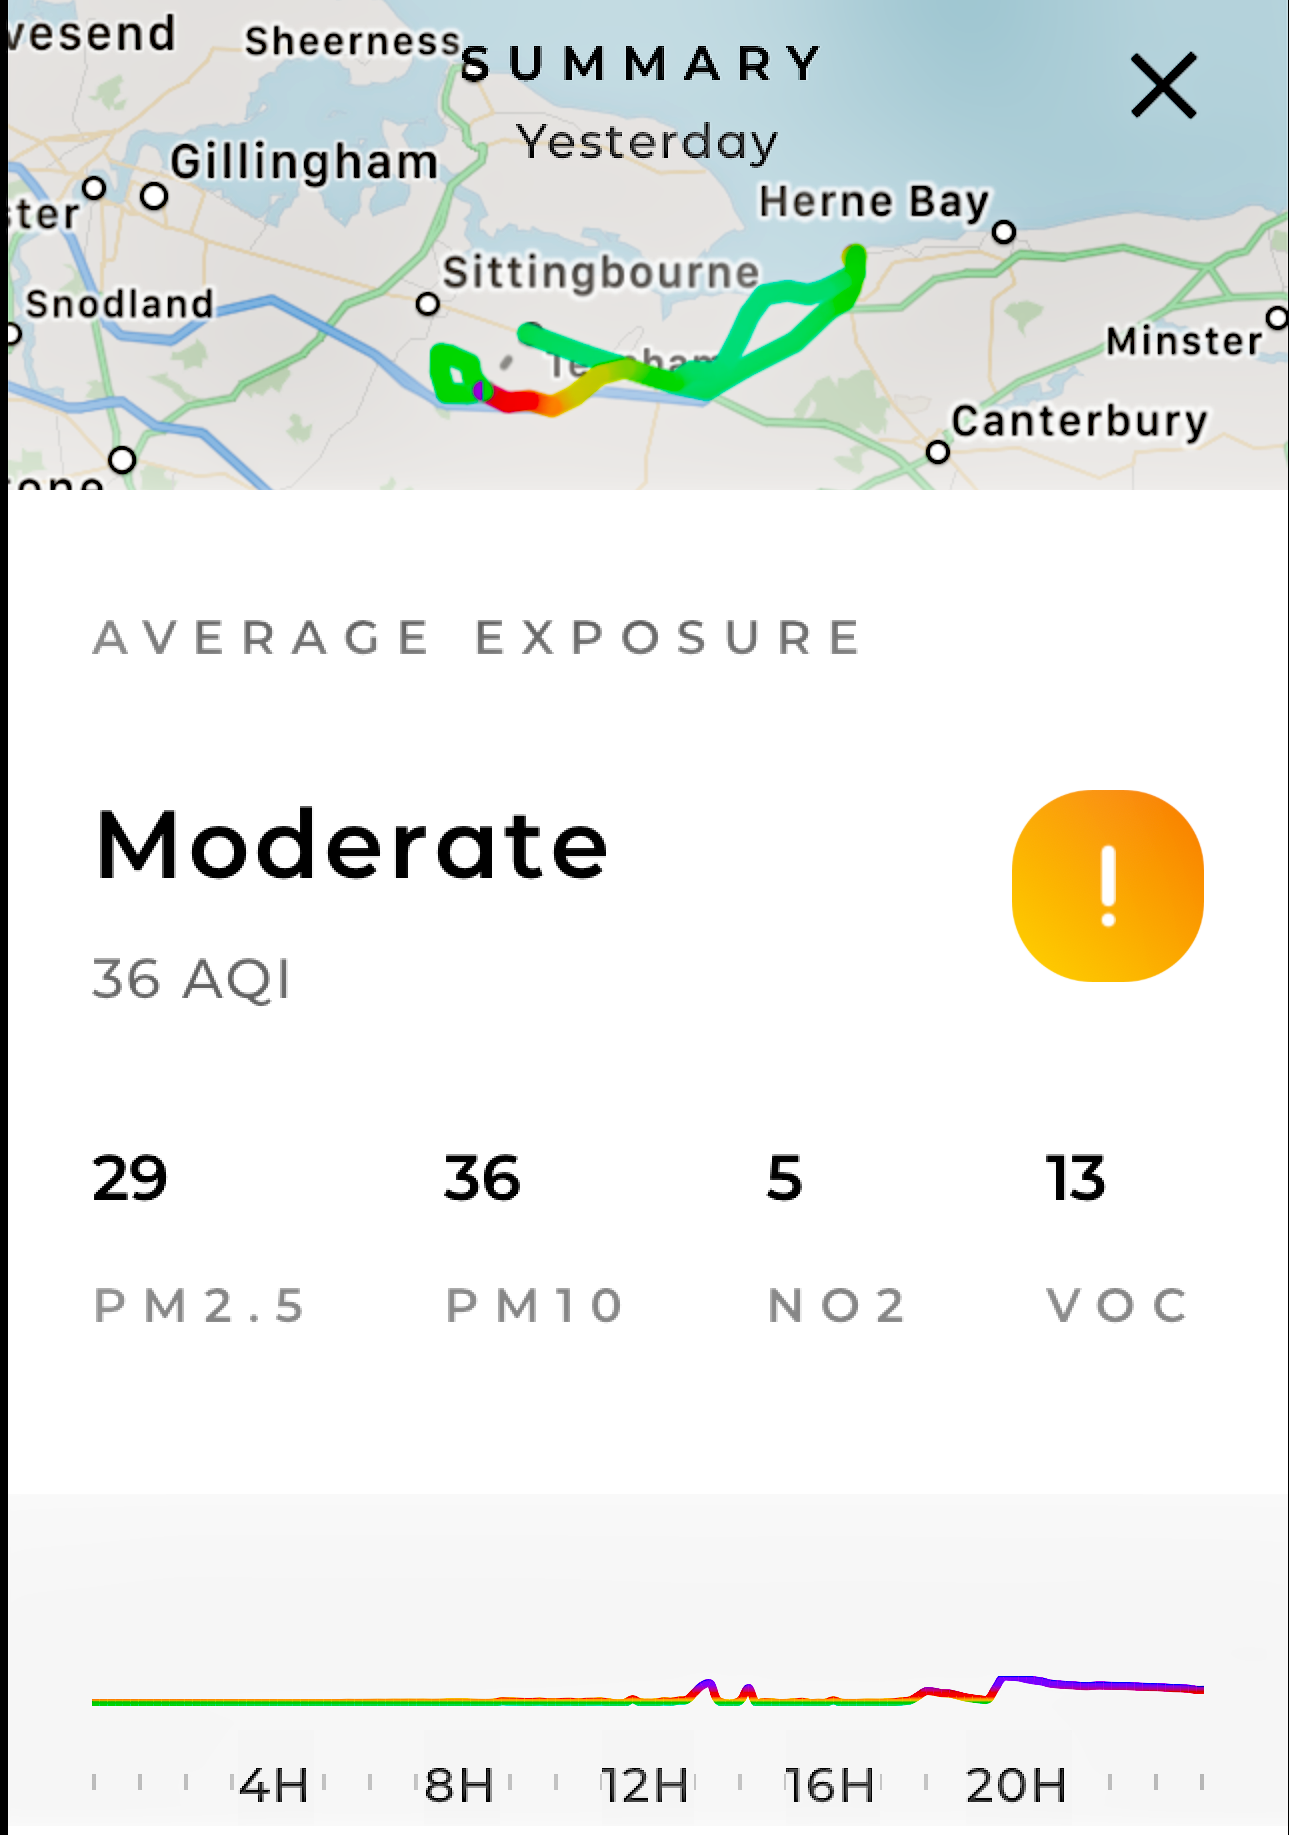
| 11 May Flow 1 Flow 2 |
13 12 |
26 30 |
10 27 |
11 10 |
MODERATE Greenstreet Kingsdown+ |
Graph. Wind ENE - N - ENE - E (ave: 10kph) Rain 13mm (midday onward) Flow 2 Map: (a) Clean to Whitstable except near the M2. PM10 mainly; (b) 24-hour period |
||
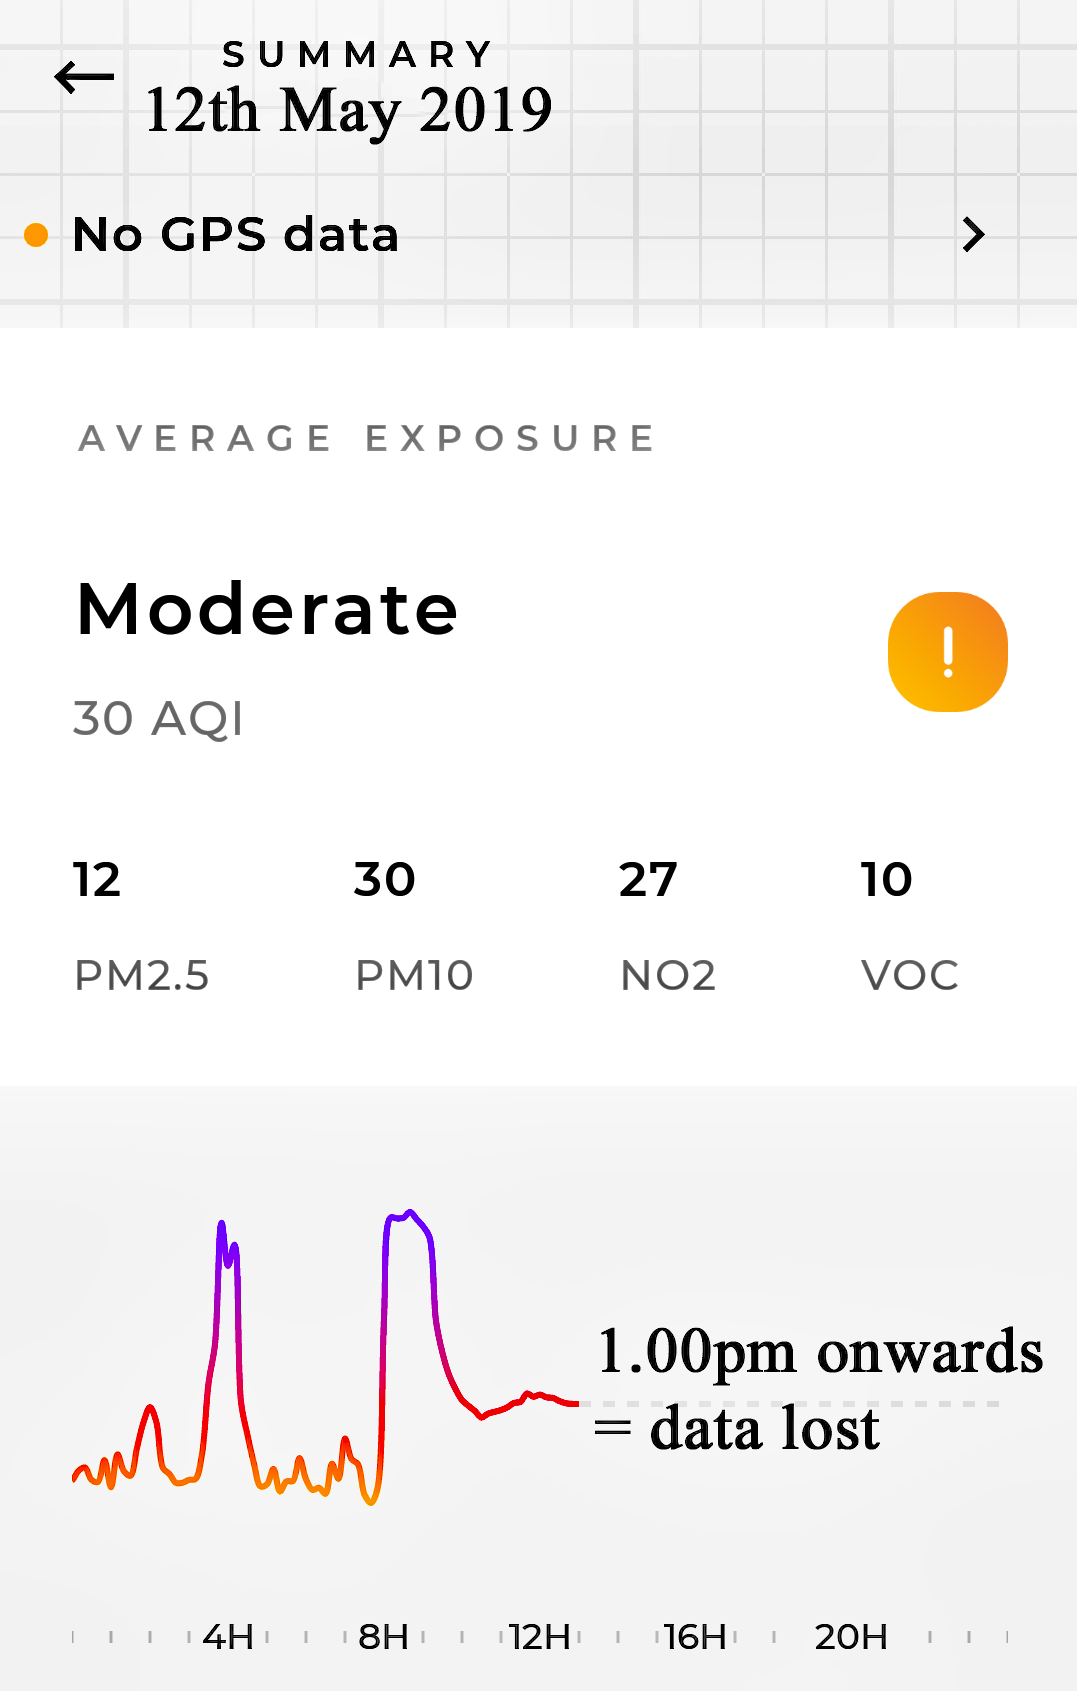
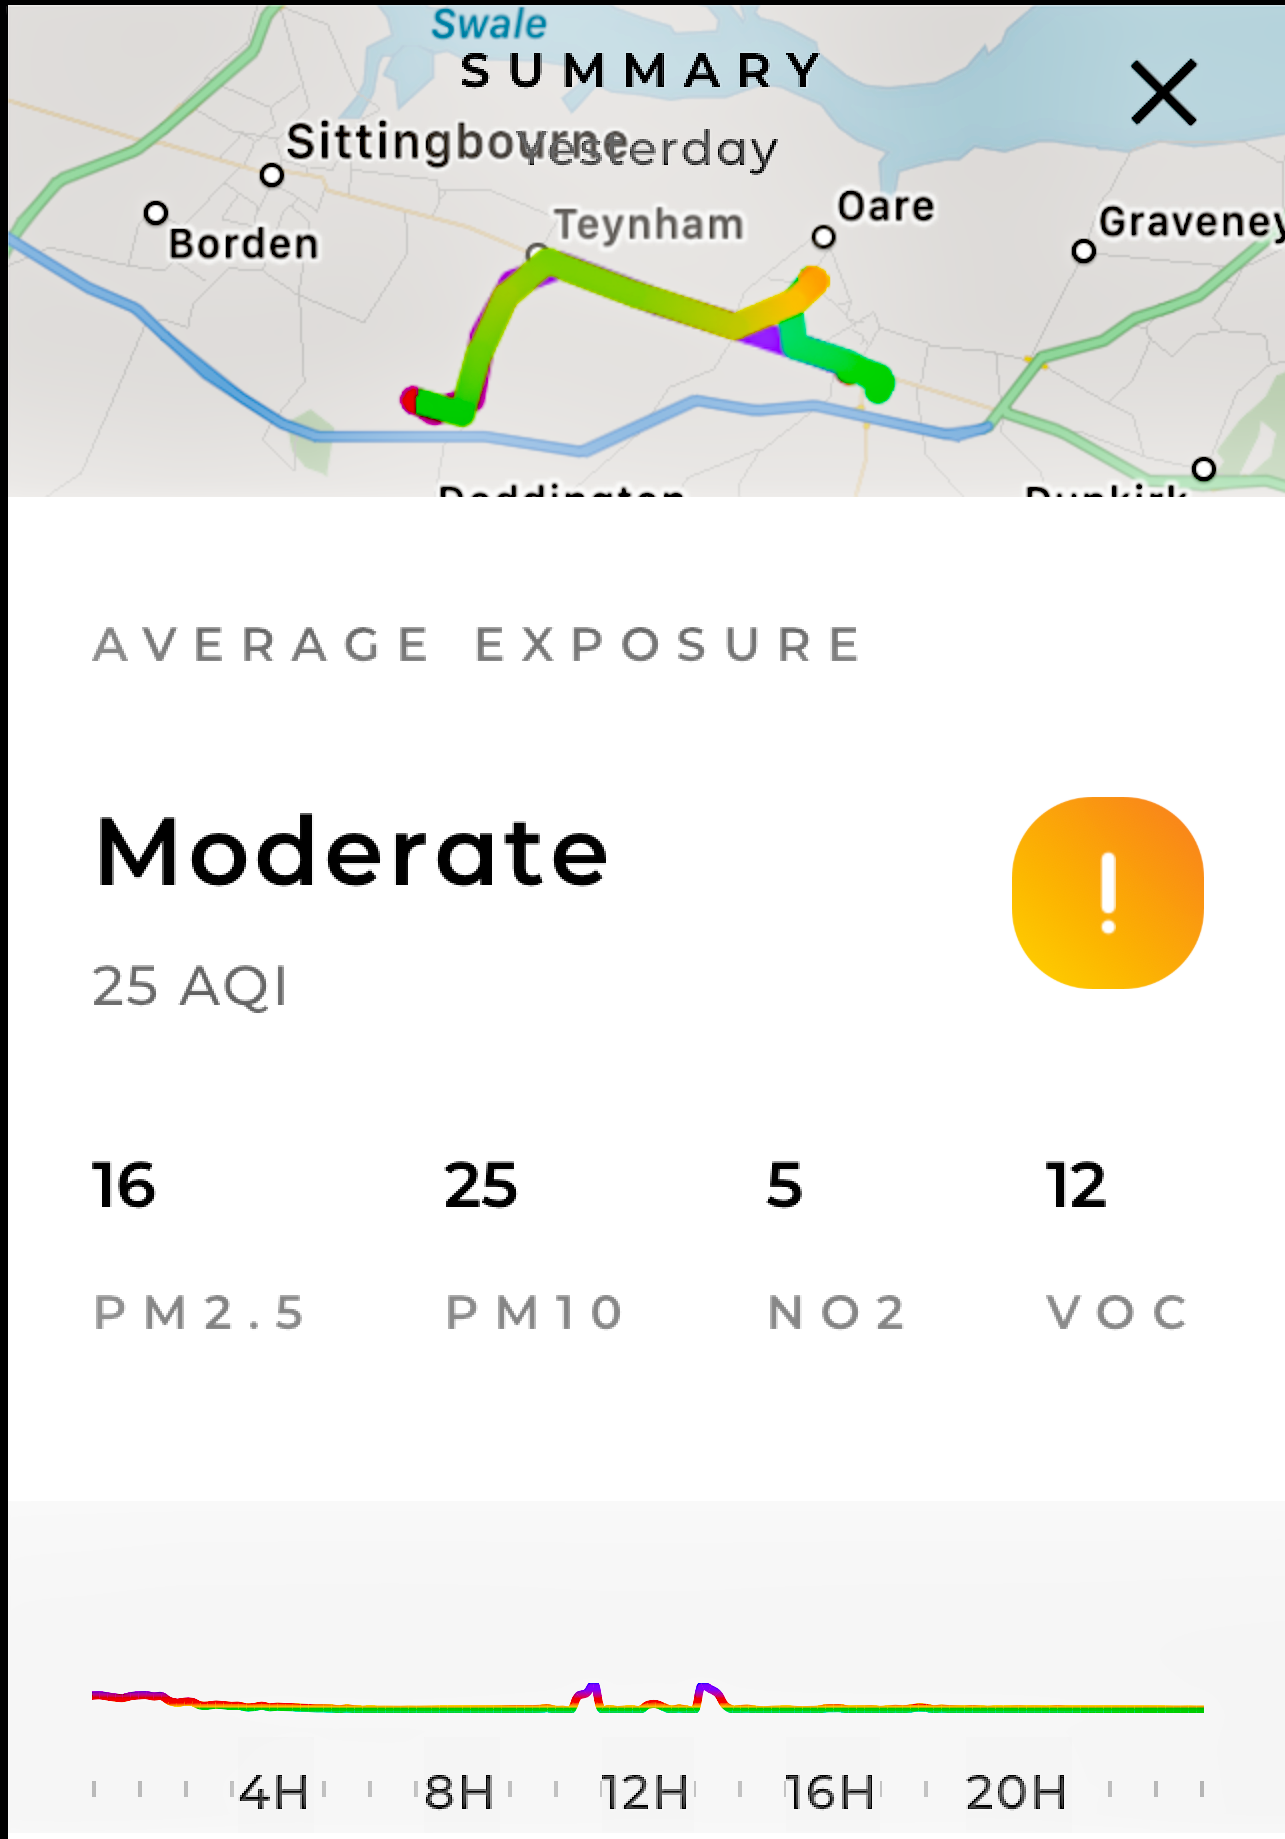
| 12 May Flow 1 Flow 2 |
12 16 |
30 25 |
27 5 |
10 12 |
MODERATE |
Graph: Data until 1pm. Curiously, the graph equates to the Flow 2 the previous day. Flow 2 Map: Air pollution changed travelling eastward and westward on A2. May arise from air conditioner setting (recycle?), vehicles ahead are more polluting, bonfires have been lit? Detailed Map. Unresolved |
||
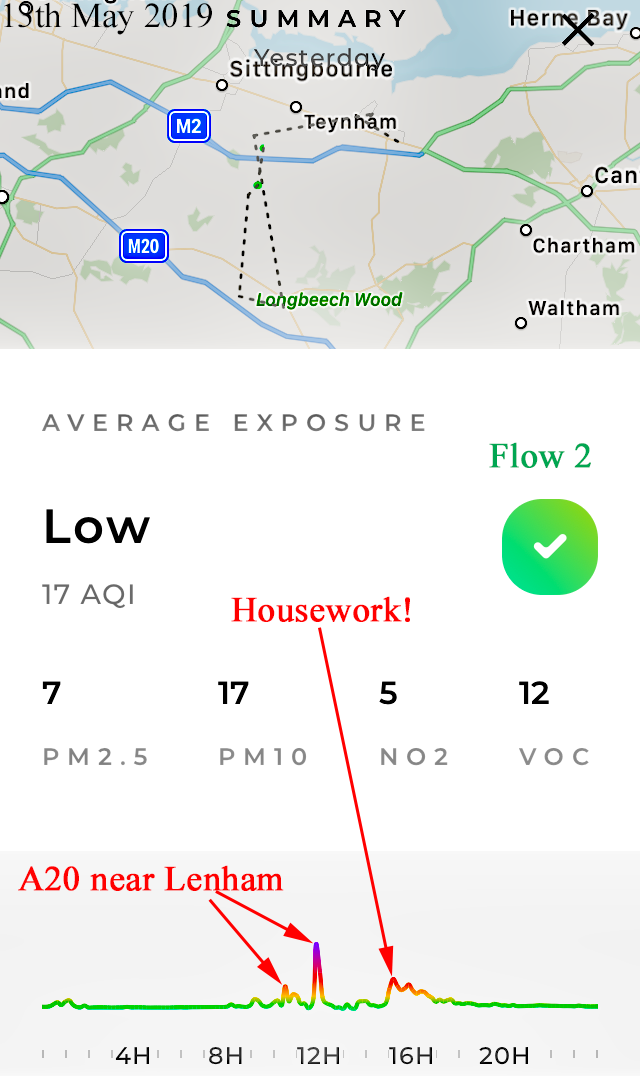
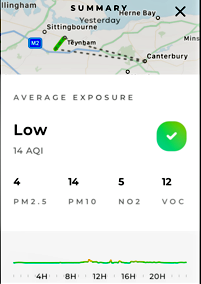
| 13 May Flow 1: None Flow 2: Kingsdown |
- 7 |
- 17 |
- 5 |
- 12 |
NO DATA LOW Kingsdown+ |
No Data: Wind light then stiffening - ENE - E - ENE (ave 14 kph). Flow 2: Graph: Clean-air south of Lynsted village but interesting as it shows peaks near the A20 (morning and midday) and don't forget housework as a source of pollution (afternoon peaks). The mapping feature may have lost satellite links to give the odd pattern? |
||
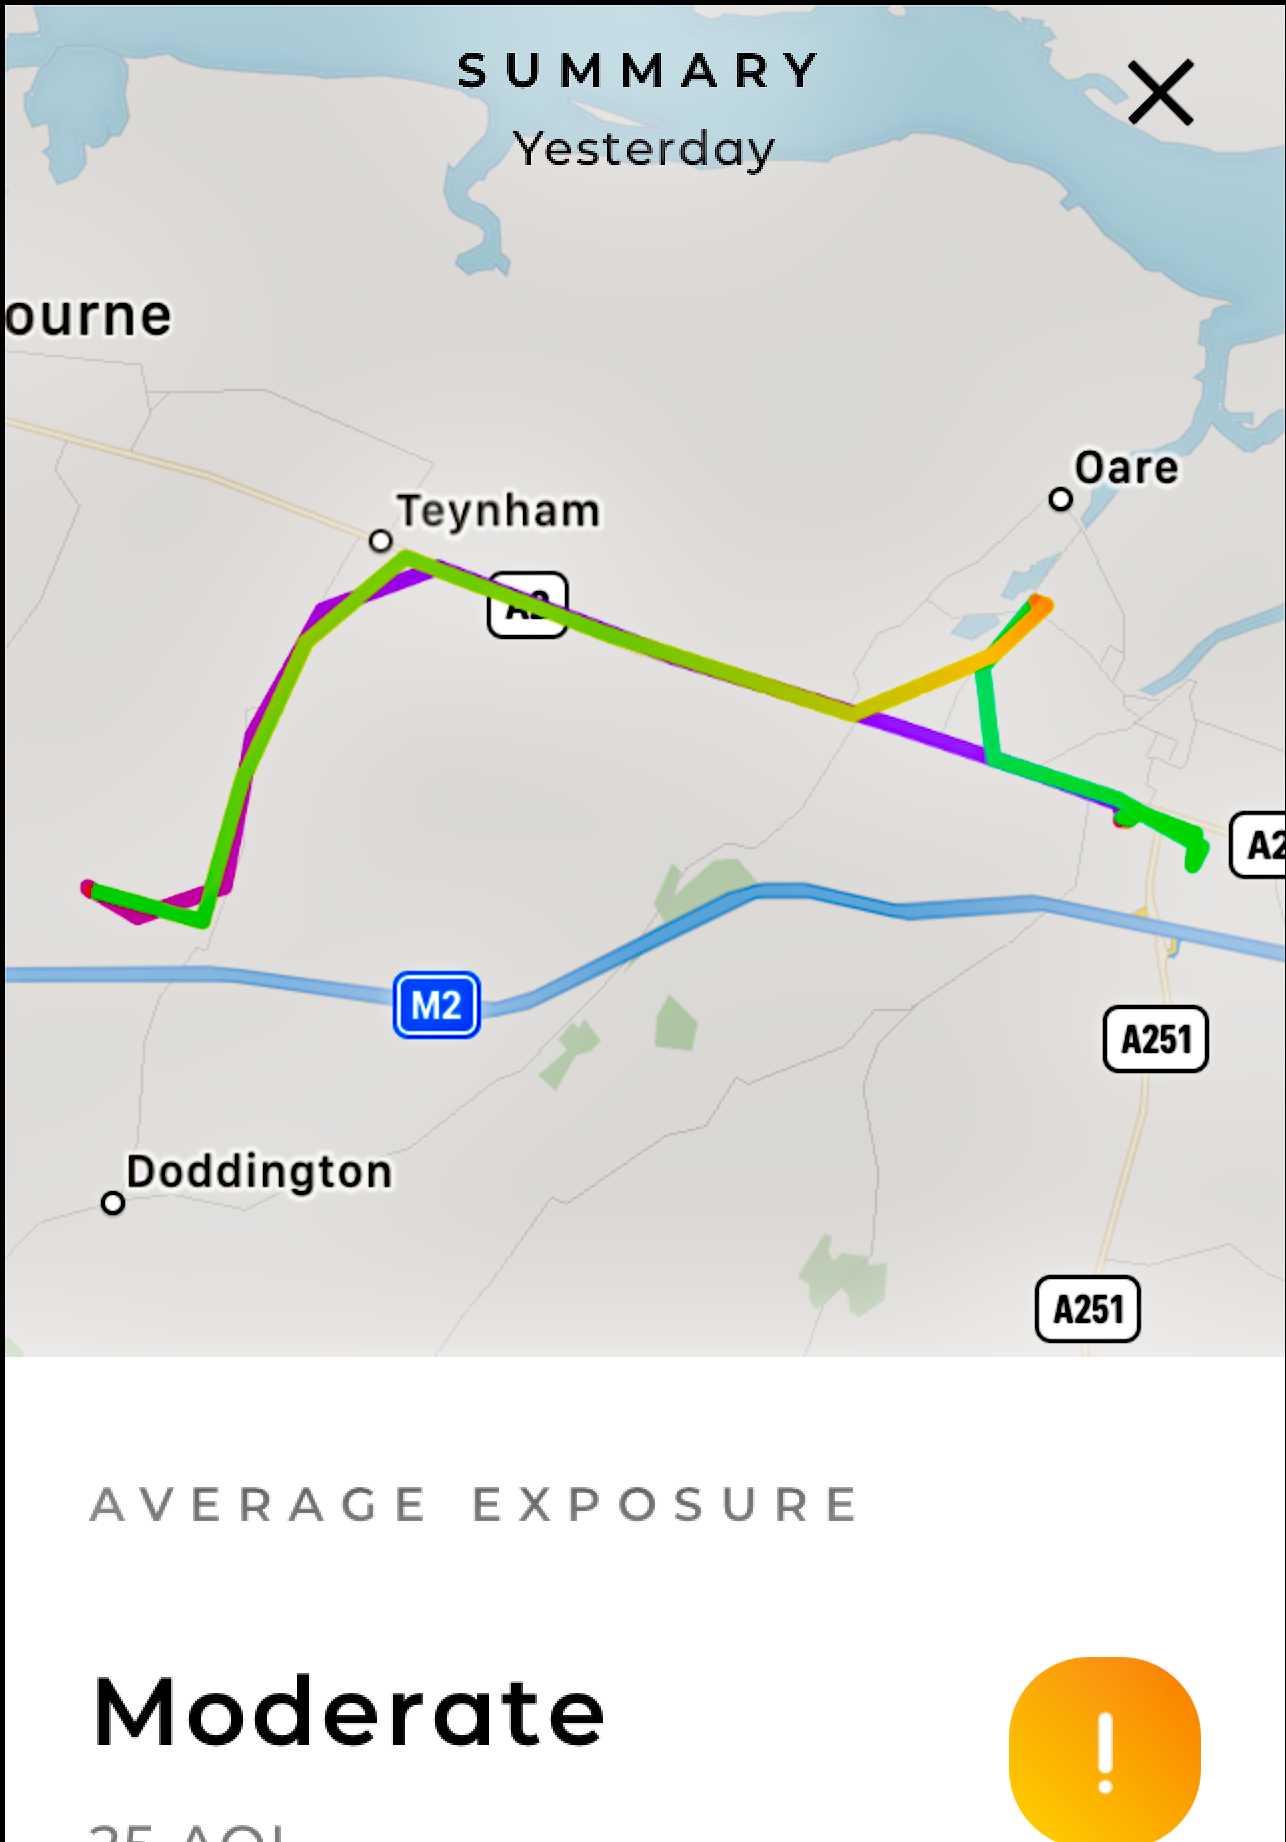
| 14 May Flow 1 Greenstreet Flow 2 Kingsdown |
10 4 |
25 |
4 5 |
14 12 |
MODERATE LOW |
Graph & Map: Wind: ENE - N - ENE (17kph). Dry and sunny. Graph: Mapping clitch but away from the A2, the clearer air is evident. The pollutant distribution mirrors Flow 1. |
||
| 14 | ||||||||
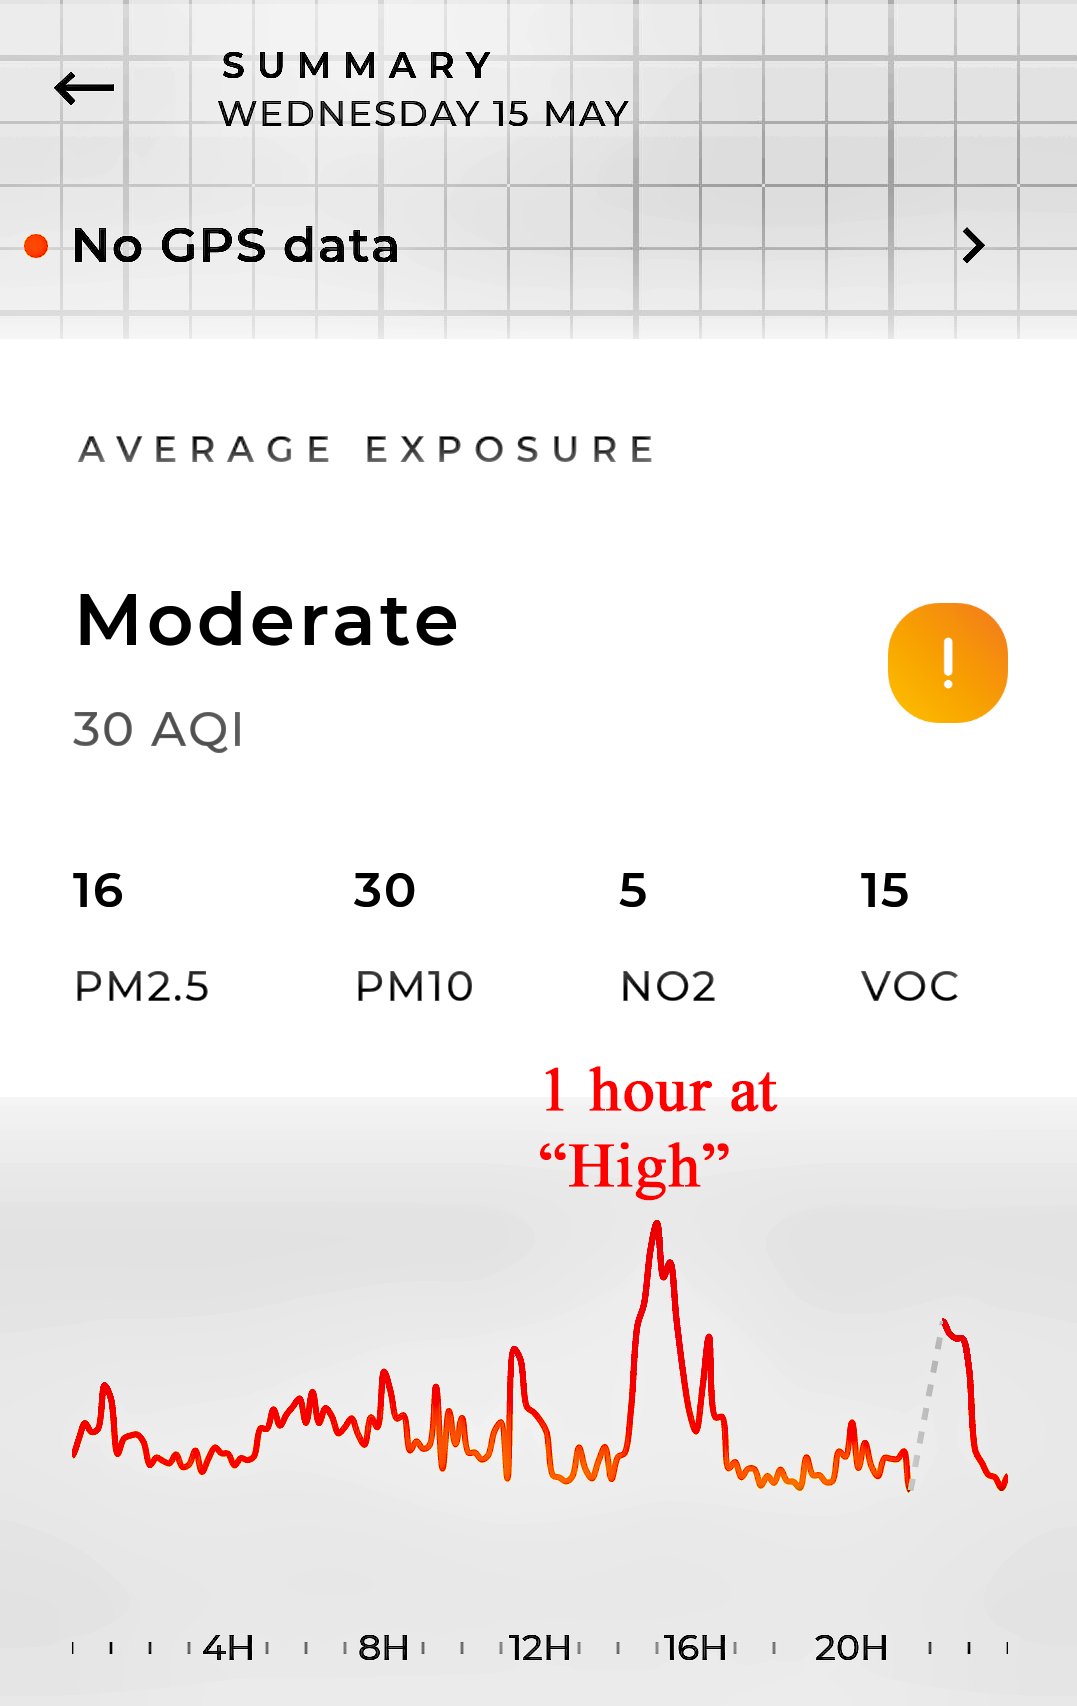
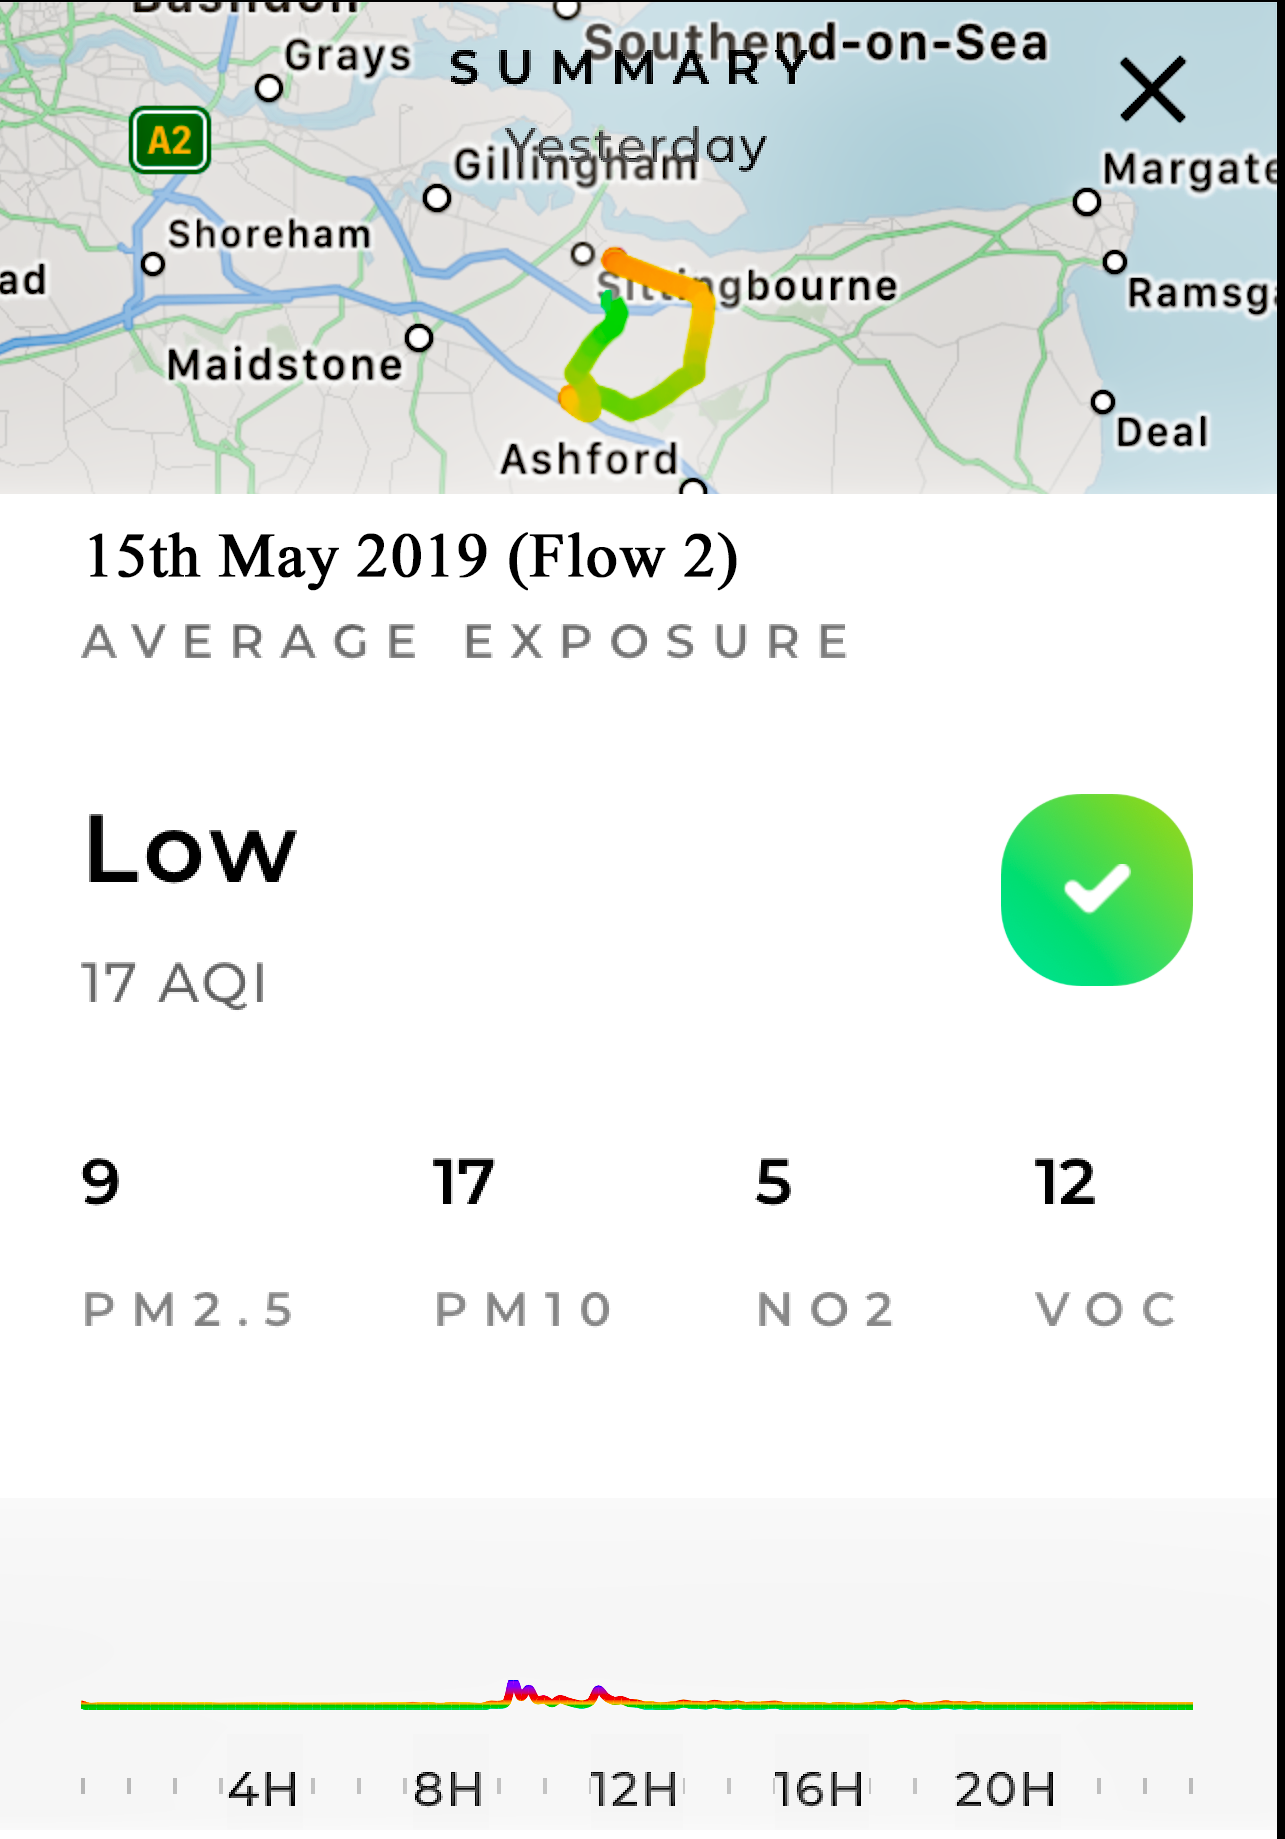
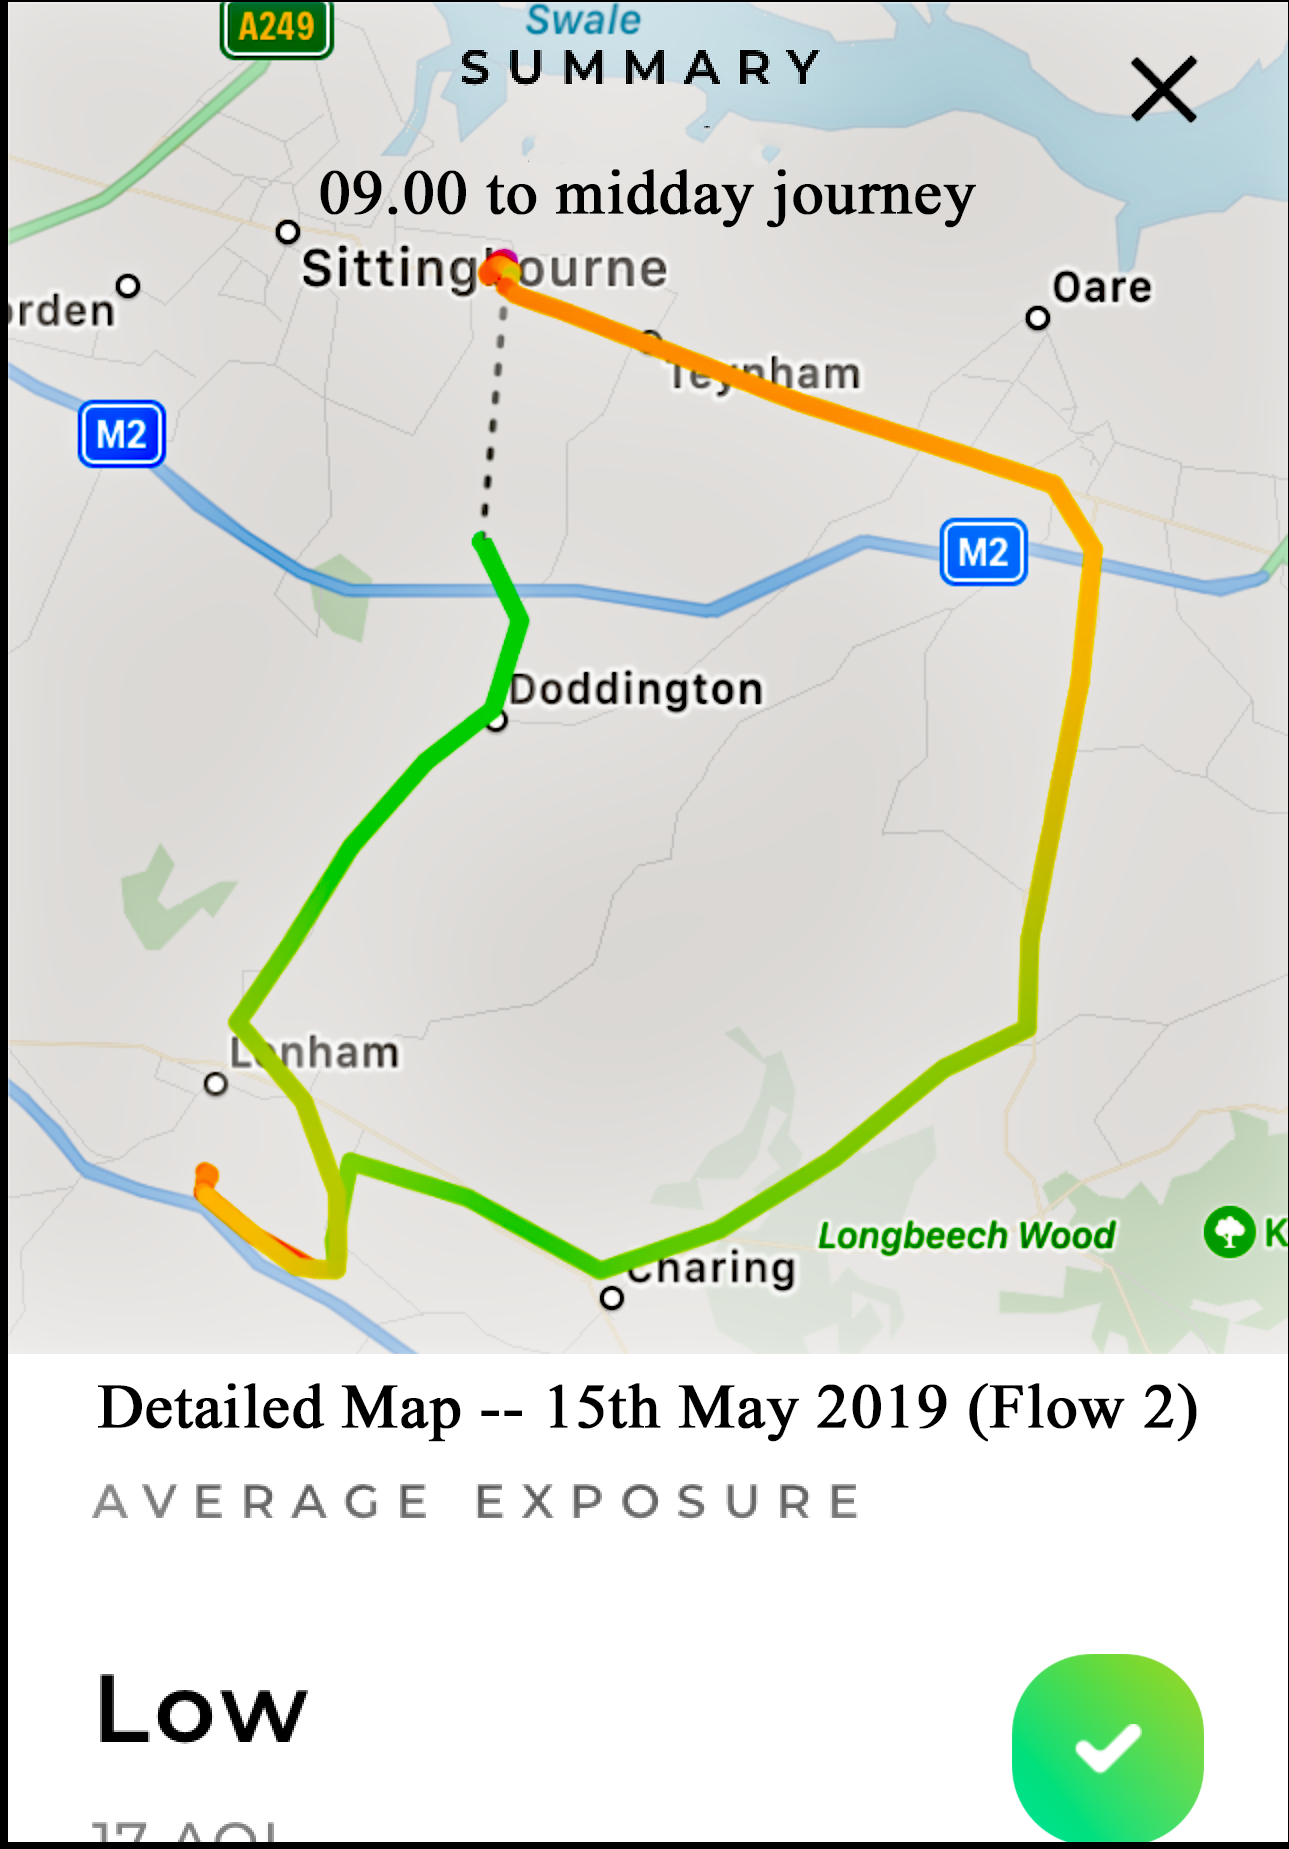
| 15 May Flow 1 Greenstreet Flow 2 Kingsdown |
16 9 |
30 |
5 5 |
15 12 |
MODERATE LOW |
Graph: One hour of "High" from 2.30pm. Wind: ENE - E - ENE (14kph). Dry Graph and Map: Interesting map showing GREEN in the countryside (note nearby Motoways) but more polluted along the A2 and Sittingbourne. |
||
| 17 | ||||||||
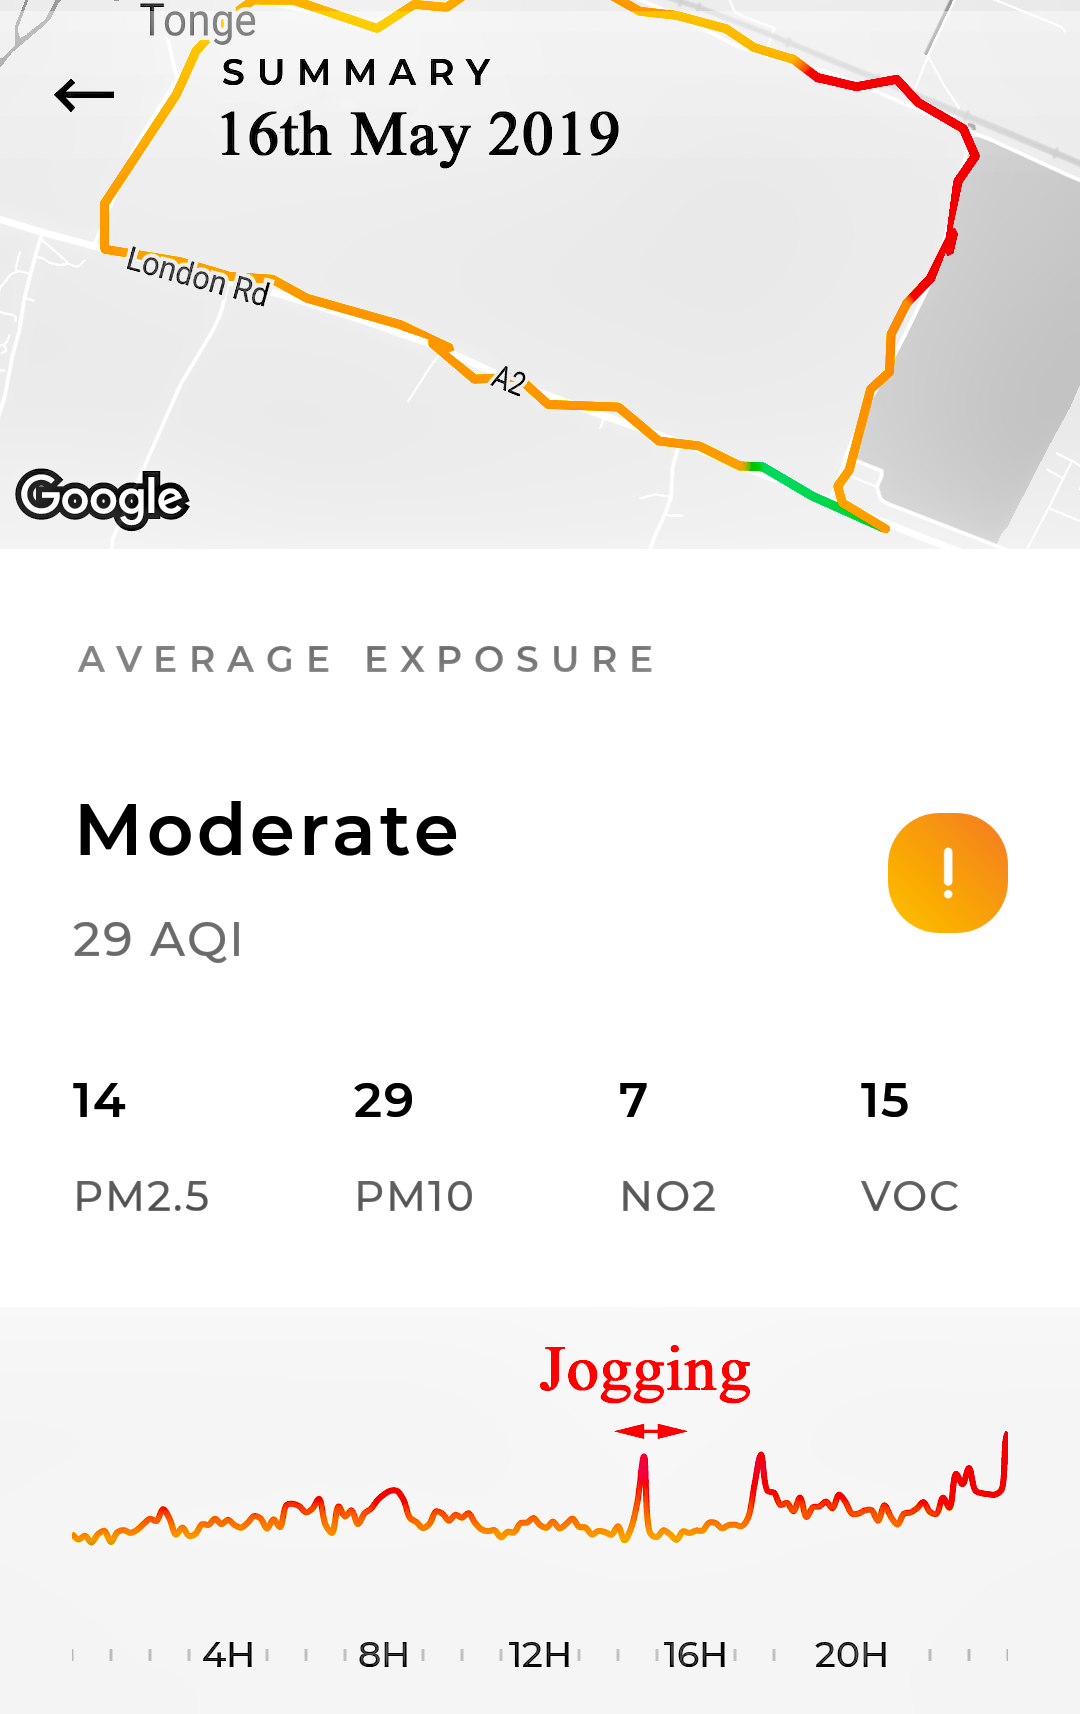
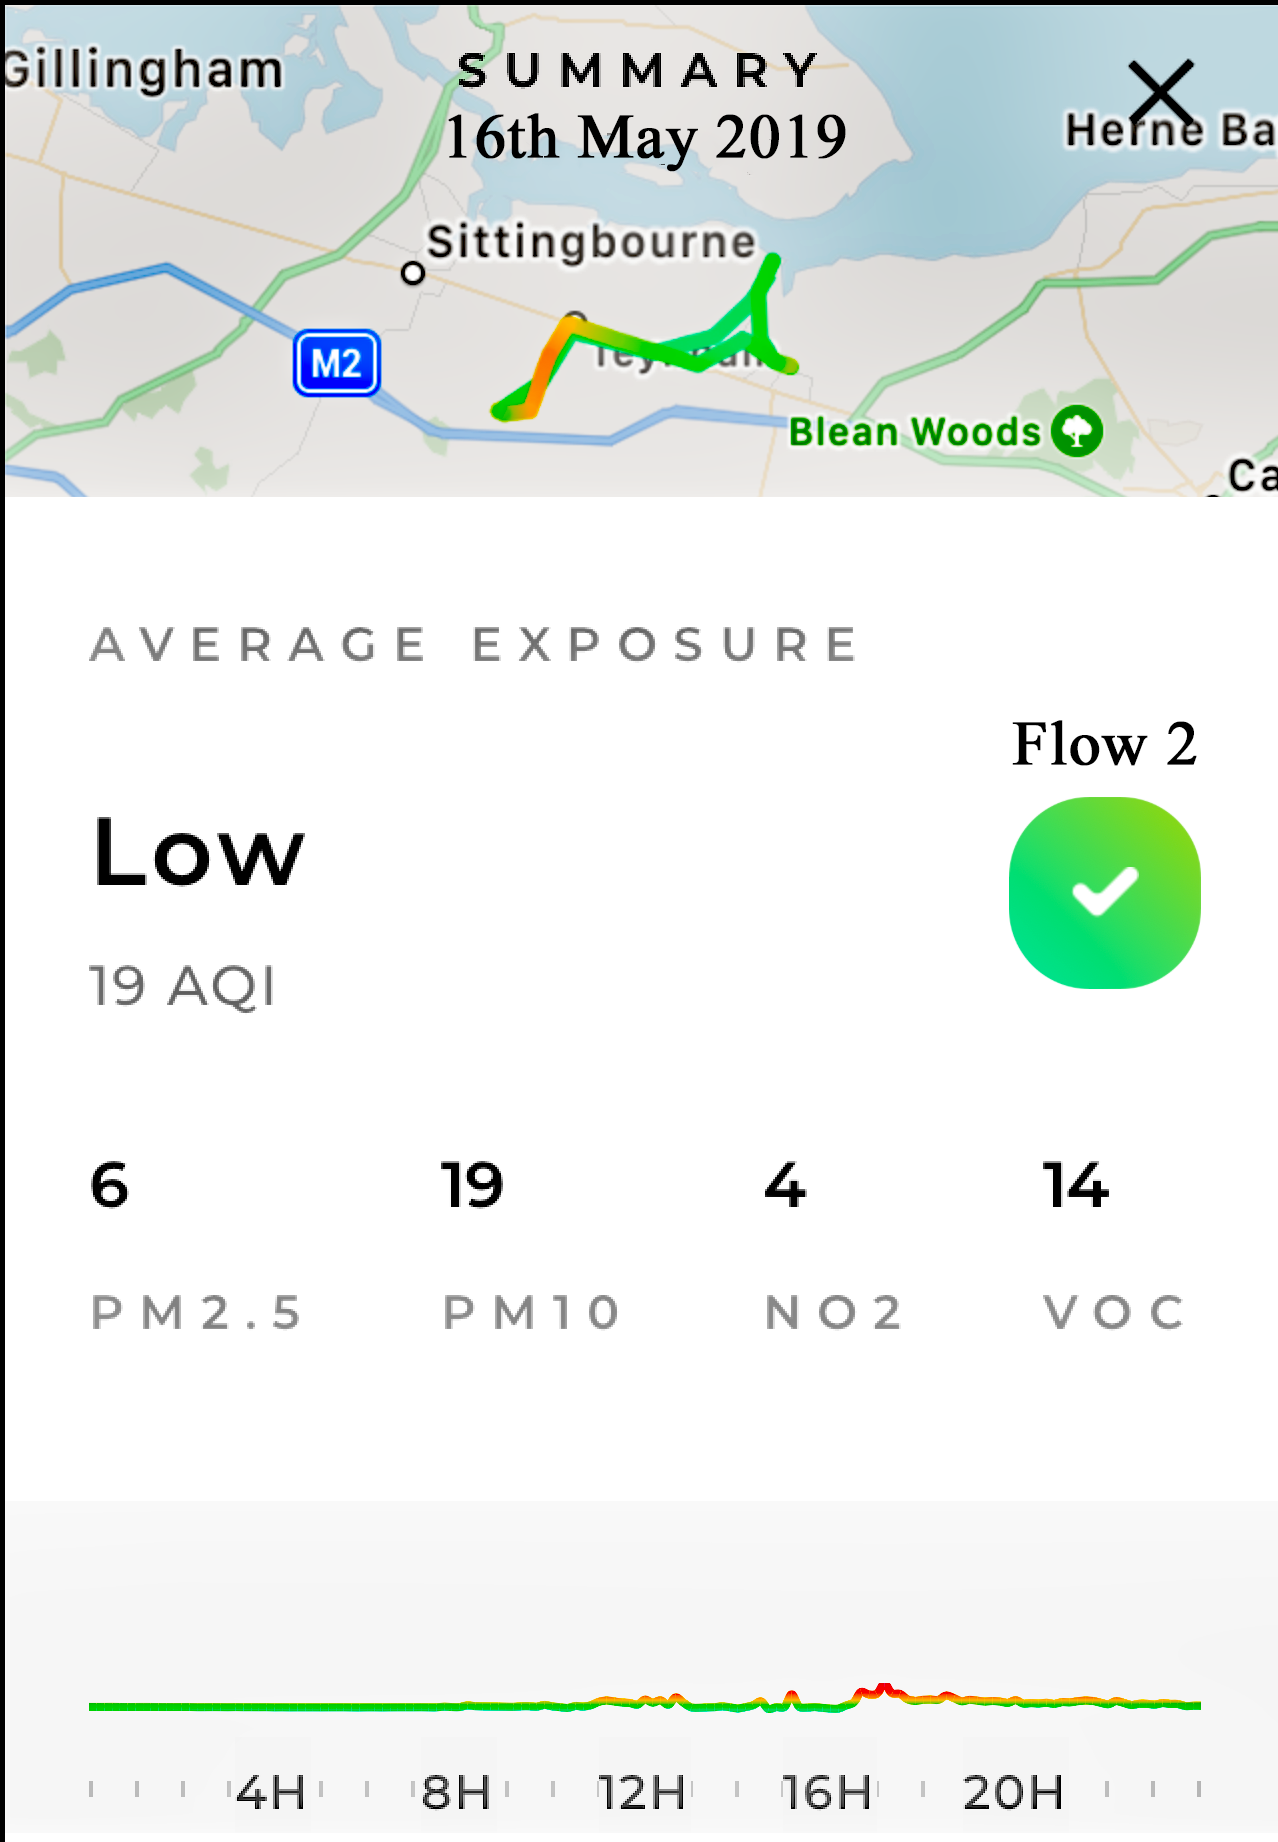
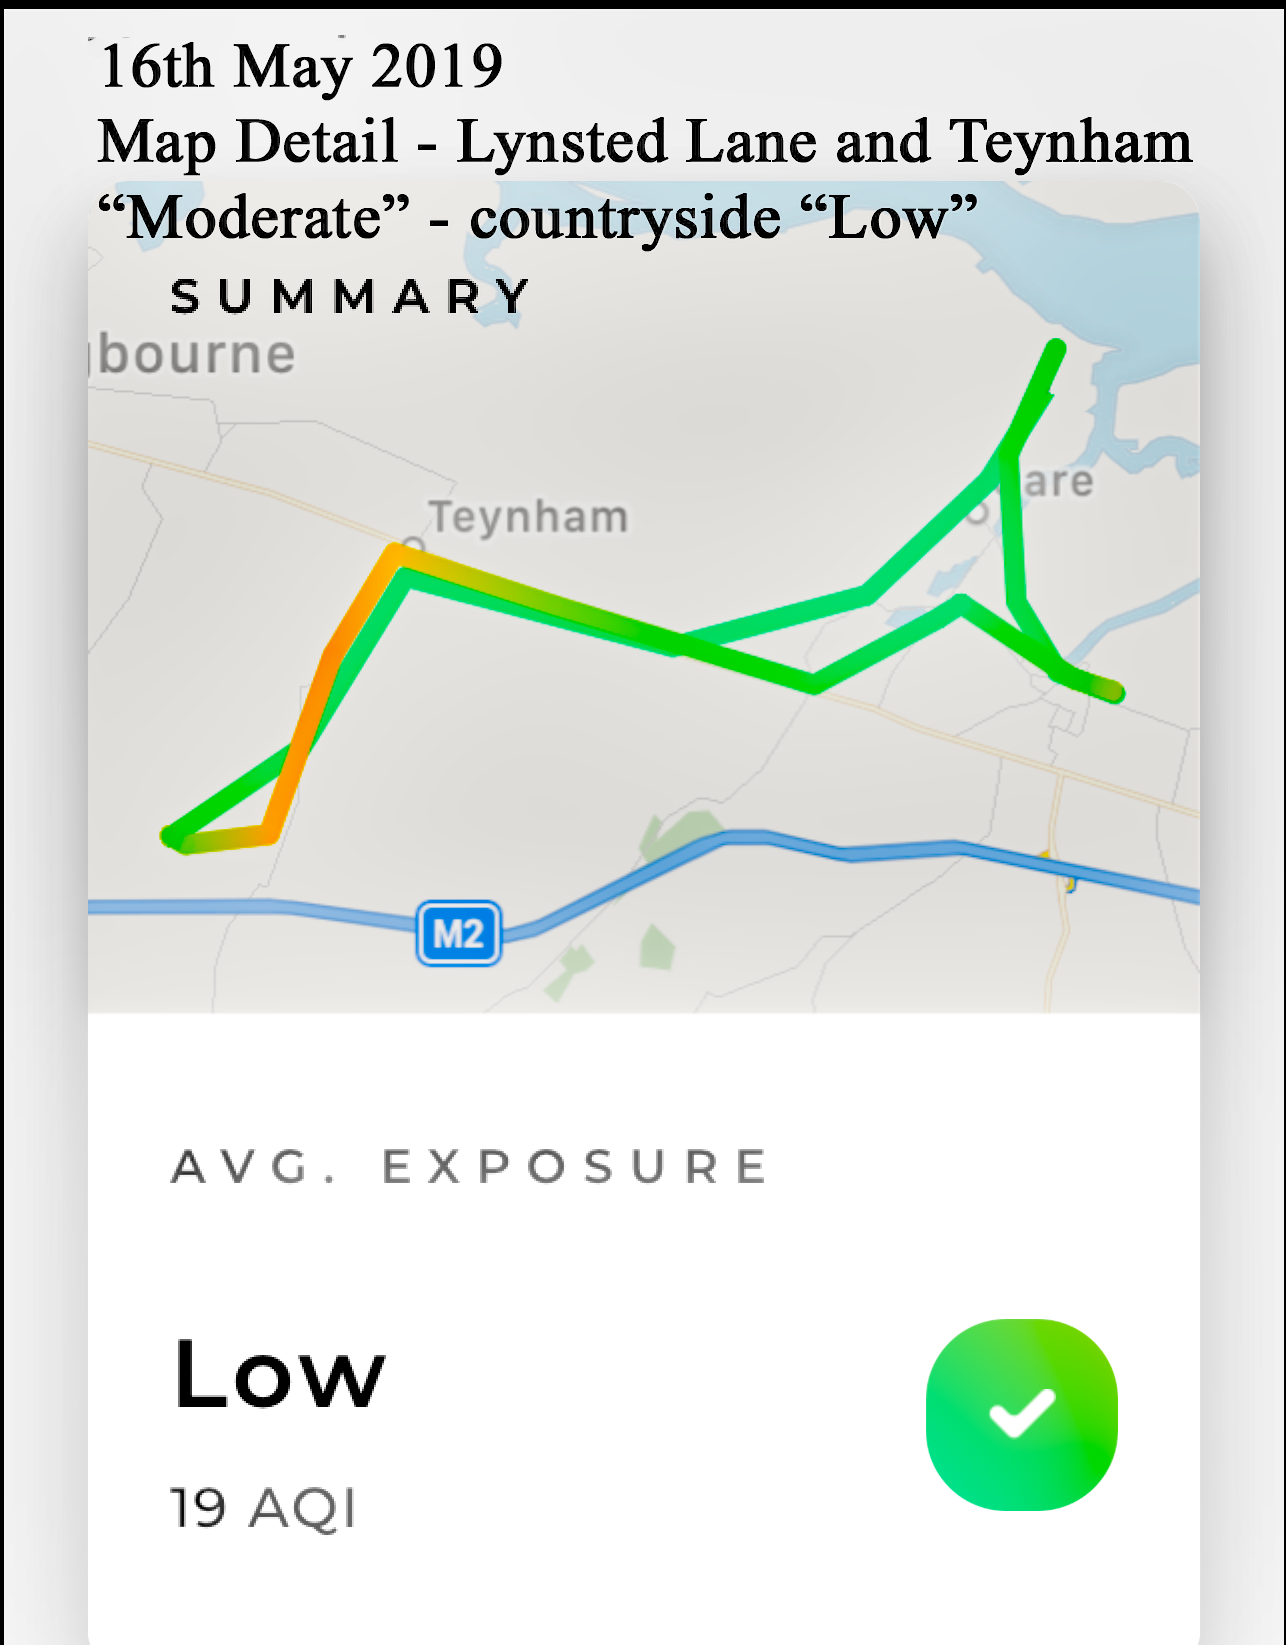
| 16 May Flow 1 Greenstreet Flow 2 Kingsdown |
14 6 |
29 |
7 4 |
15 14 |
MODERATE LOW |
Graph & Map: Wind: ENE - E - ENE - NE (18kph). Very light rain 0.1mm midday. Graph and Map: PM10 just under the threshold for "Moderate" - the Map shows concentrations on the A2. |
||
| 19 | ||||||||
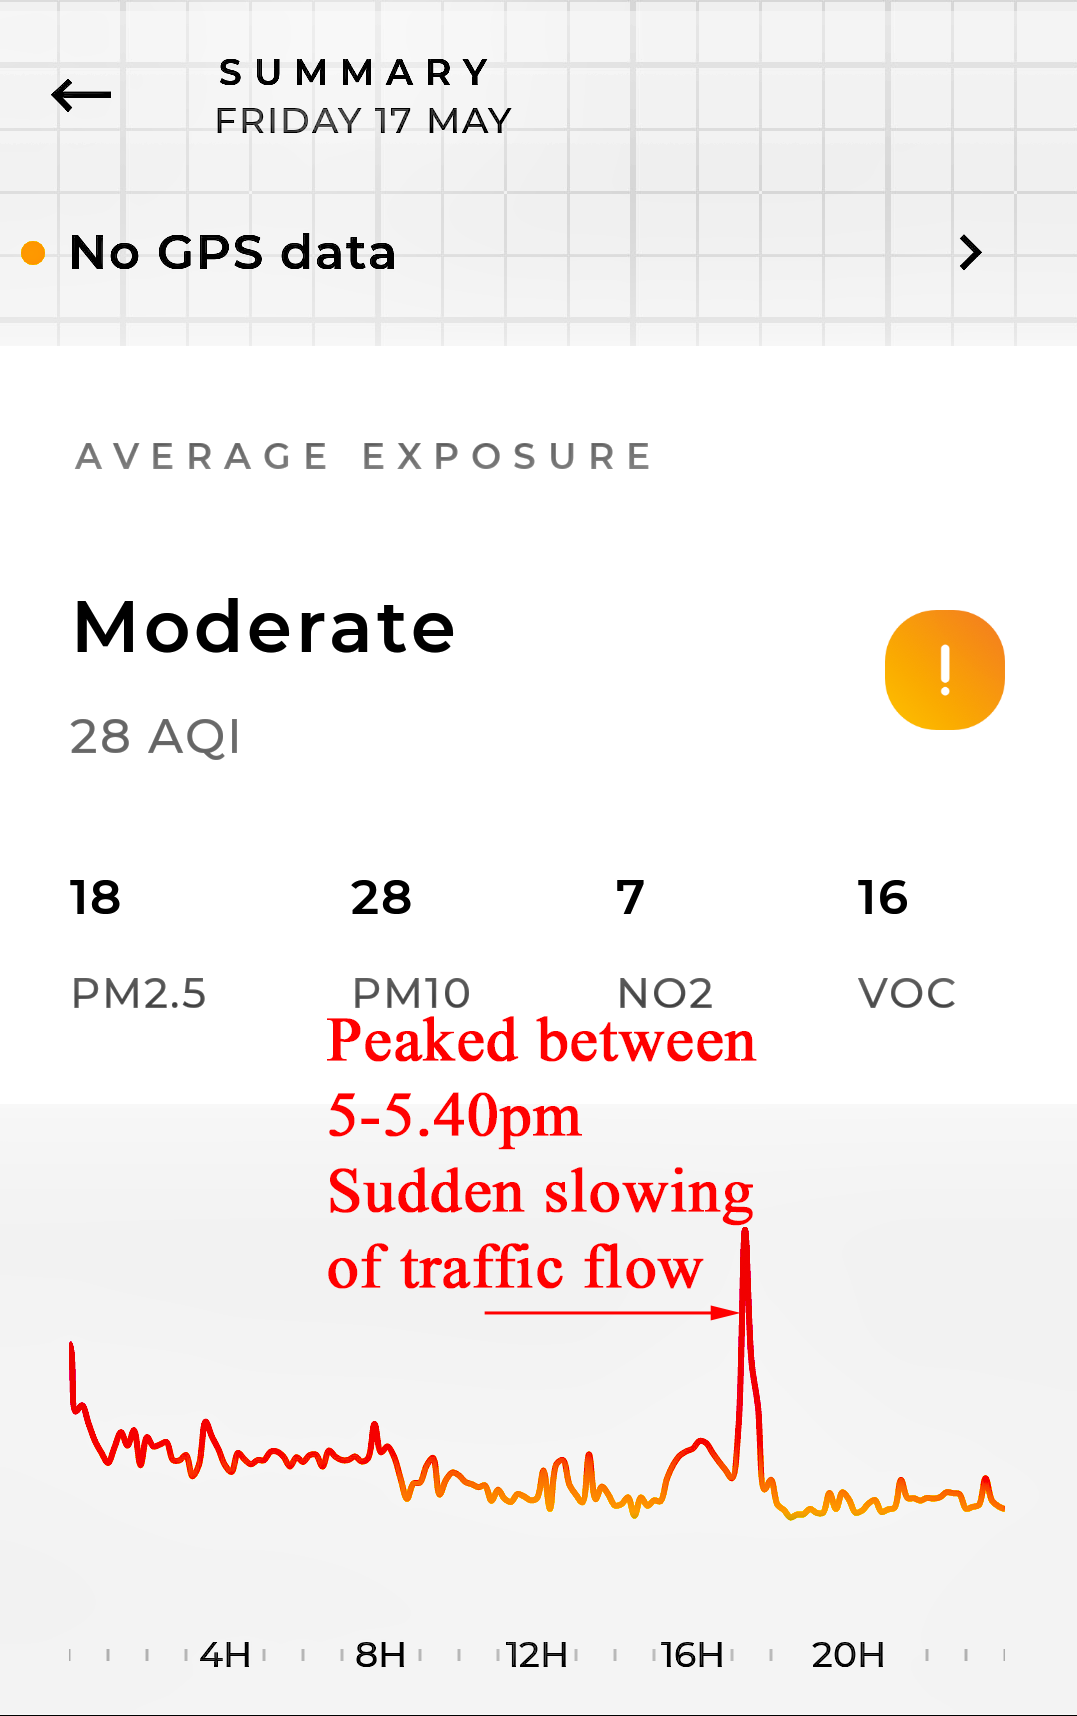
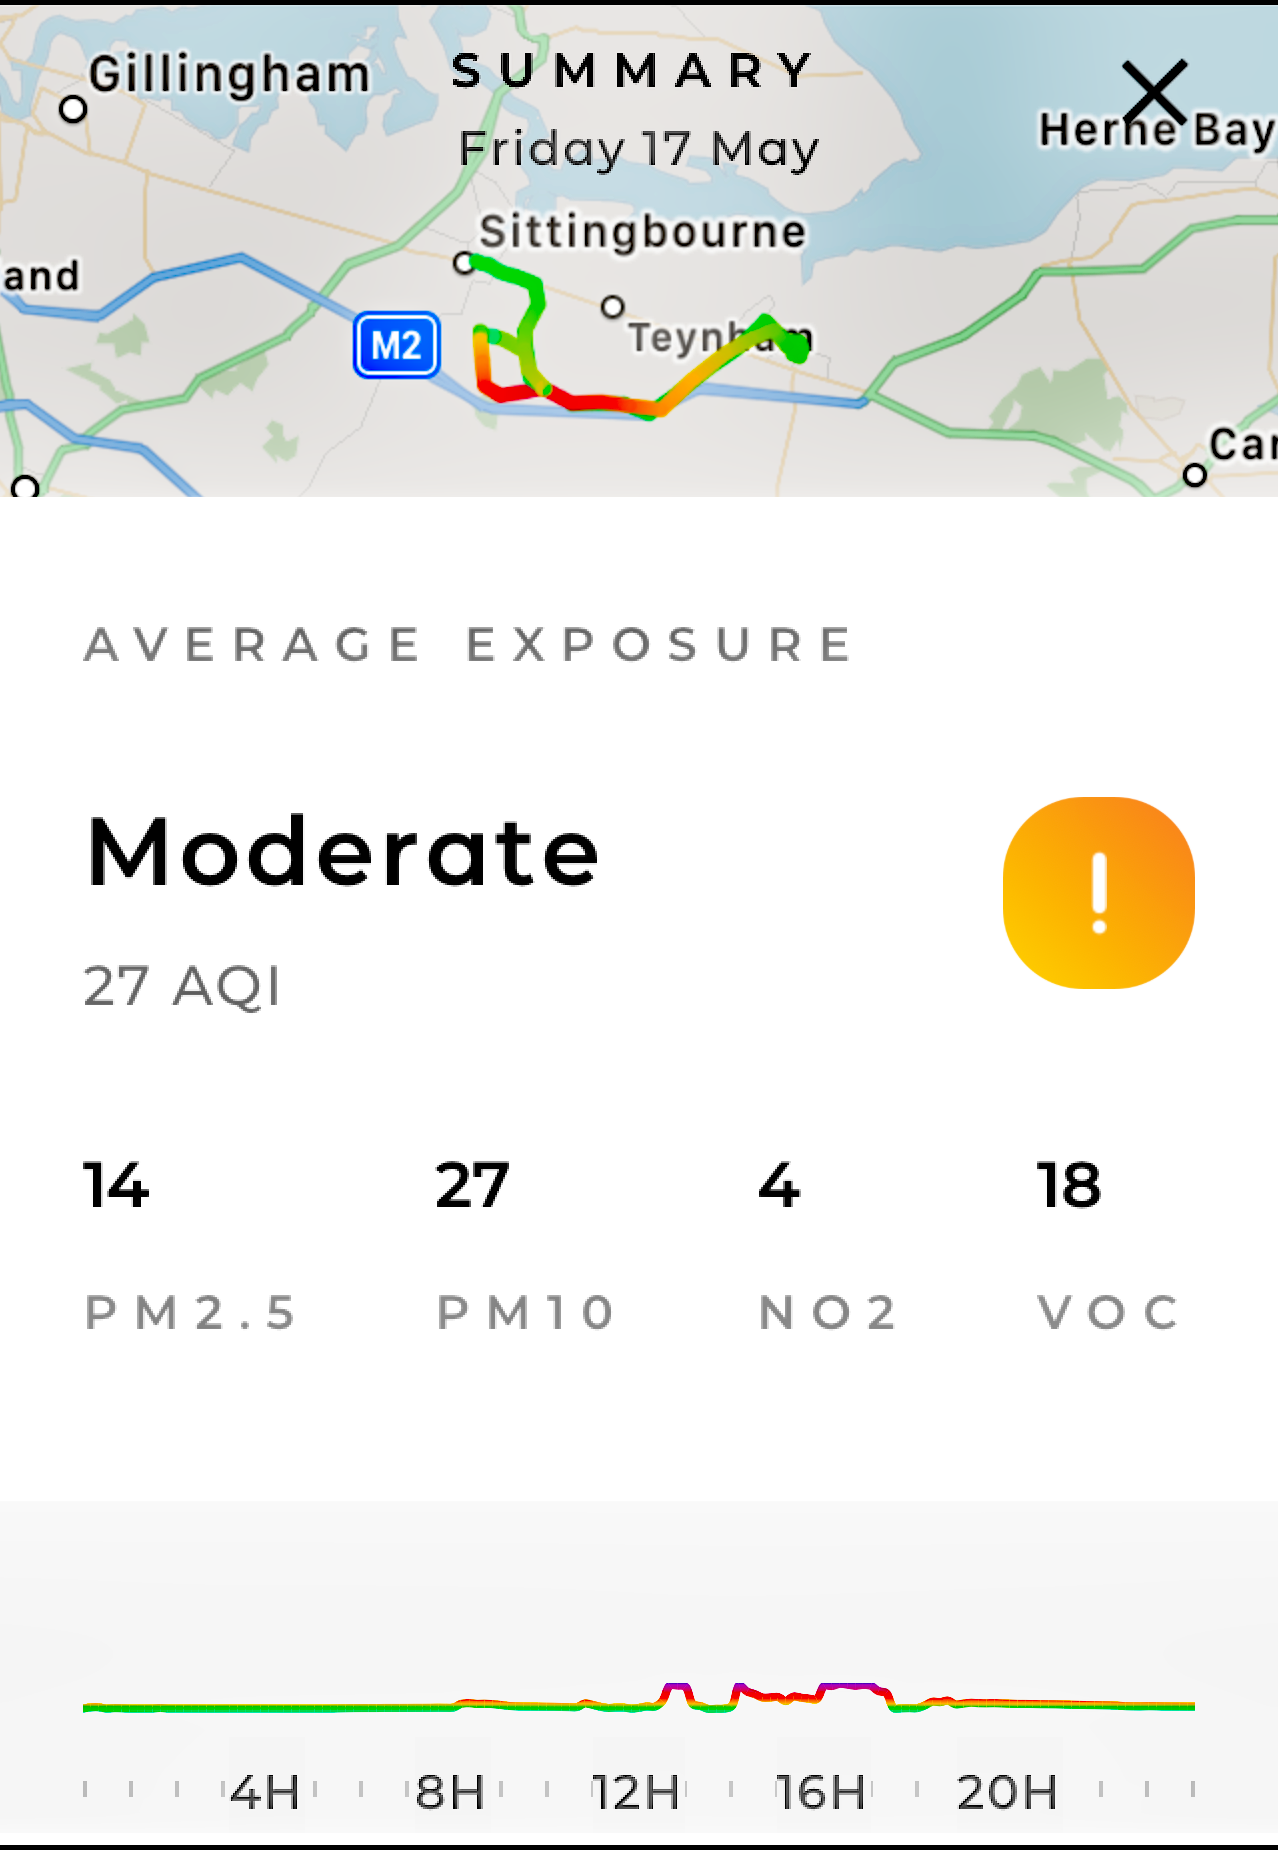
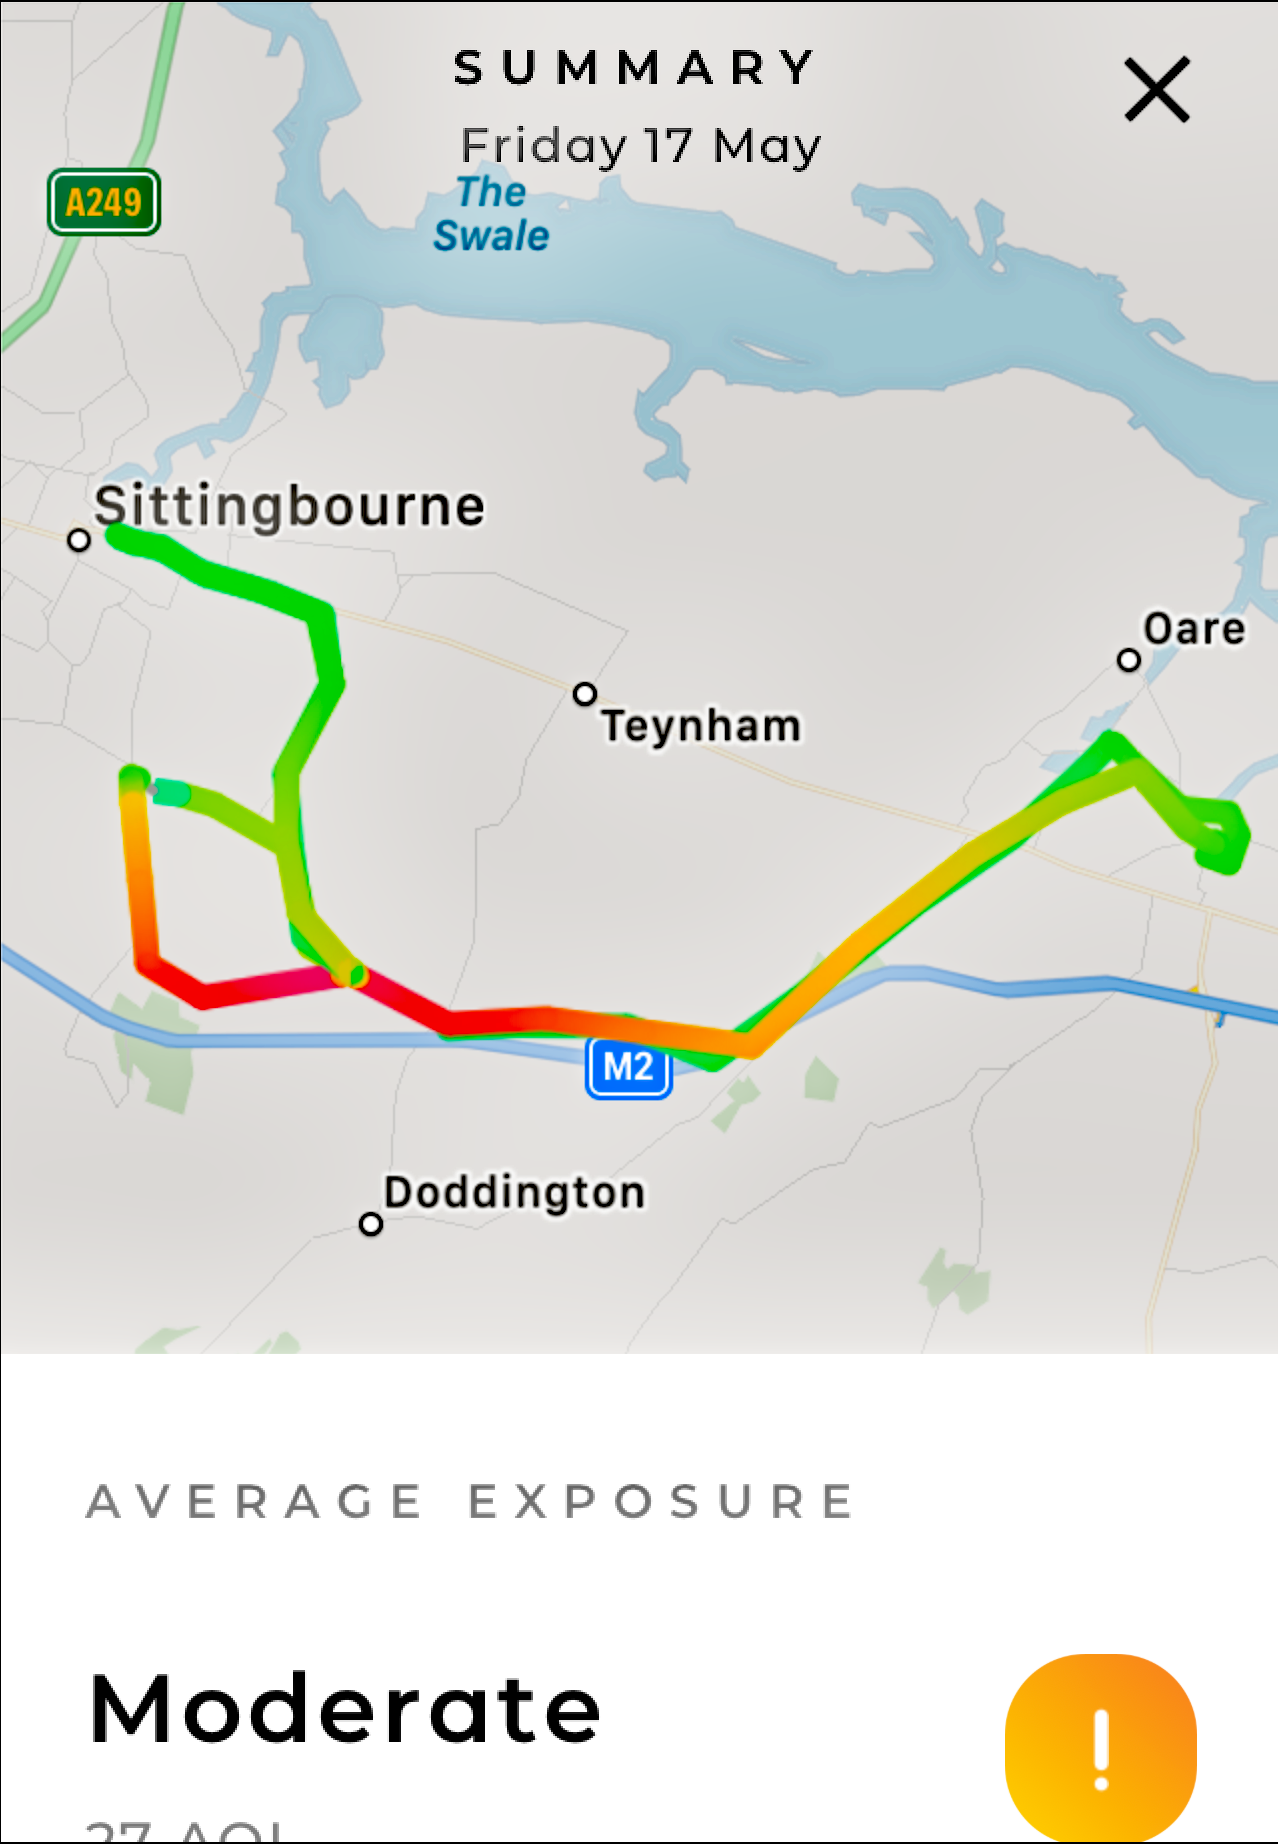
| 17 May Flow 1 Greenstreet Flow 2 Kingsdown |
18 14 |
28 27 |
7 4 |
16 18 |
MODERATE MODERATE |
Graph: Wind: NNE (17kph).
Rain: 1.70mm, occasional showers Graph & Map showing "High Pollution" along a rural lane alongside the M2. |
||
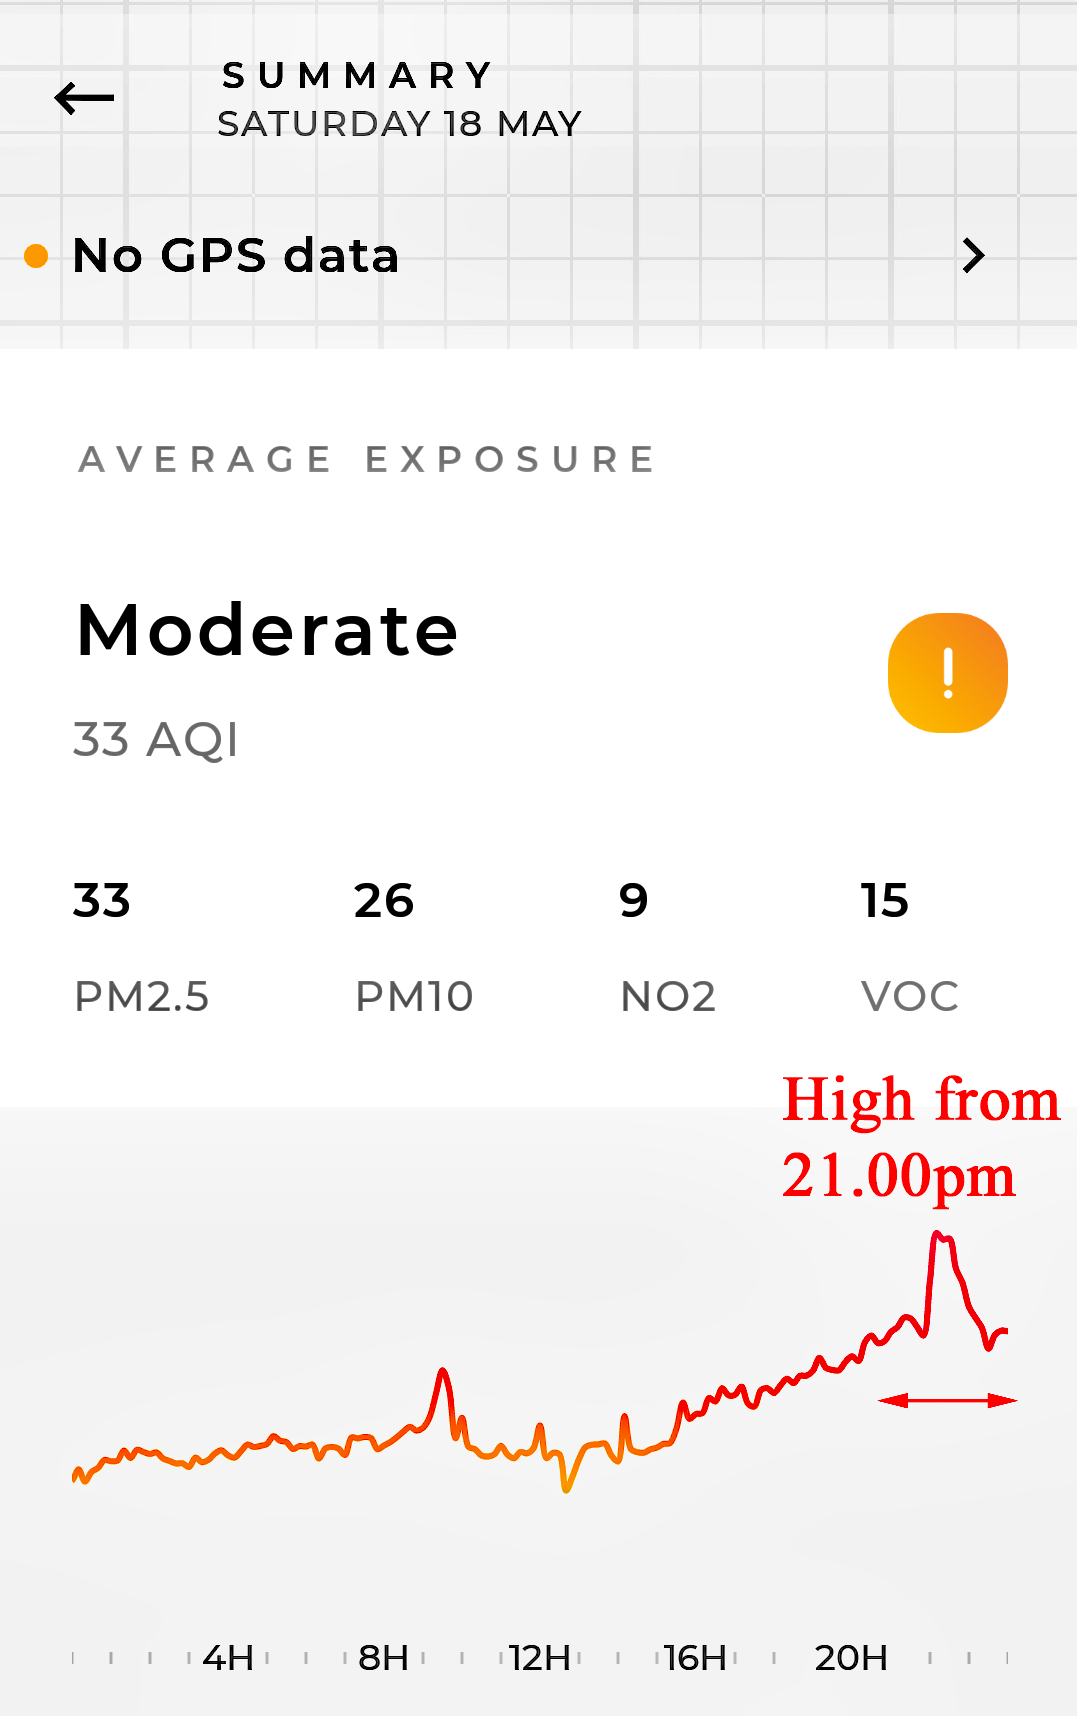
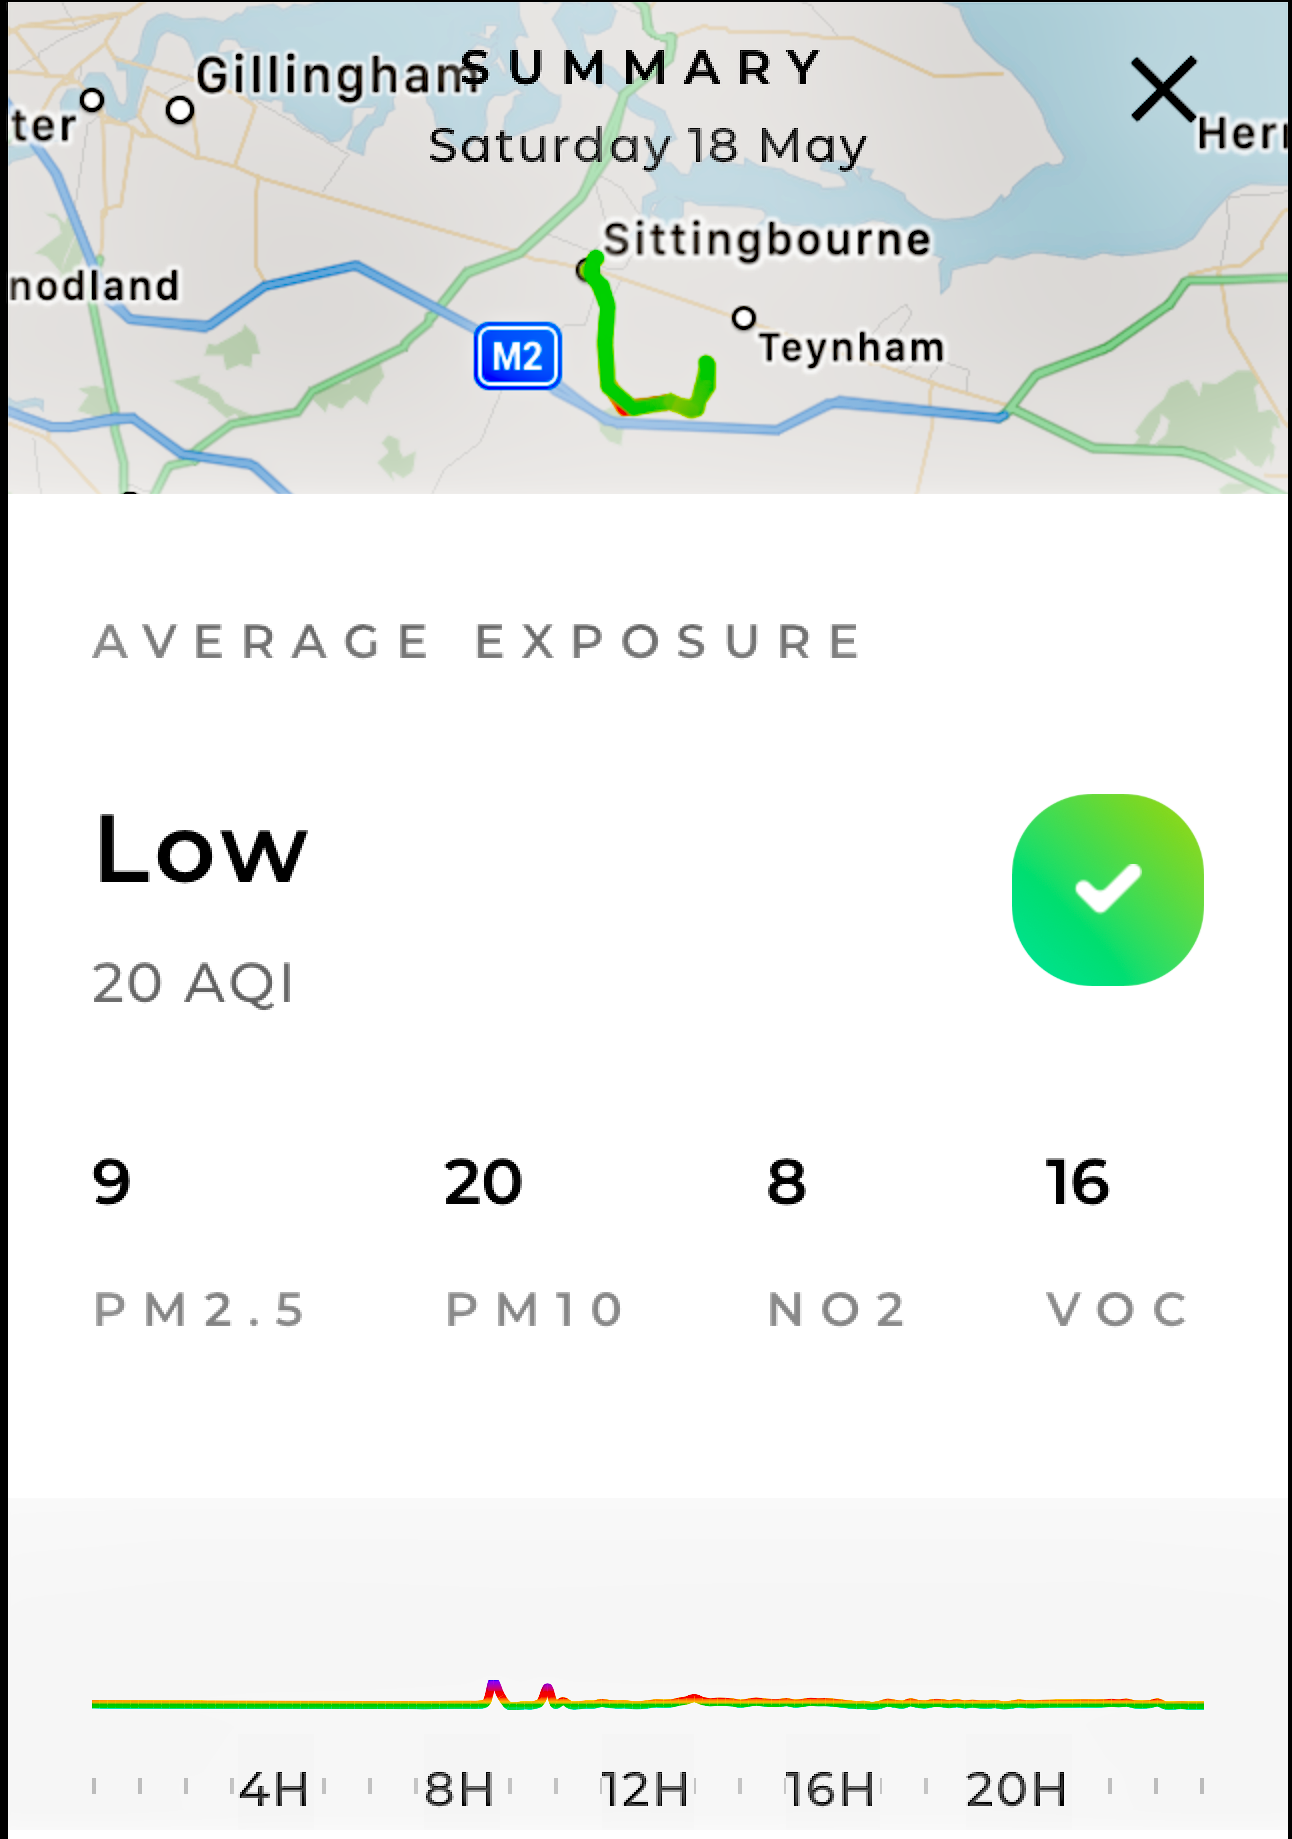
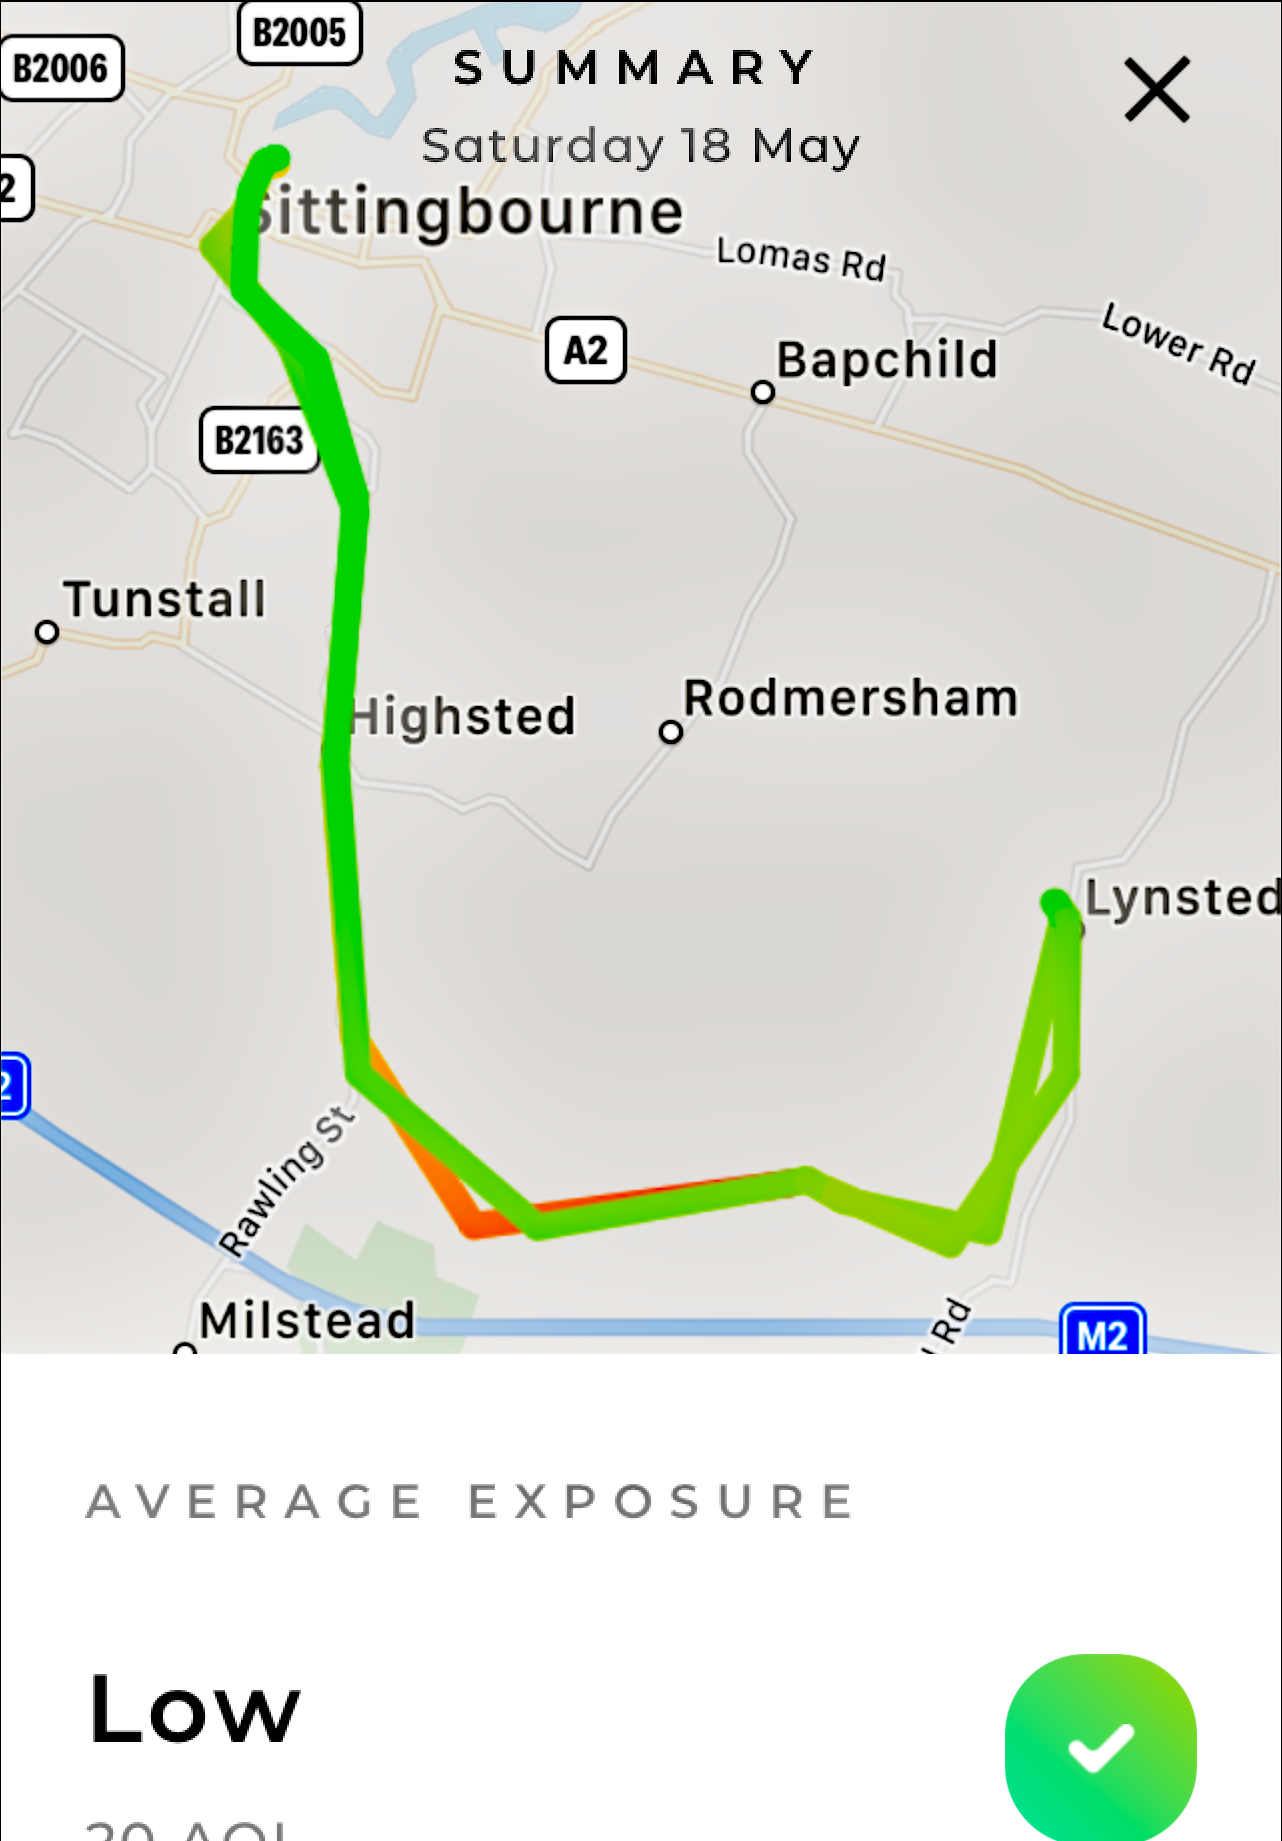
| 18 May Flow 1 Greenstreet Flow 2 Kingsdown |
33 |
26 |
9 |
15 |
MODERATE LOW |
Graph: High pollution from 9pm to 03.15am next morning. Wind: Veering N - NE - SE (7kph).
Rain: 1.10mm, occasional showers. Graph and Map contrast with 17th May lane alongside the M2. |
||
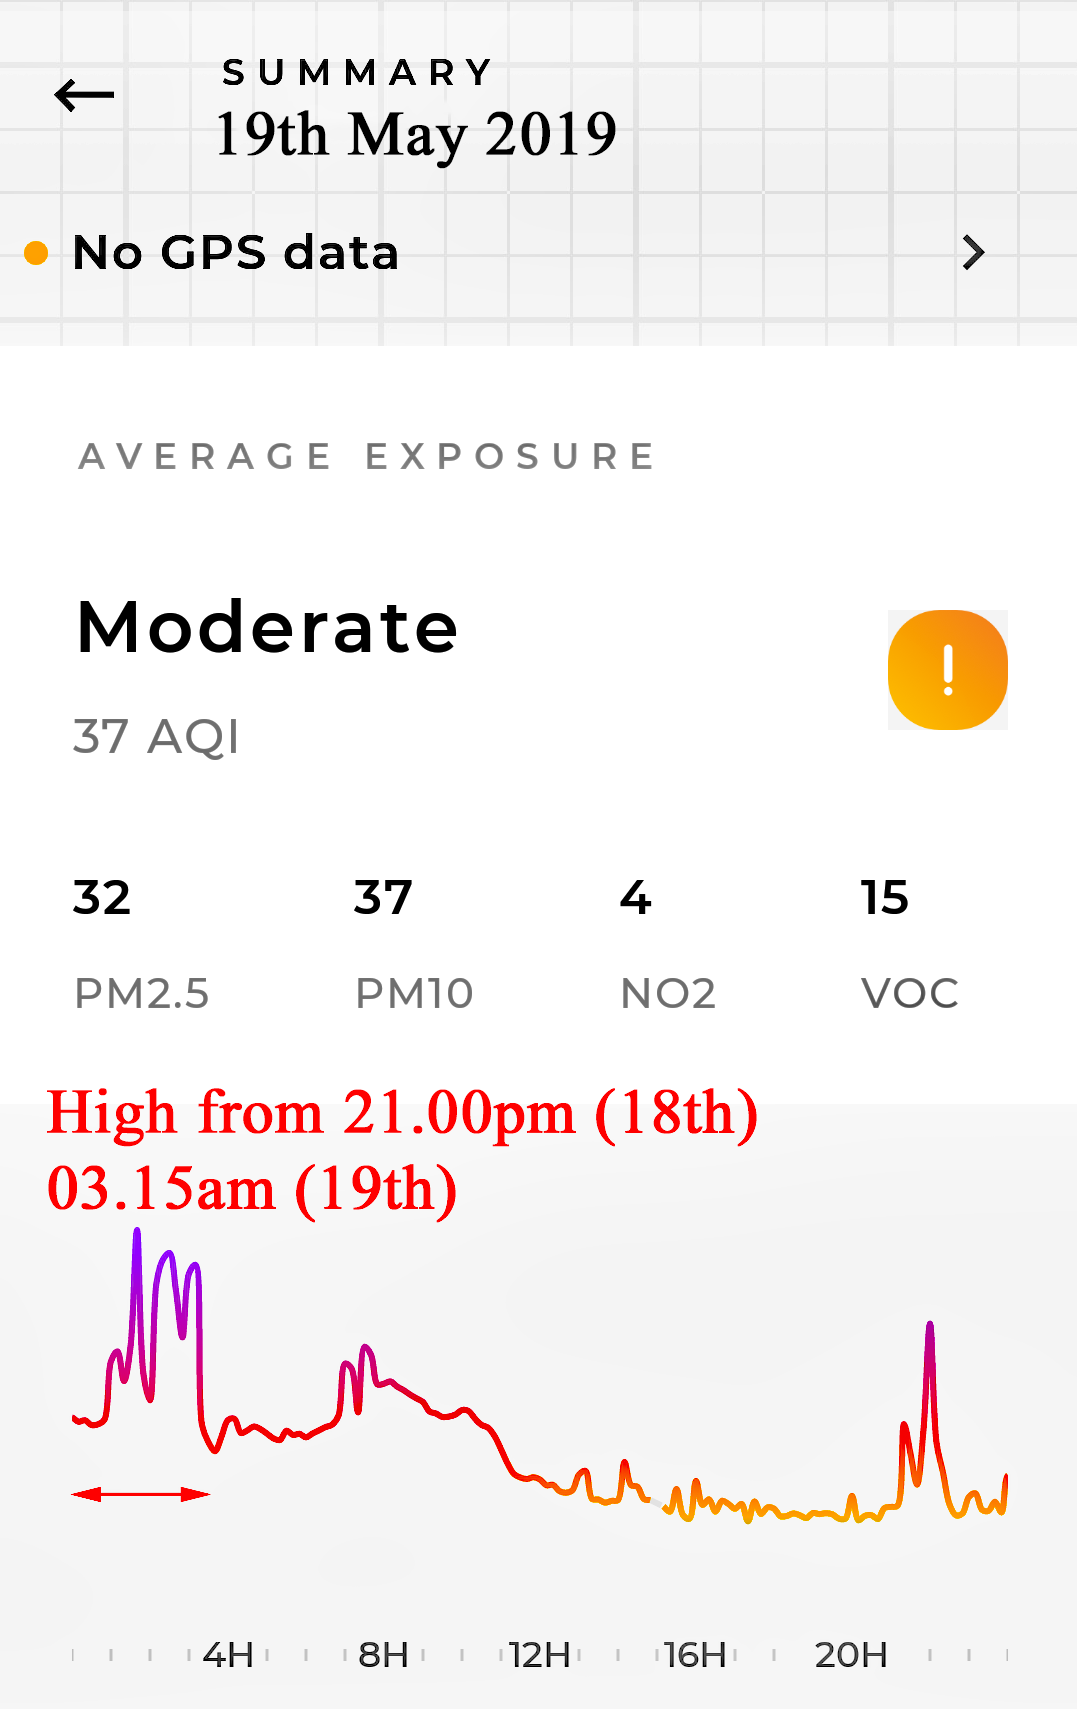
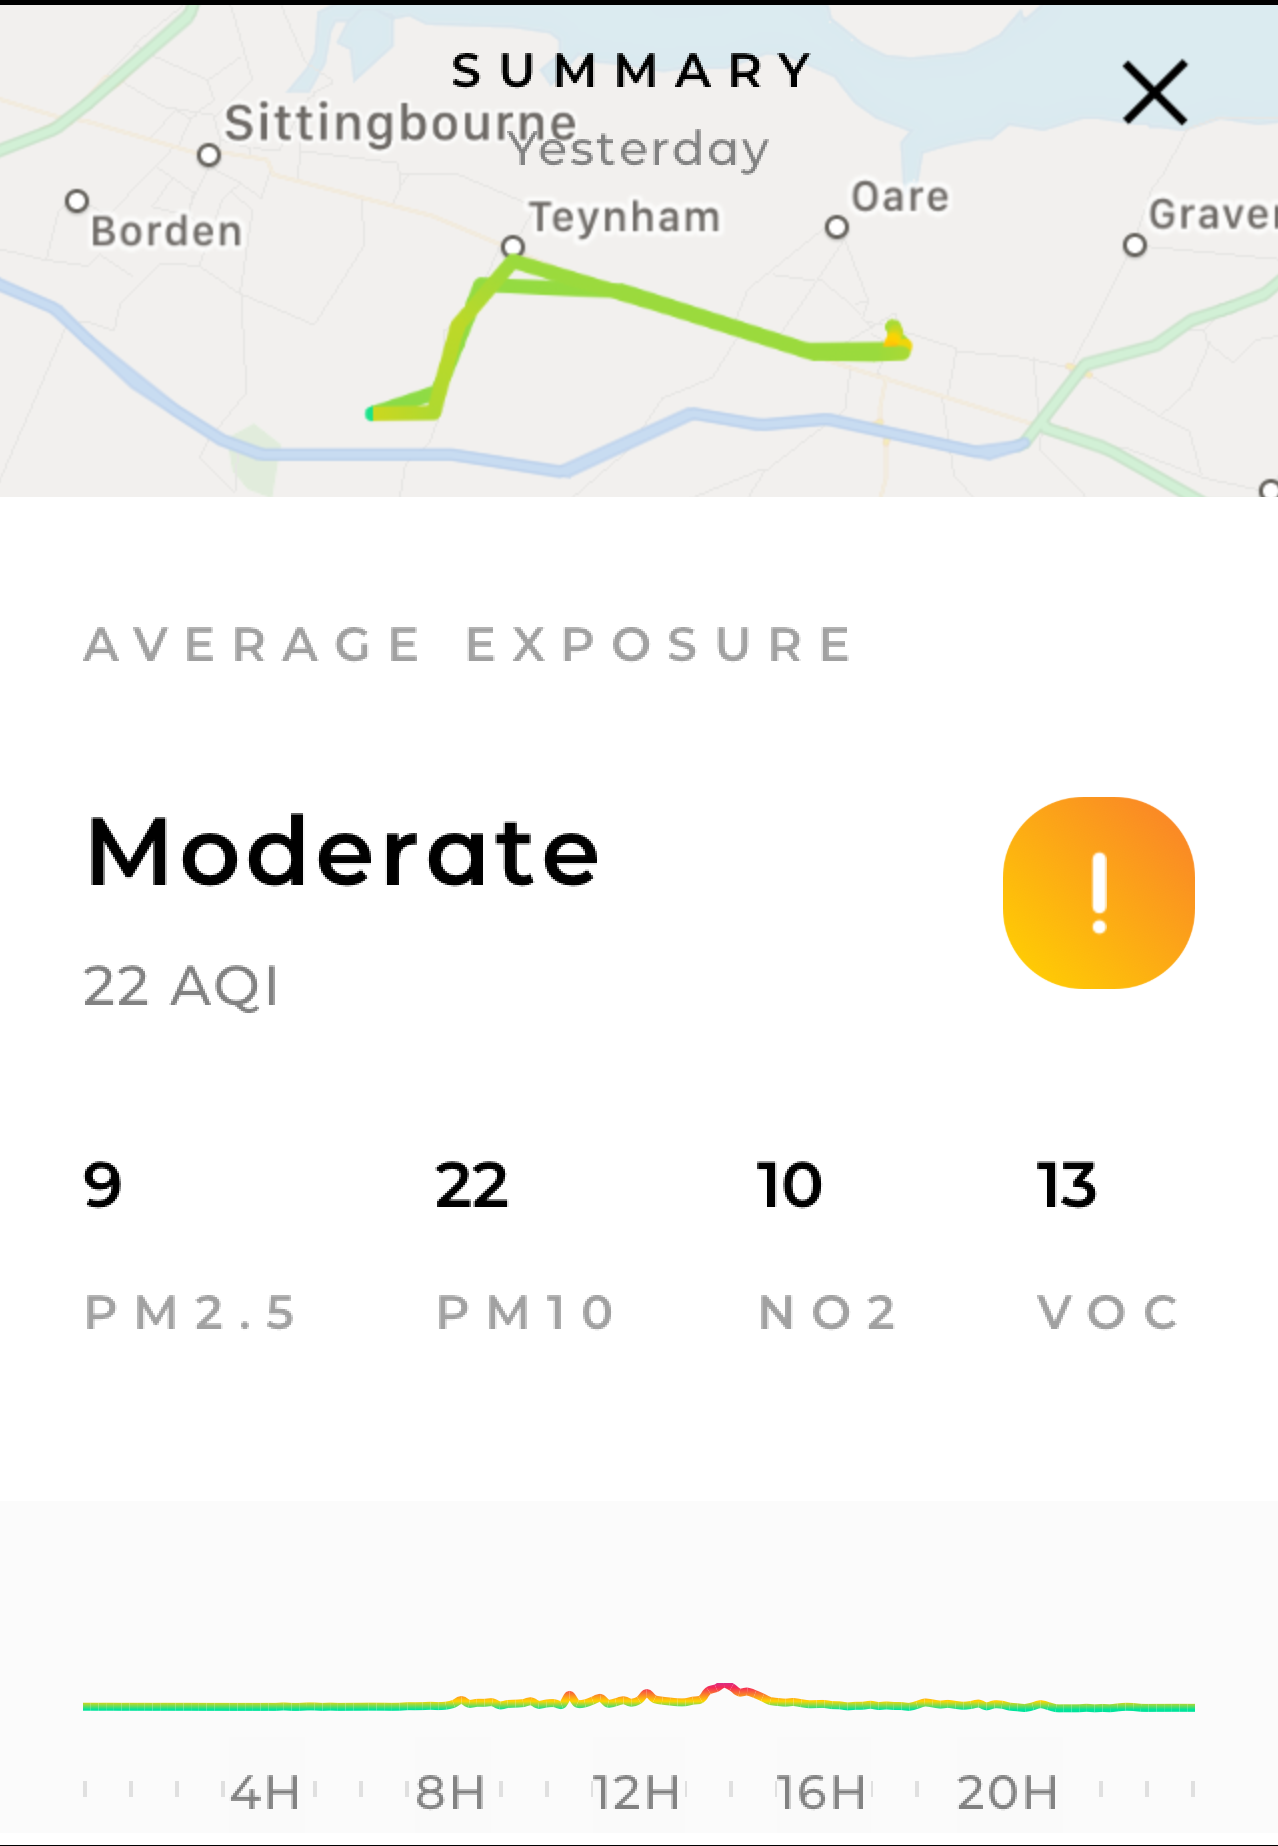
| 19 May Flow 1 Greenstreet Flow 2 Kingsdown |
32 9 |
37 |
4 10 |
15 13 |
MODERATE MODERATE |
Graph: Wind: E - NE - E (9kph).
Rain: dry Graph: Flow 2: The Higher figures in the graph correspond with a stop in Faversham during the Vintage Car event. No surprise there was more pollution! |
||
| 22 | ||||||||
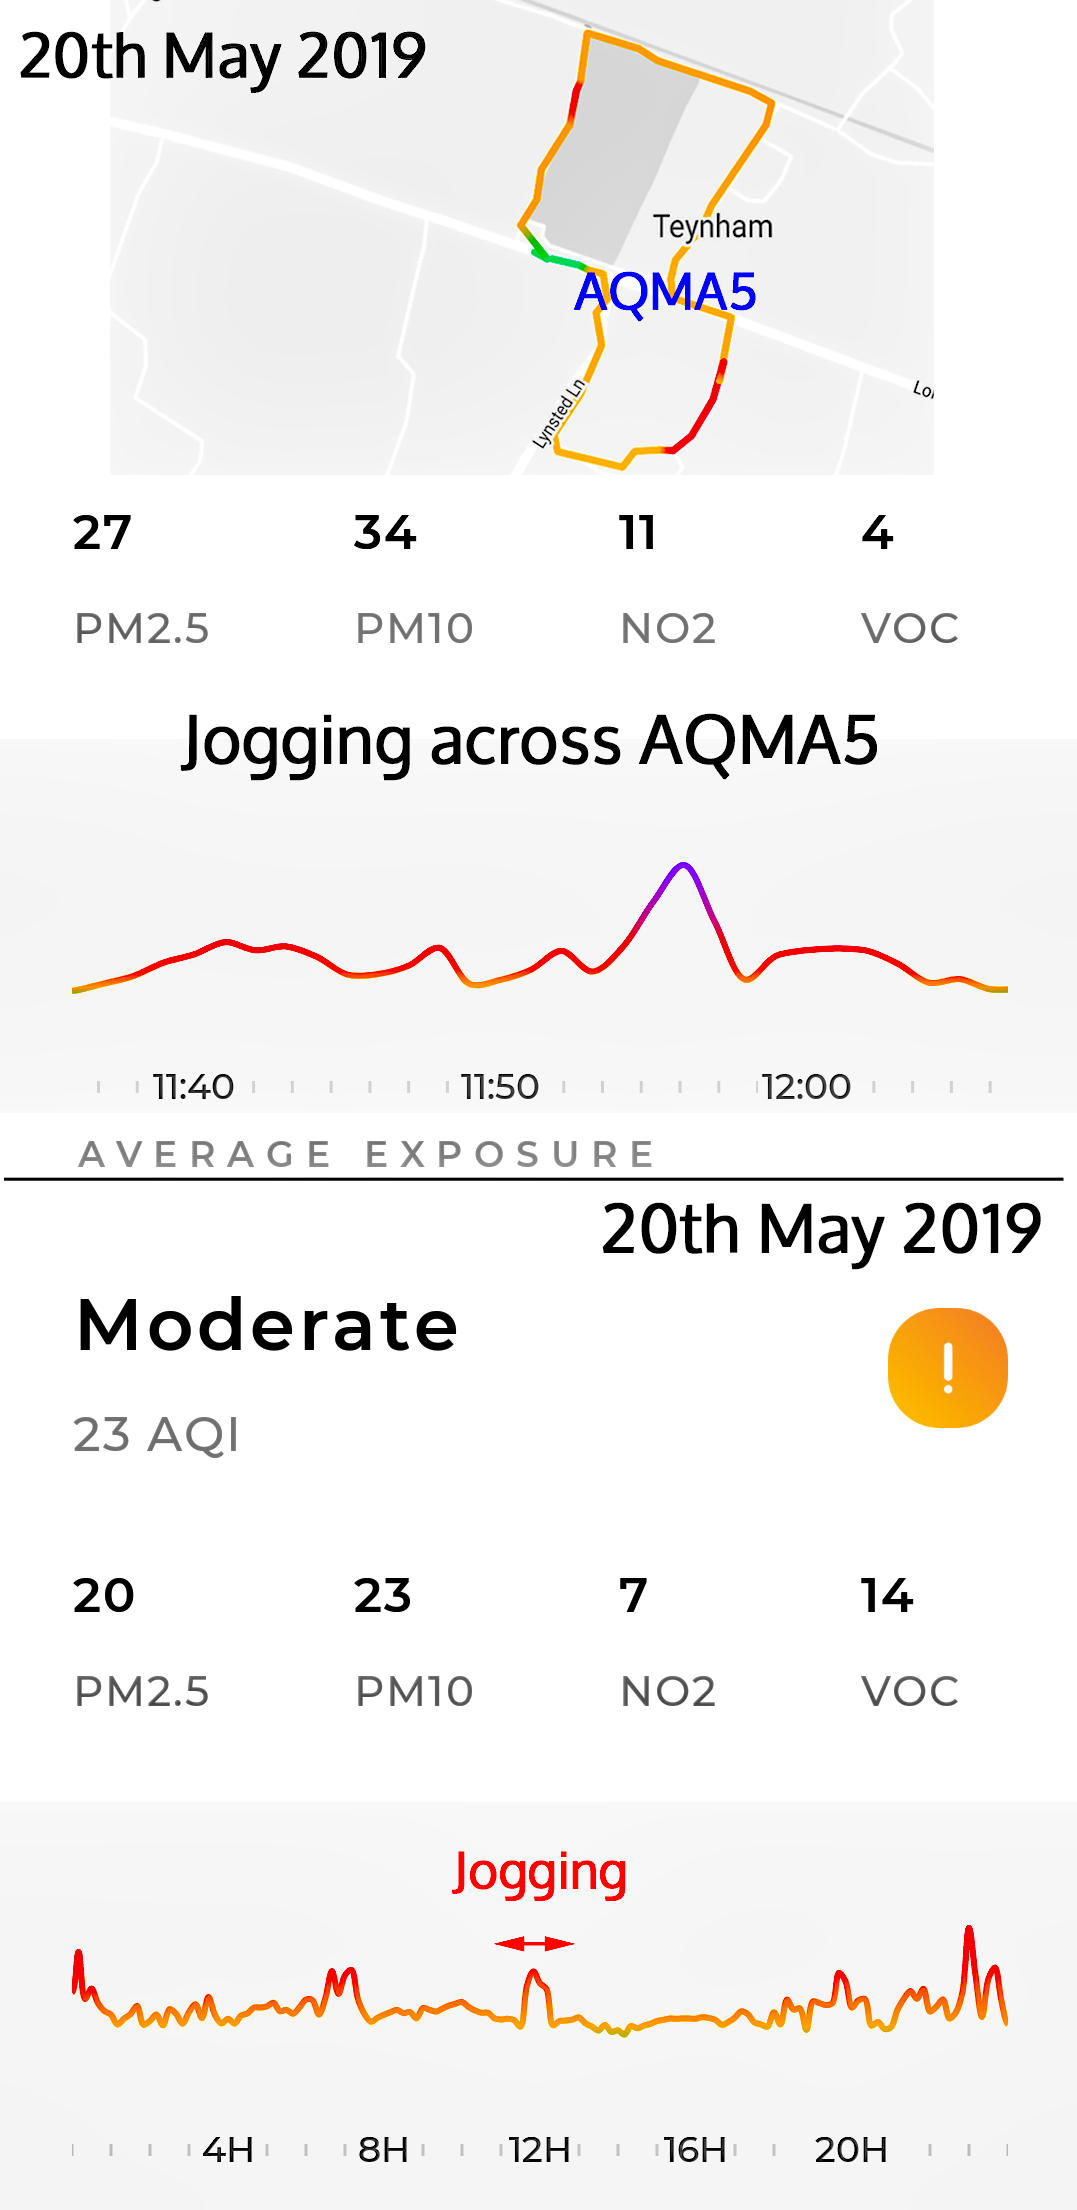
| 20 May Flow 1 Greenstreet Flow 2 Kingdown |
20 |
23 |
7 |
14 |
MODERATE |
Graph and Map: Wind E - N - E (7kph). Rain 0.8mm. The map again reveals pollution north and south of AQMA5. | ||
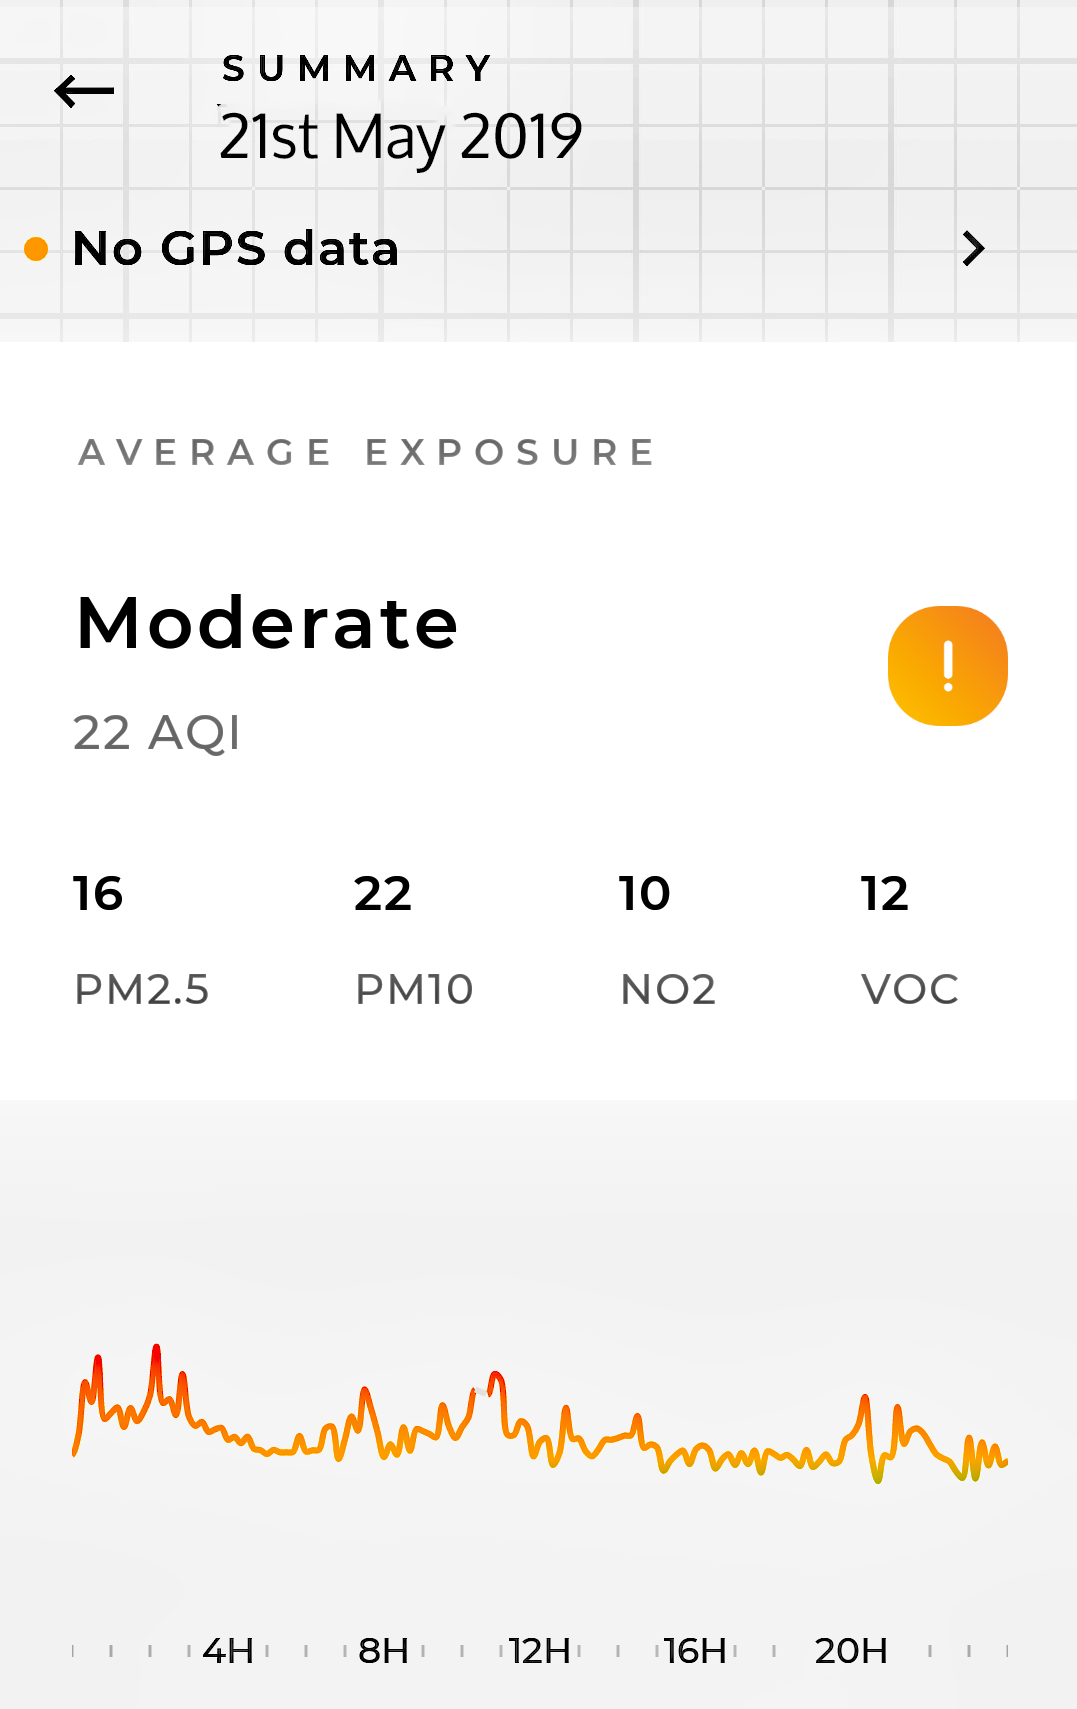
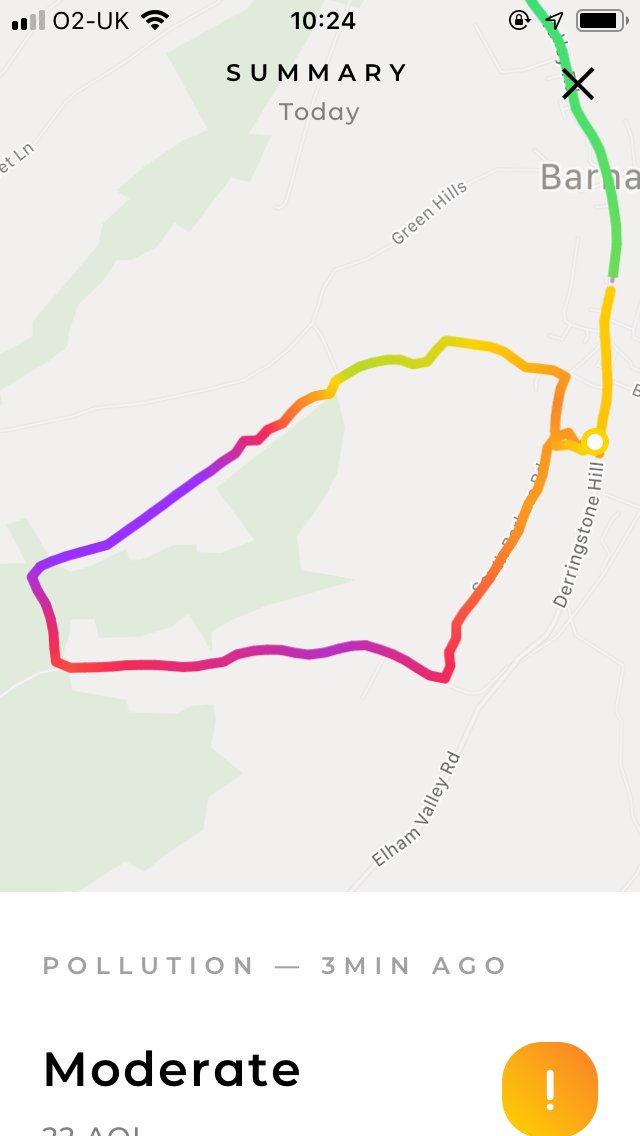
| 21 May Flow 1 Greenstreet Flow 2 Kingsdown |
16 - |
22 - |
10 - |
12 - |
MODERATE |
Graph: Wind: NW - NNW (11kph). Rain 0.60mm (overnight). Steady pollution with some 'dips' into "Low". But not quite there yet! Map of Barham - Flow 2. Very rural but high pollution - suggesting agricultural spraying nearby. |
||
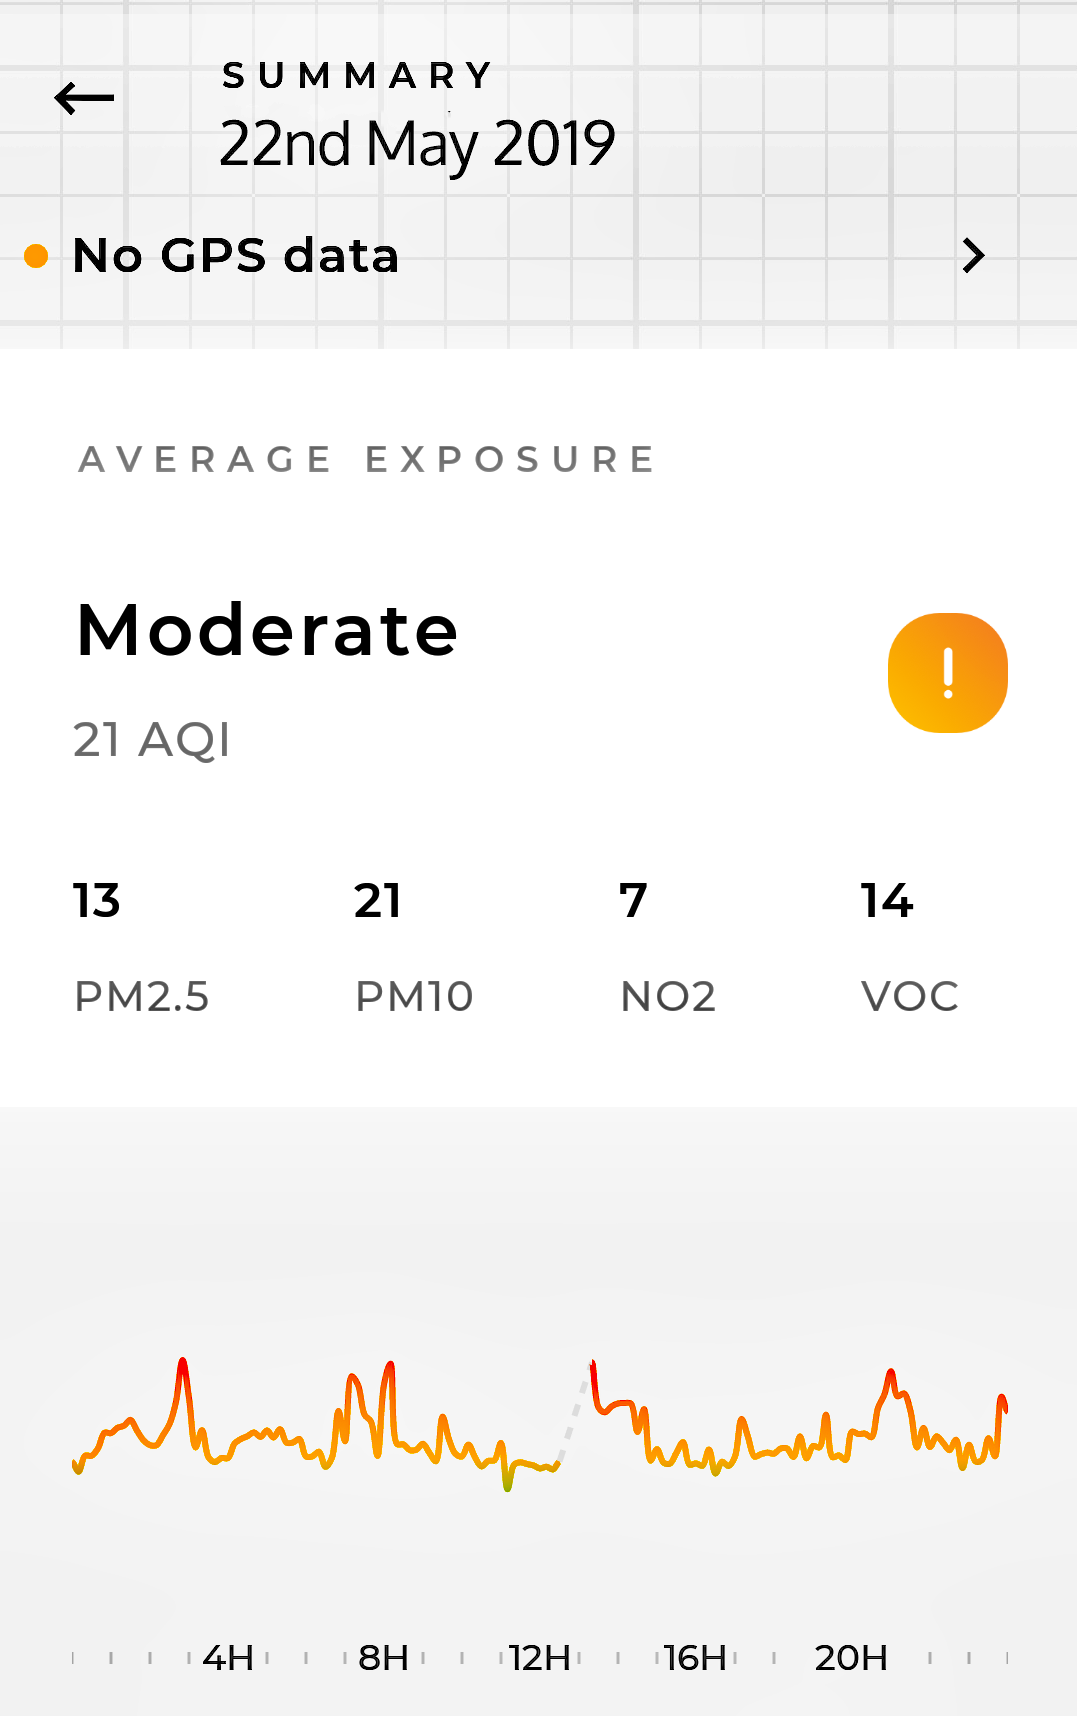
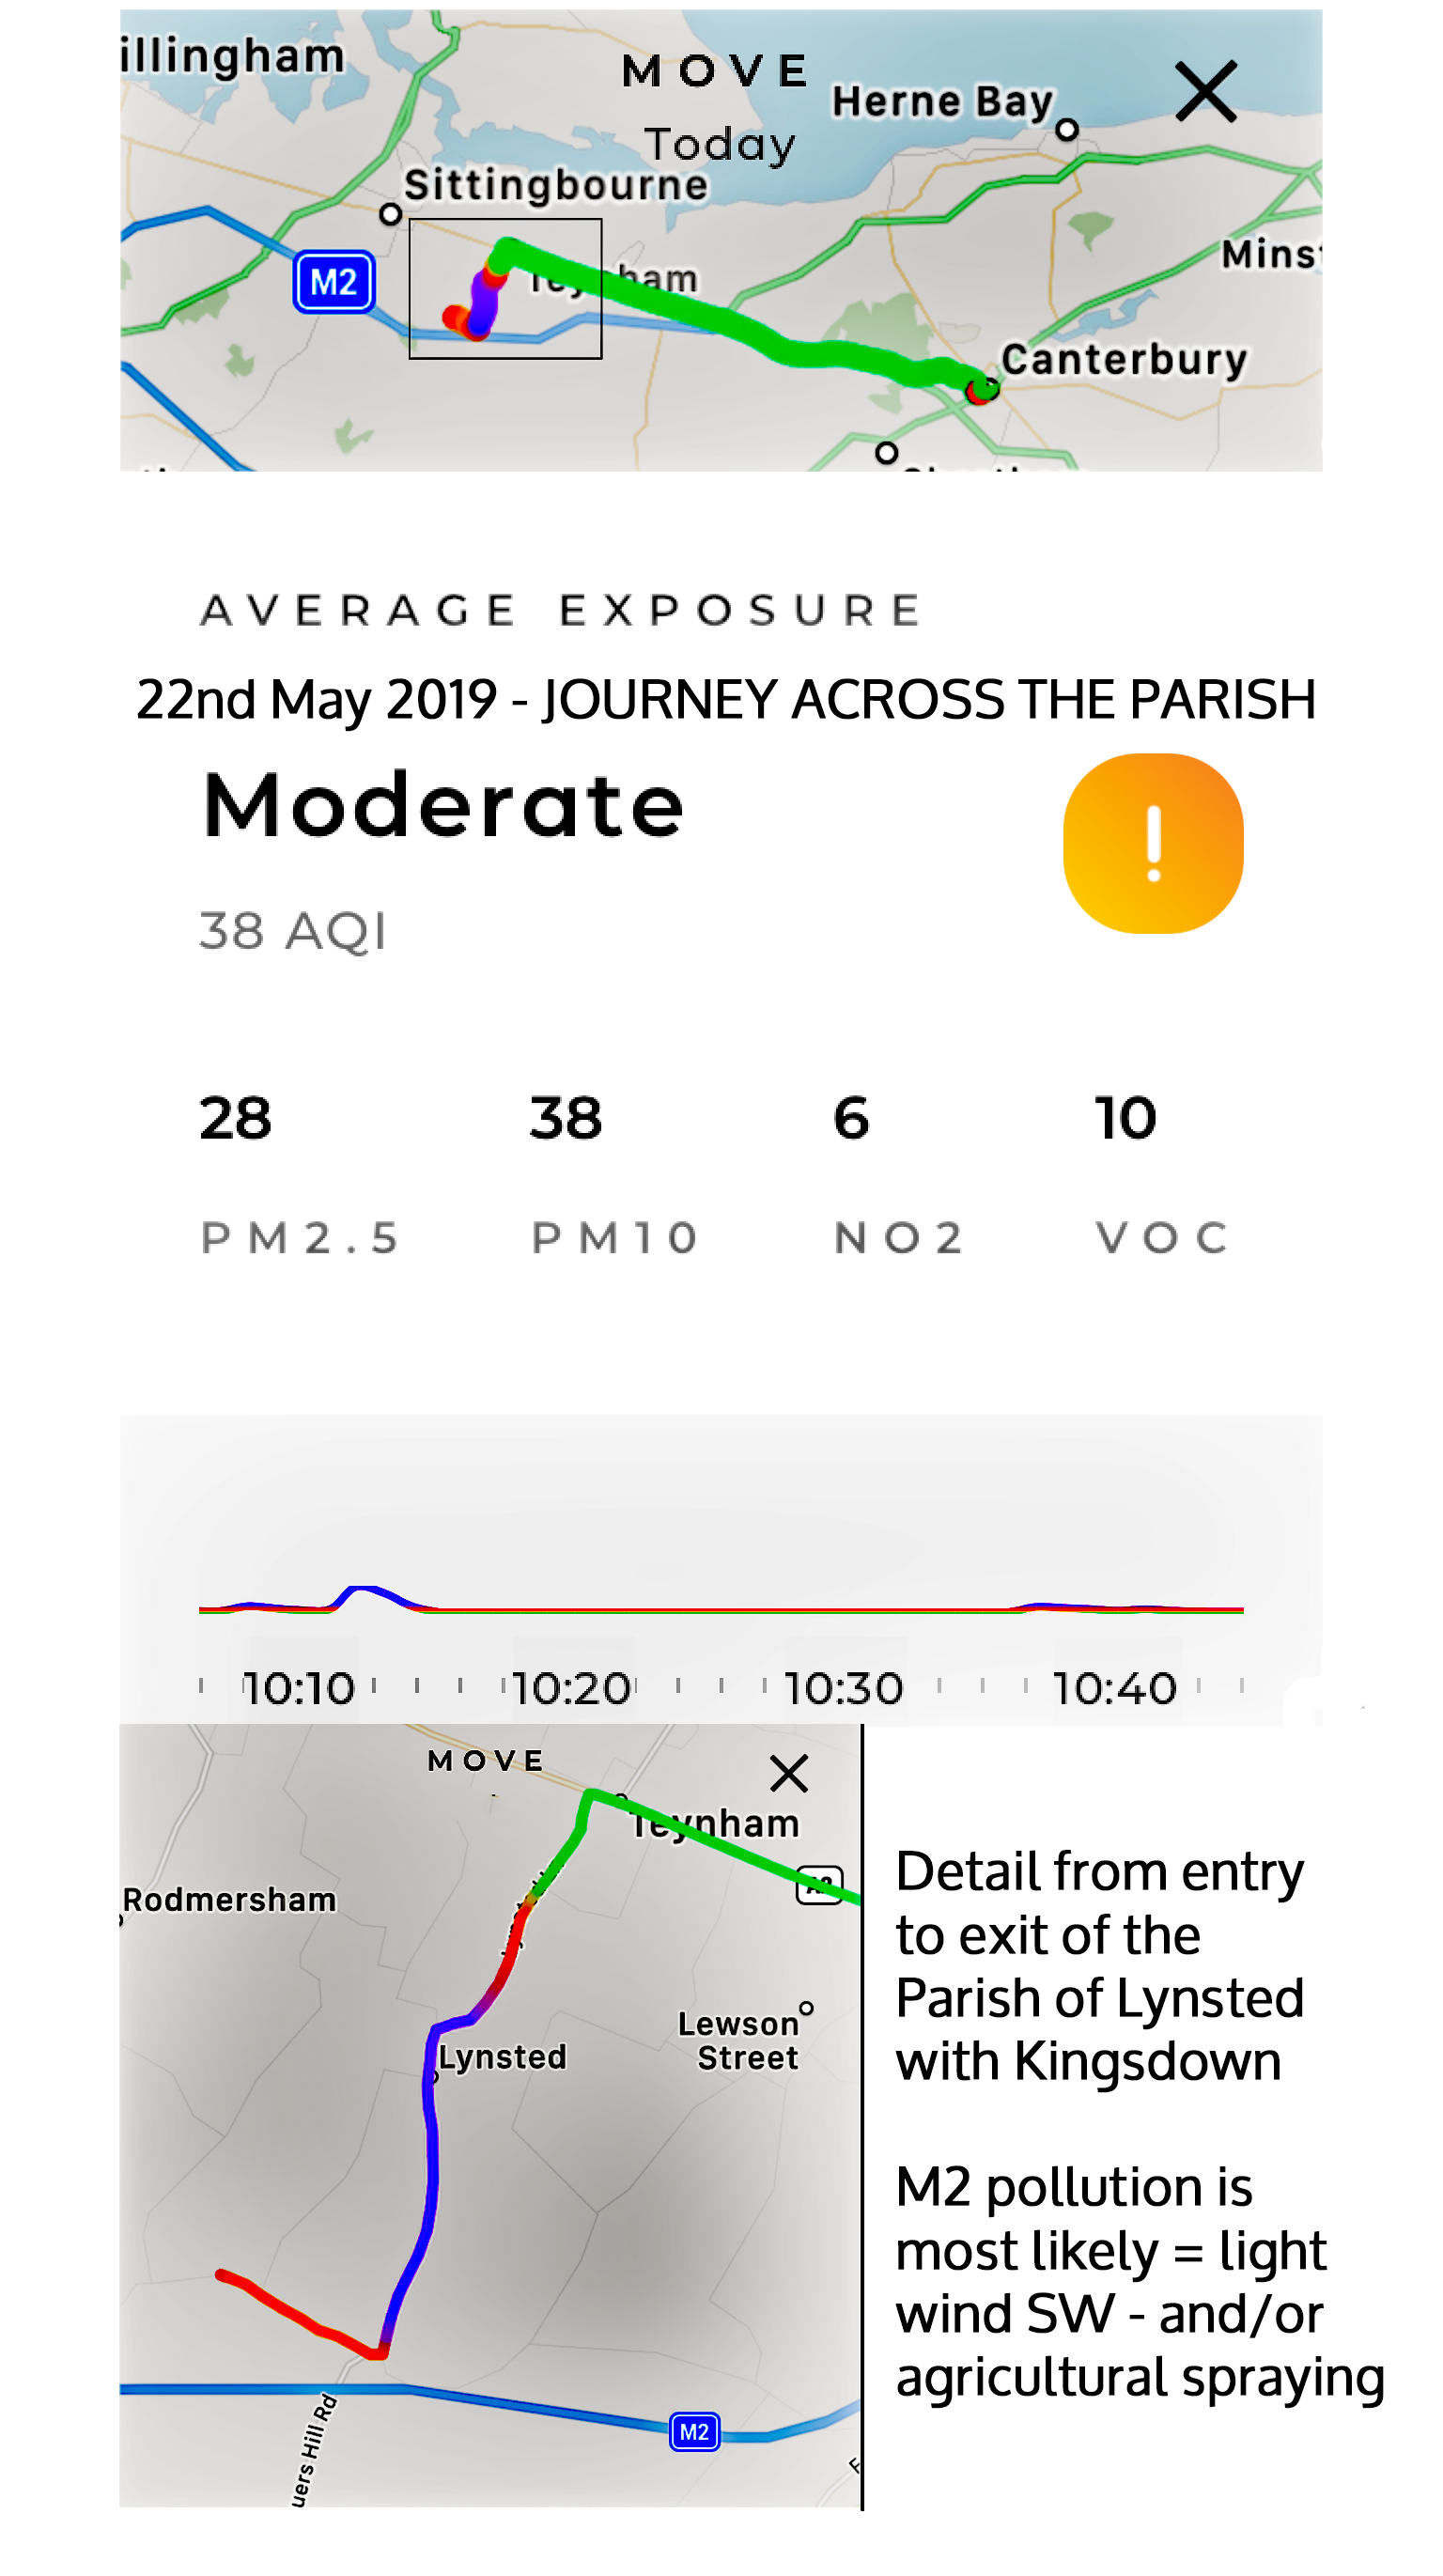
| 22 May Flow 1 Greenstreet Flow 2 Kingsdown to A2 Map |
13 28 |
21 |
7 6 |
14 10 |
MODERATE |
Graph: Wind: NW - S - SW (11kph). Rain 0.30 (overnight). Steady levels & peaks in 'usual places' - 2-3am (lorries), morning and evening rush hours and lunchtime. Flow 2 Map: High pollution from the M2 through Lynsted Village. The wind had veered bringing a concentrated pollution event. |
||
| 38 | ||||||||
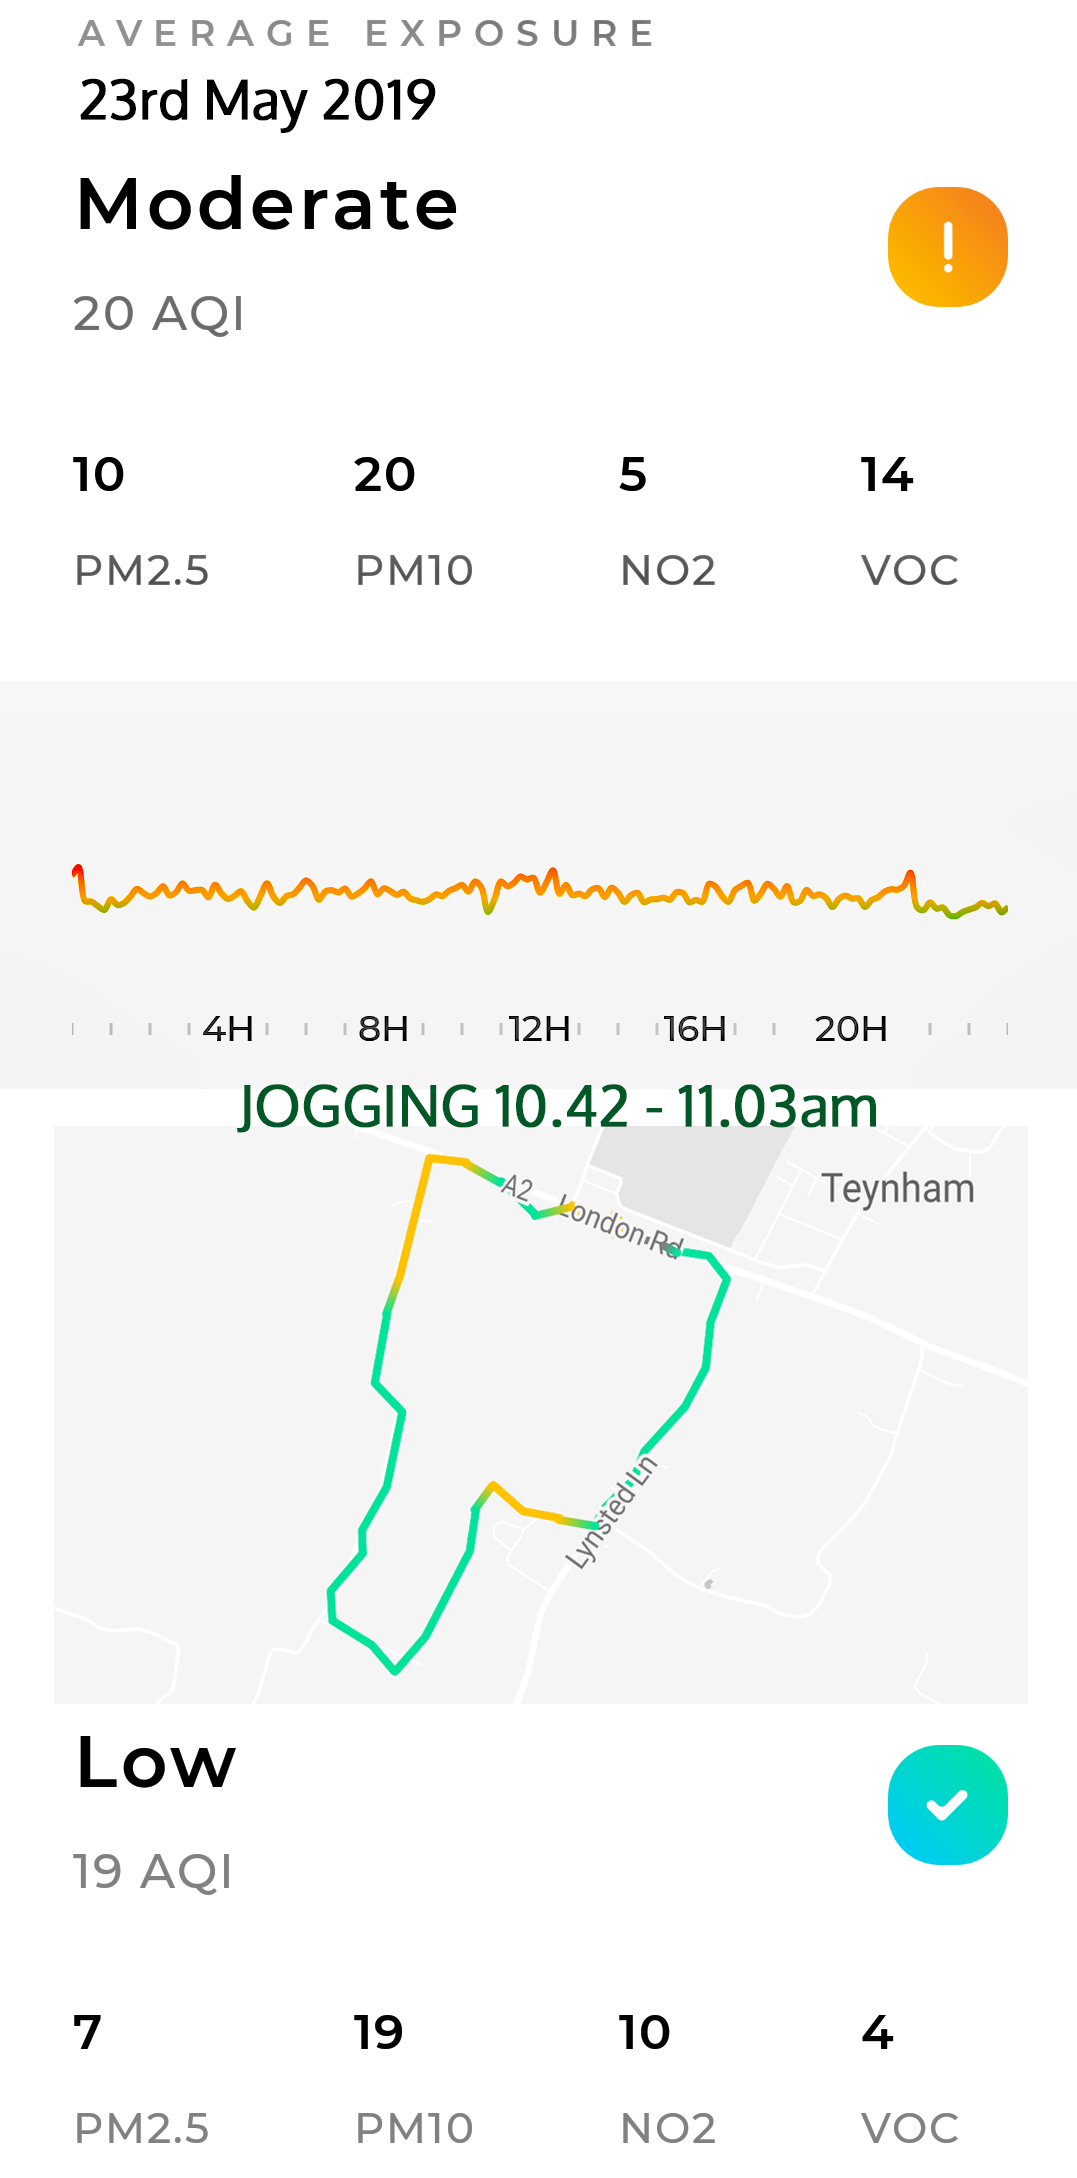
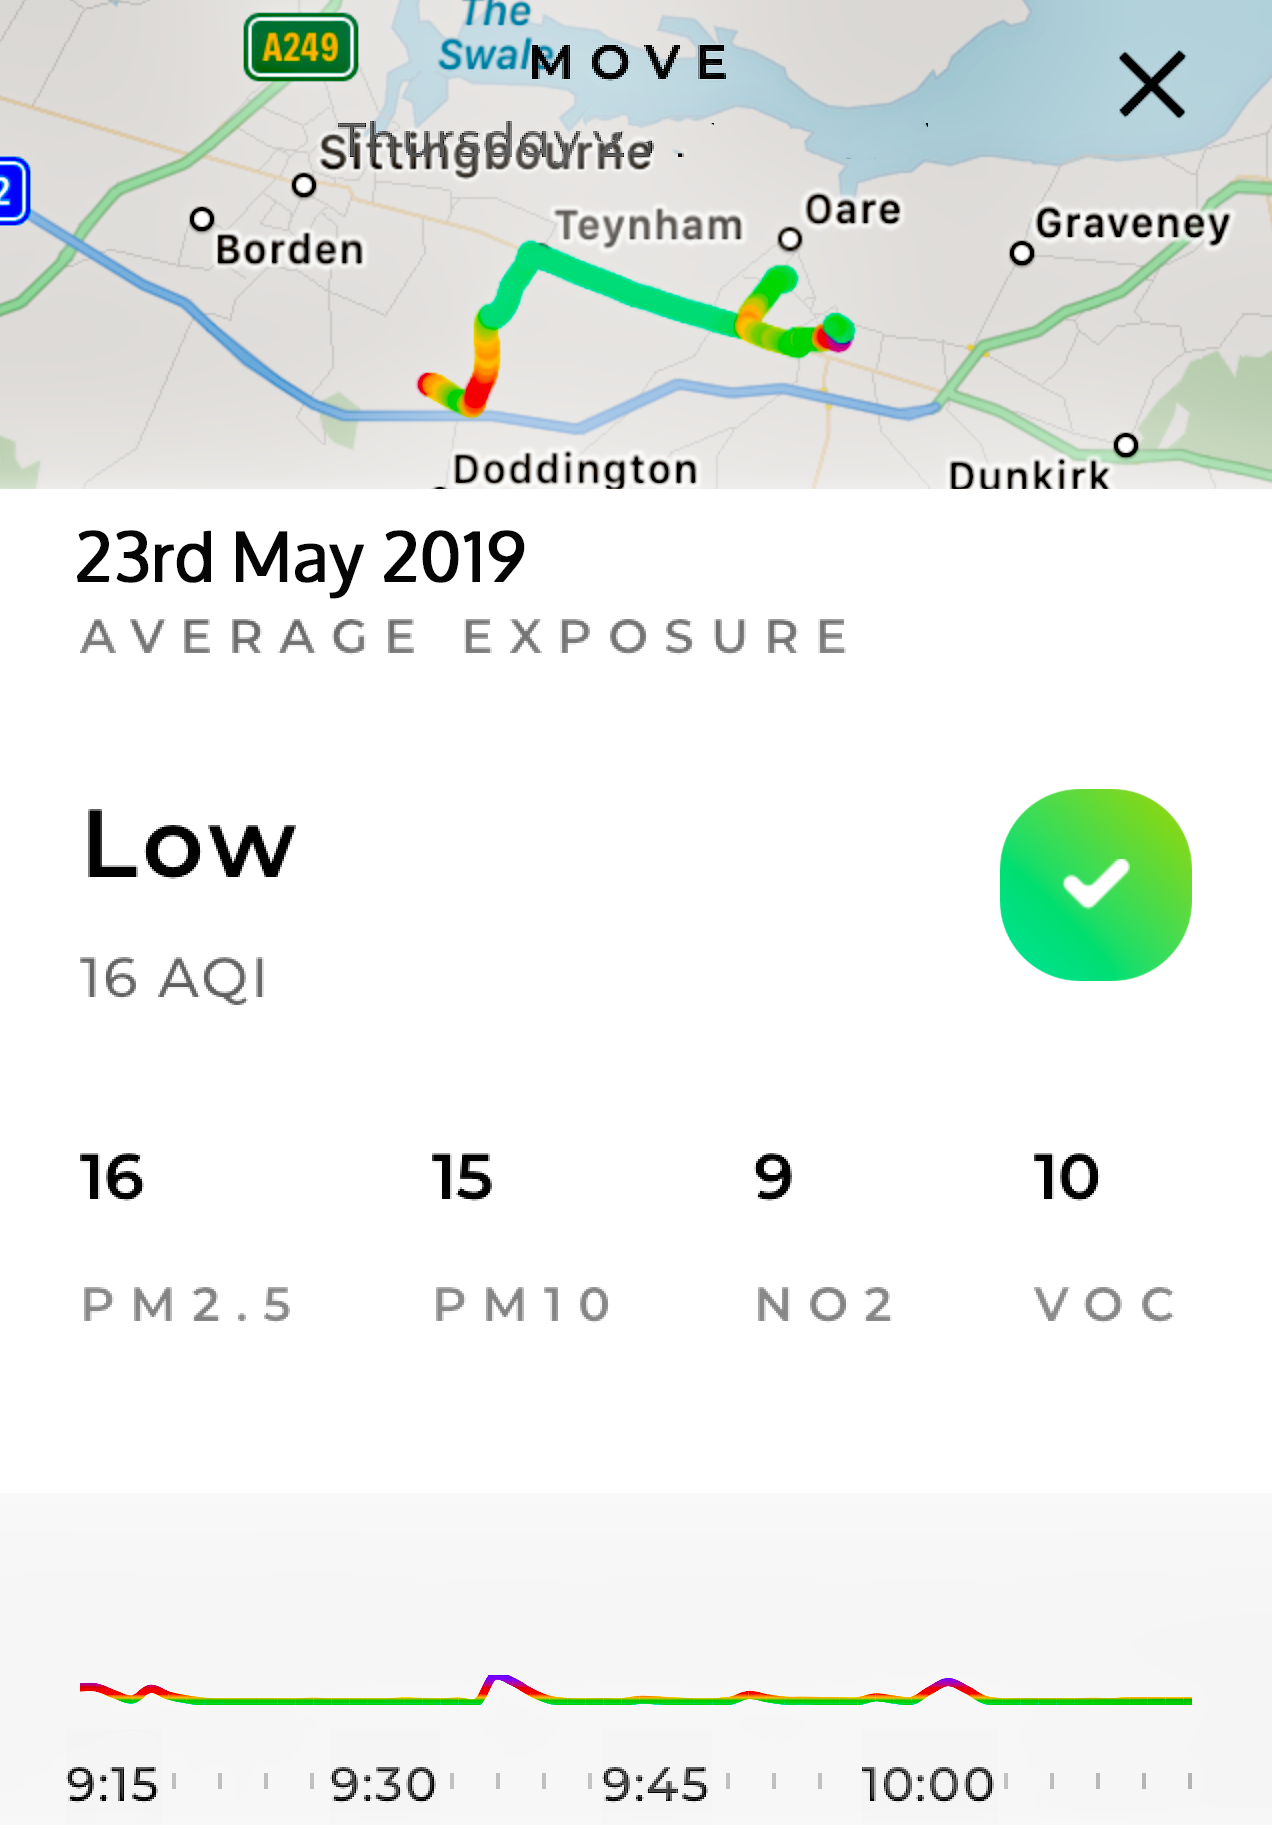
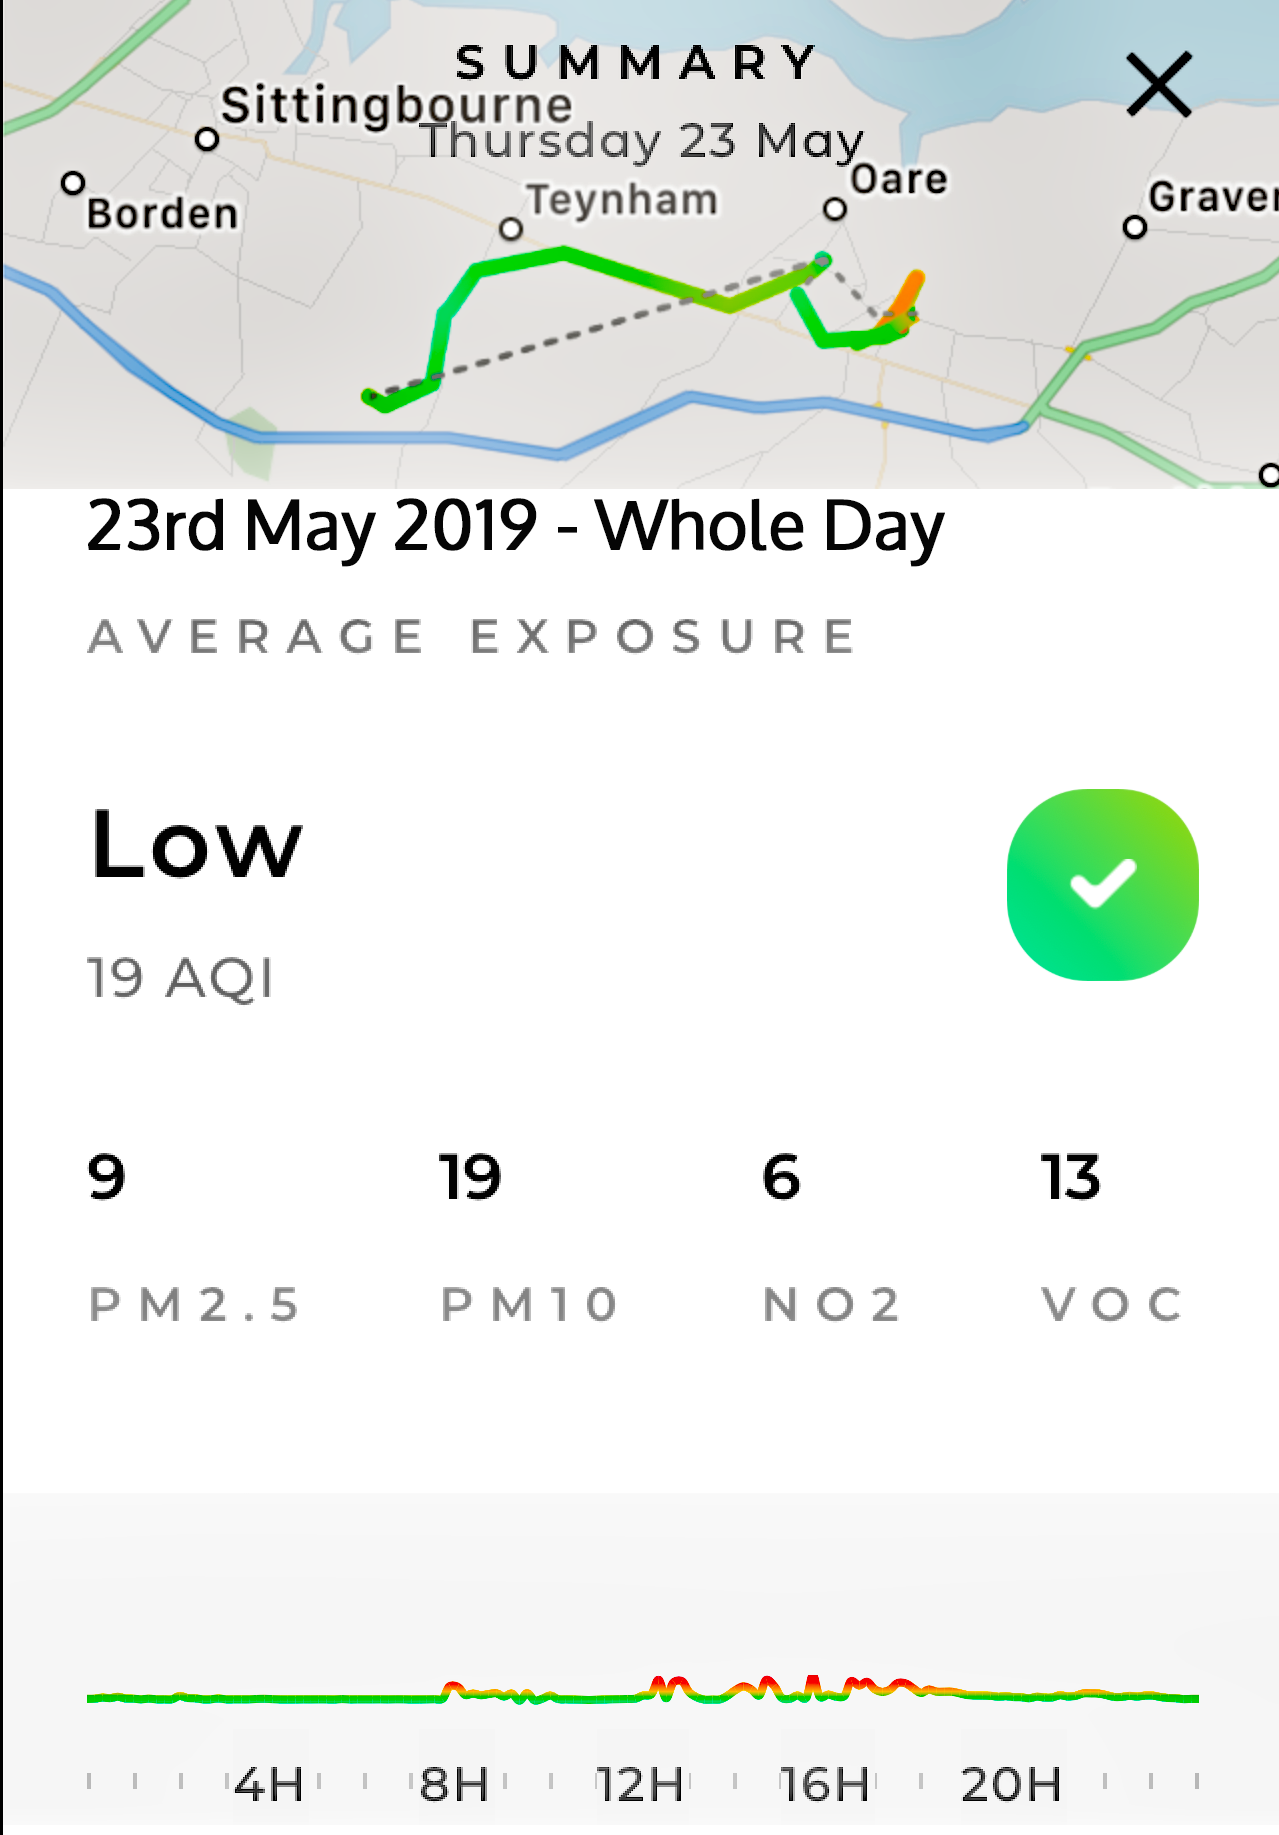
| 23 May Flow 1 Greenstreet Flow 2 Kingsdown: a.m. and all day |
10 |
20 |
5 9 6 |
14 10 13 |
MODERATE LOW |
Graph: Wind: SW - WSW (11kph). Dry. About as close to "Low" as we have seen on the A2. It was "Low" during a jog in the morning. Flow 2: Morning Graph: Traversing Lynsted Parish with highest pollution close to M2 (and Ospringe). Day Graph: Countryside largely "pollution free." |
||
| 16 9 |
15 19 |
|||||||
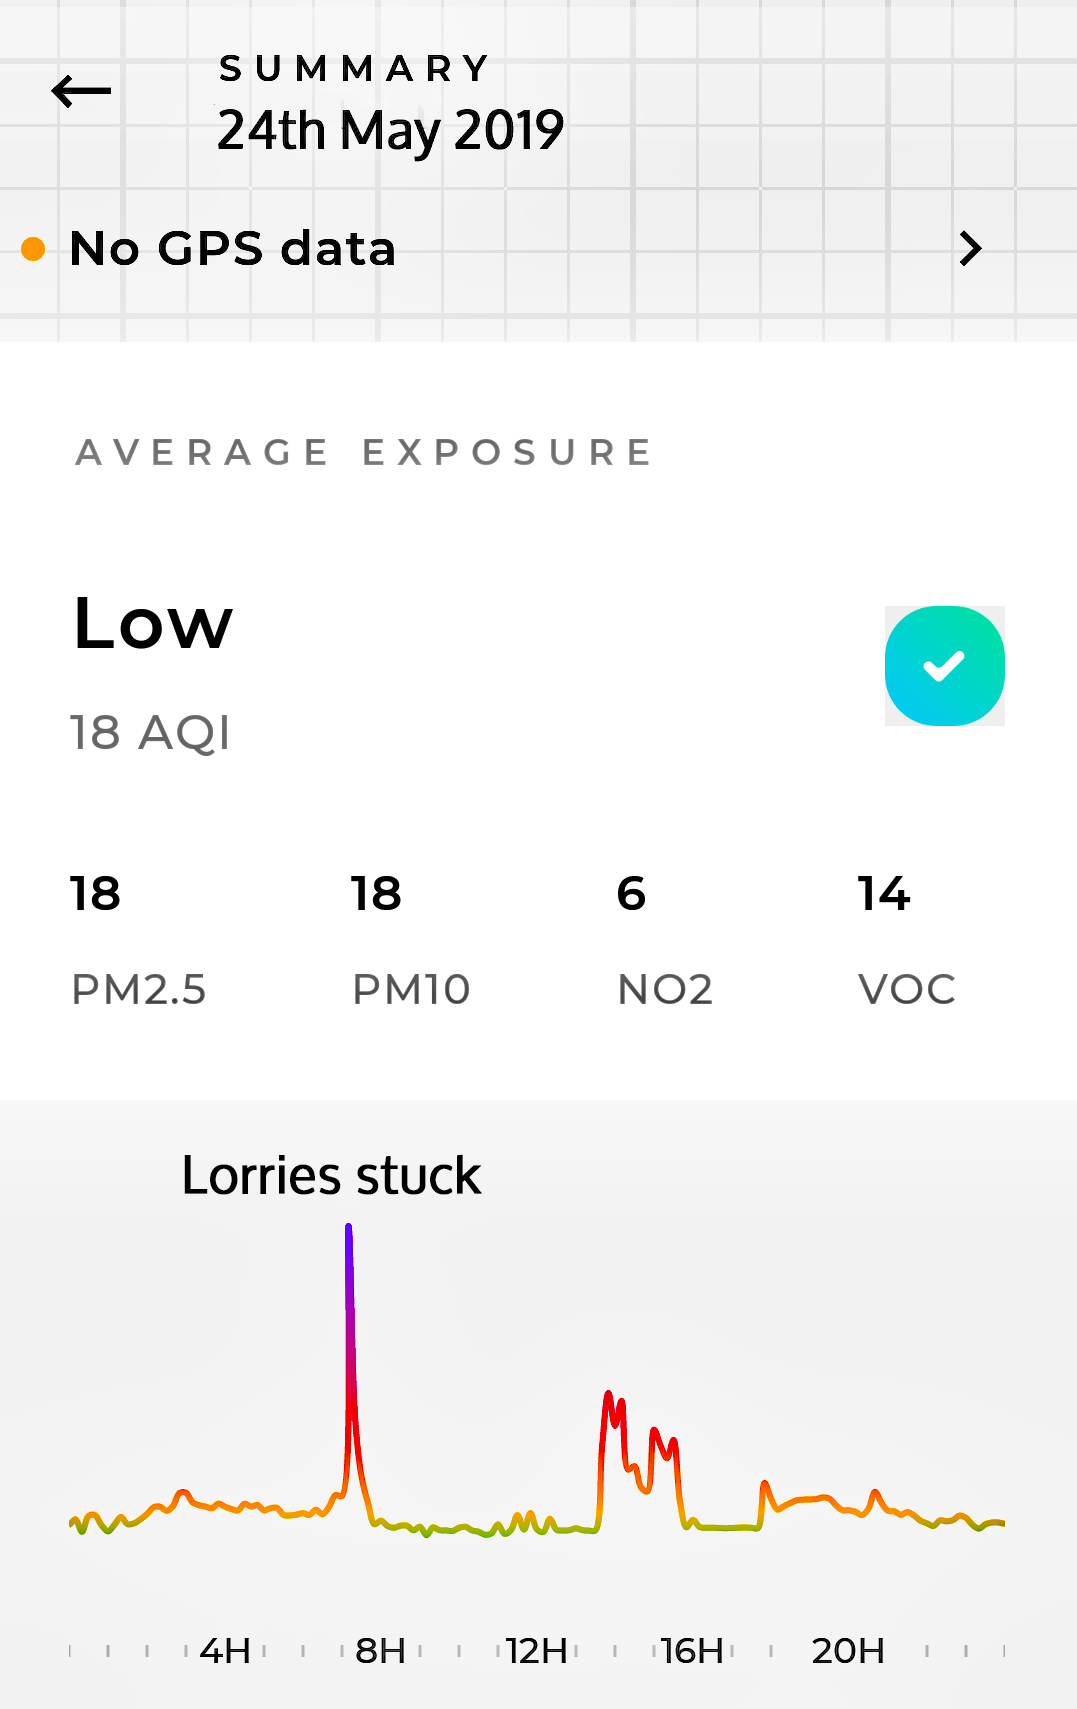
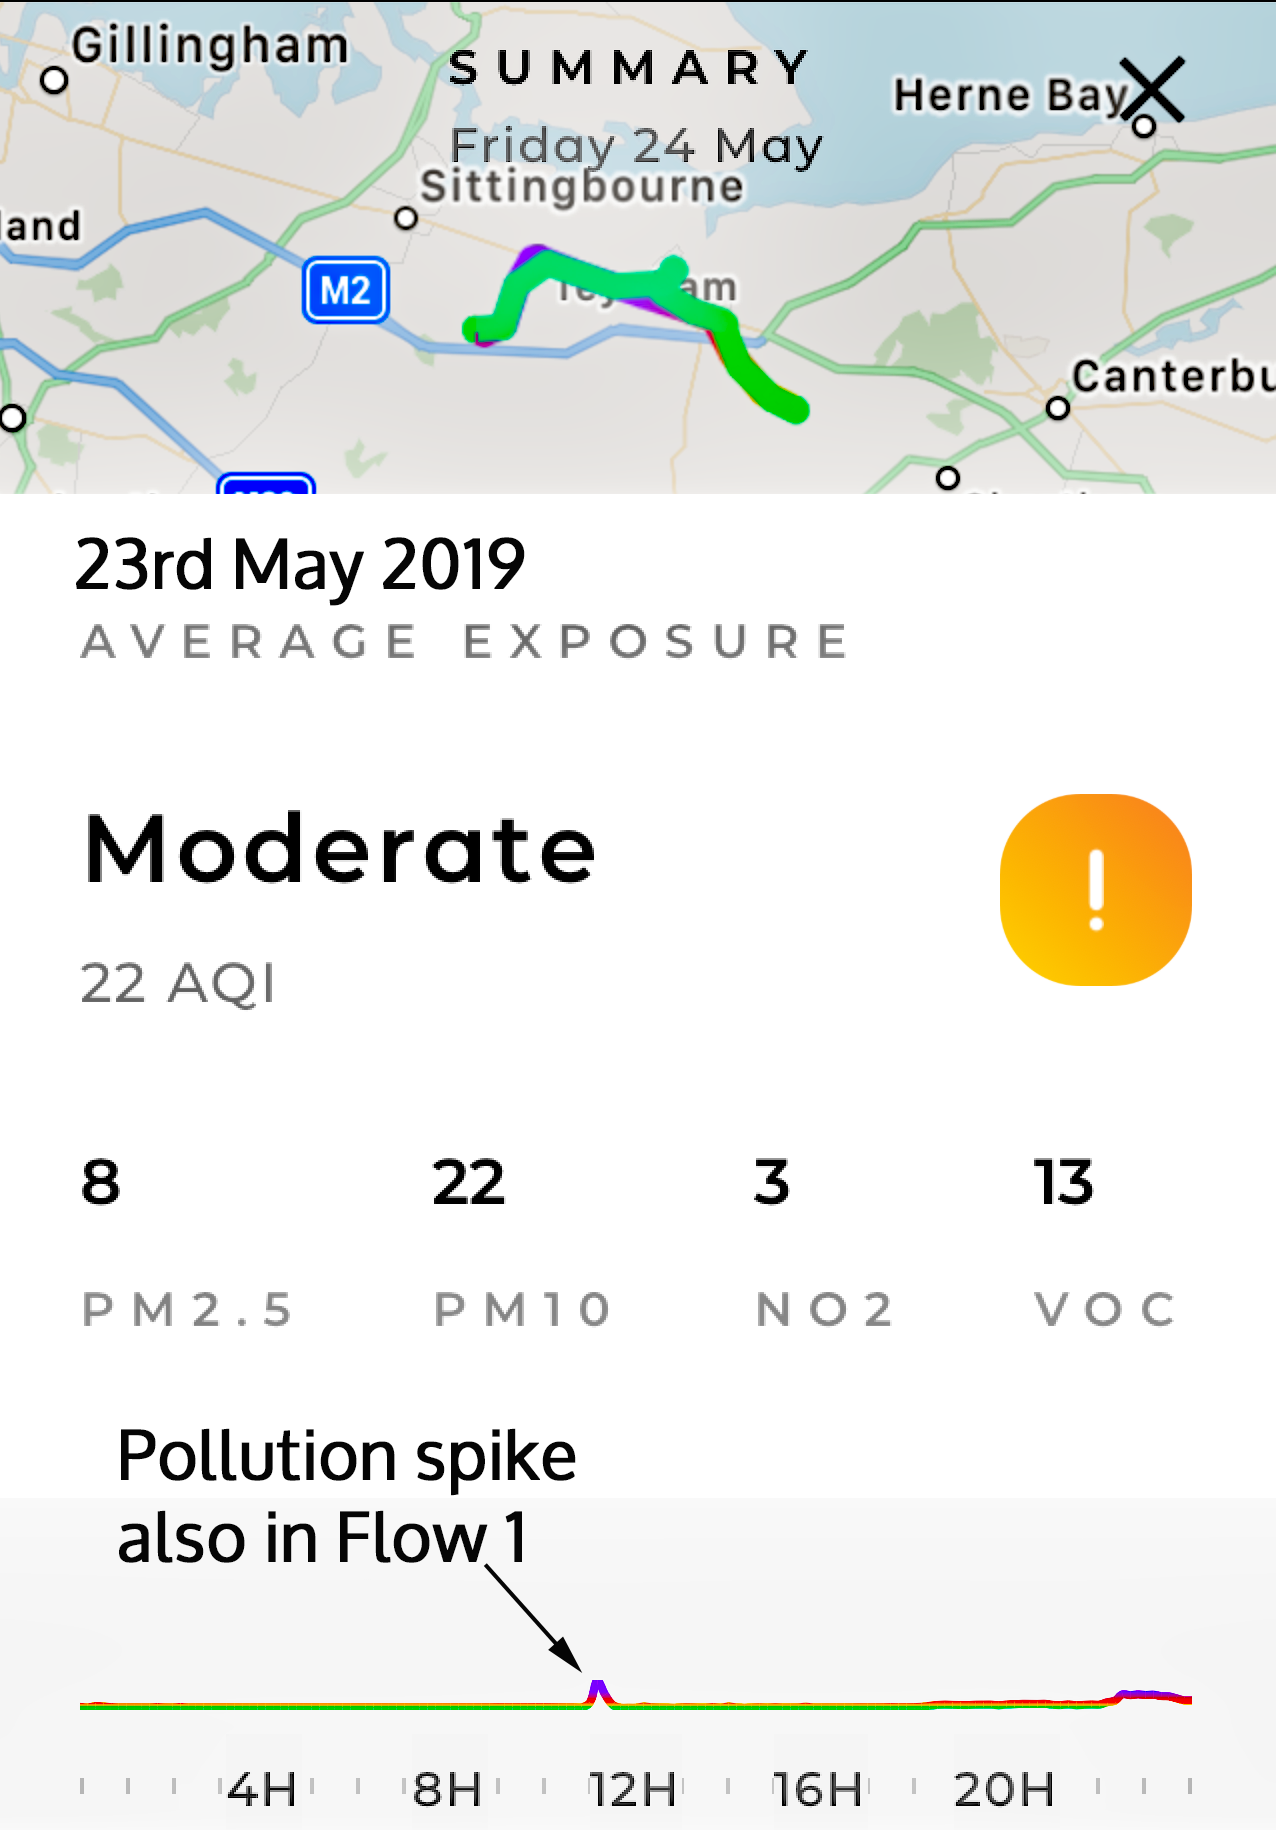
| 24th May Flow 1 Greenstreet Flow 2 Kingsdown |
18 |
18 . |
6 3 |
14 13 |
LOW MODERATE |
Graph. Wind: WSW - NW - N - W (7kph, light eddying wind in evening); Rain: 1.2mm. The first A2 GREEN DAY in over three months! Two peaks - a spike when lorries got stuck; a period around the school run. Flow 2: Outward and return journeys show same variability in pollution spikes on A2. |
||
| 8 | 22 | |||||||
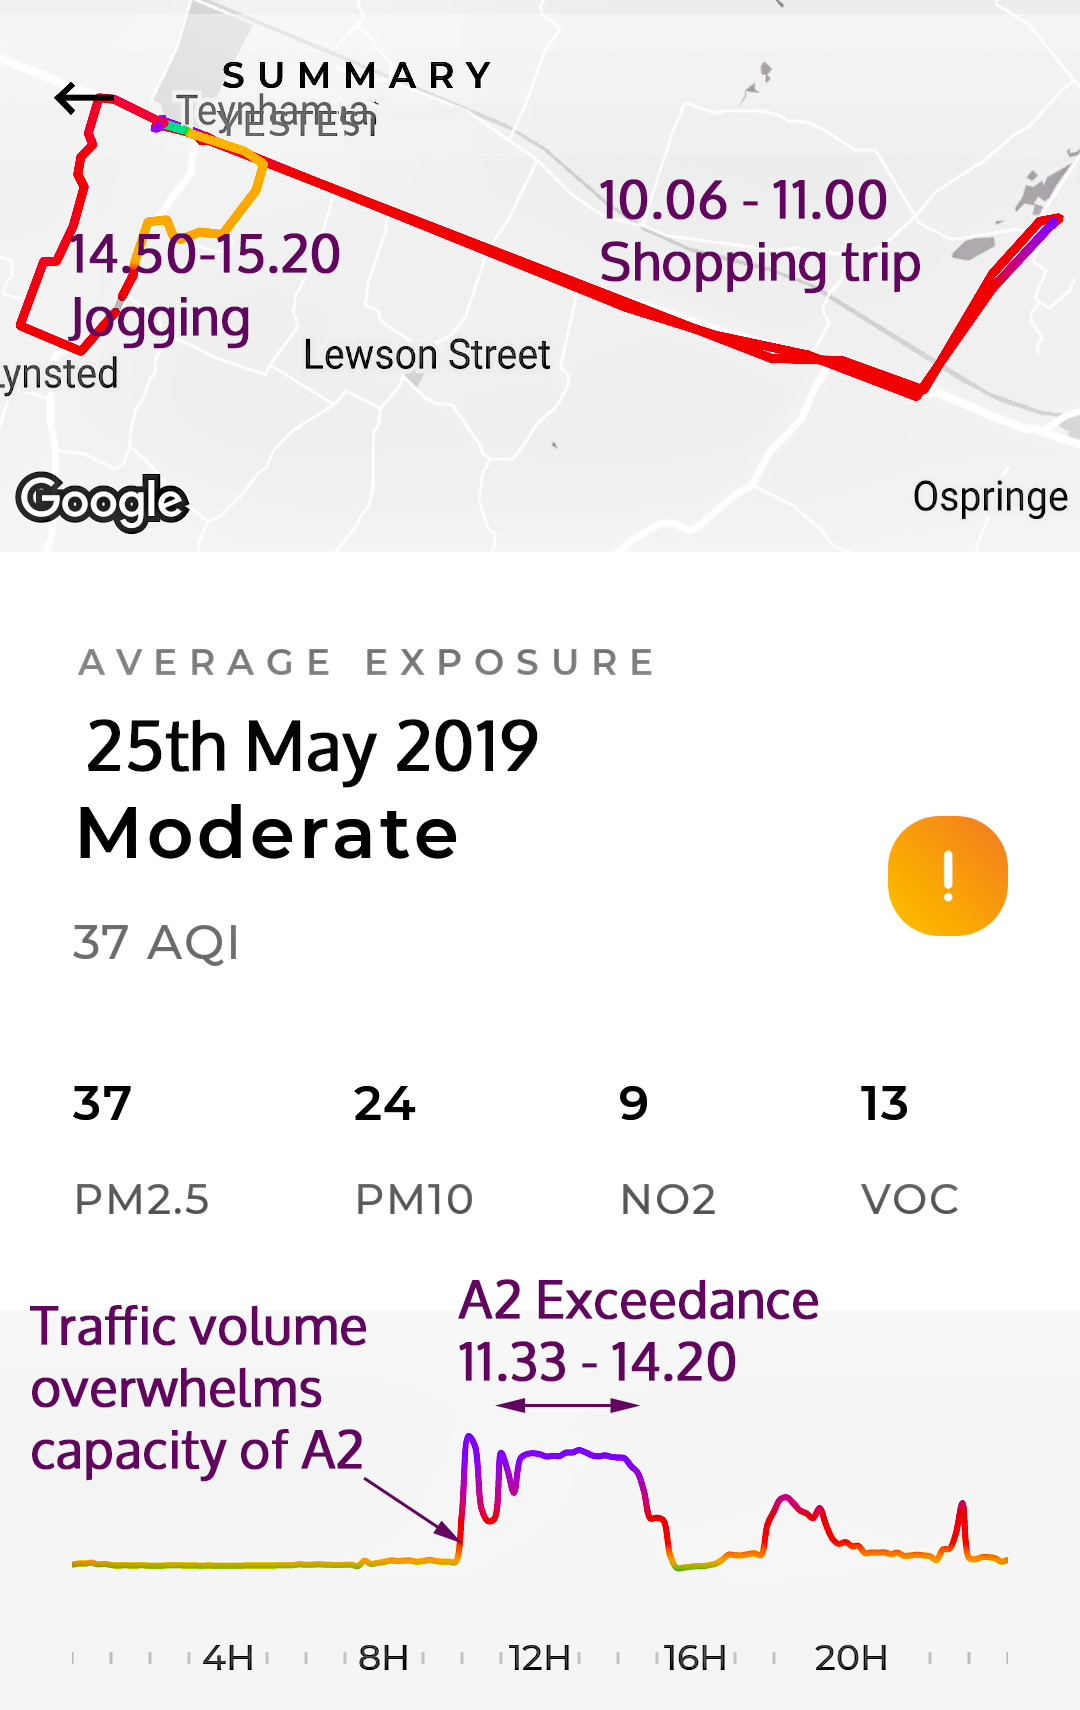
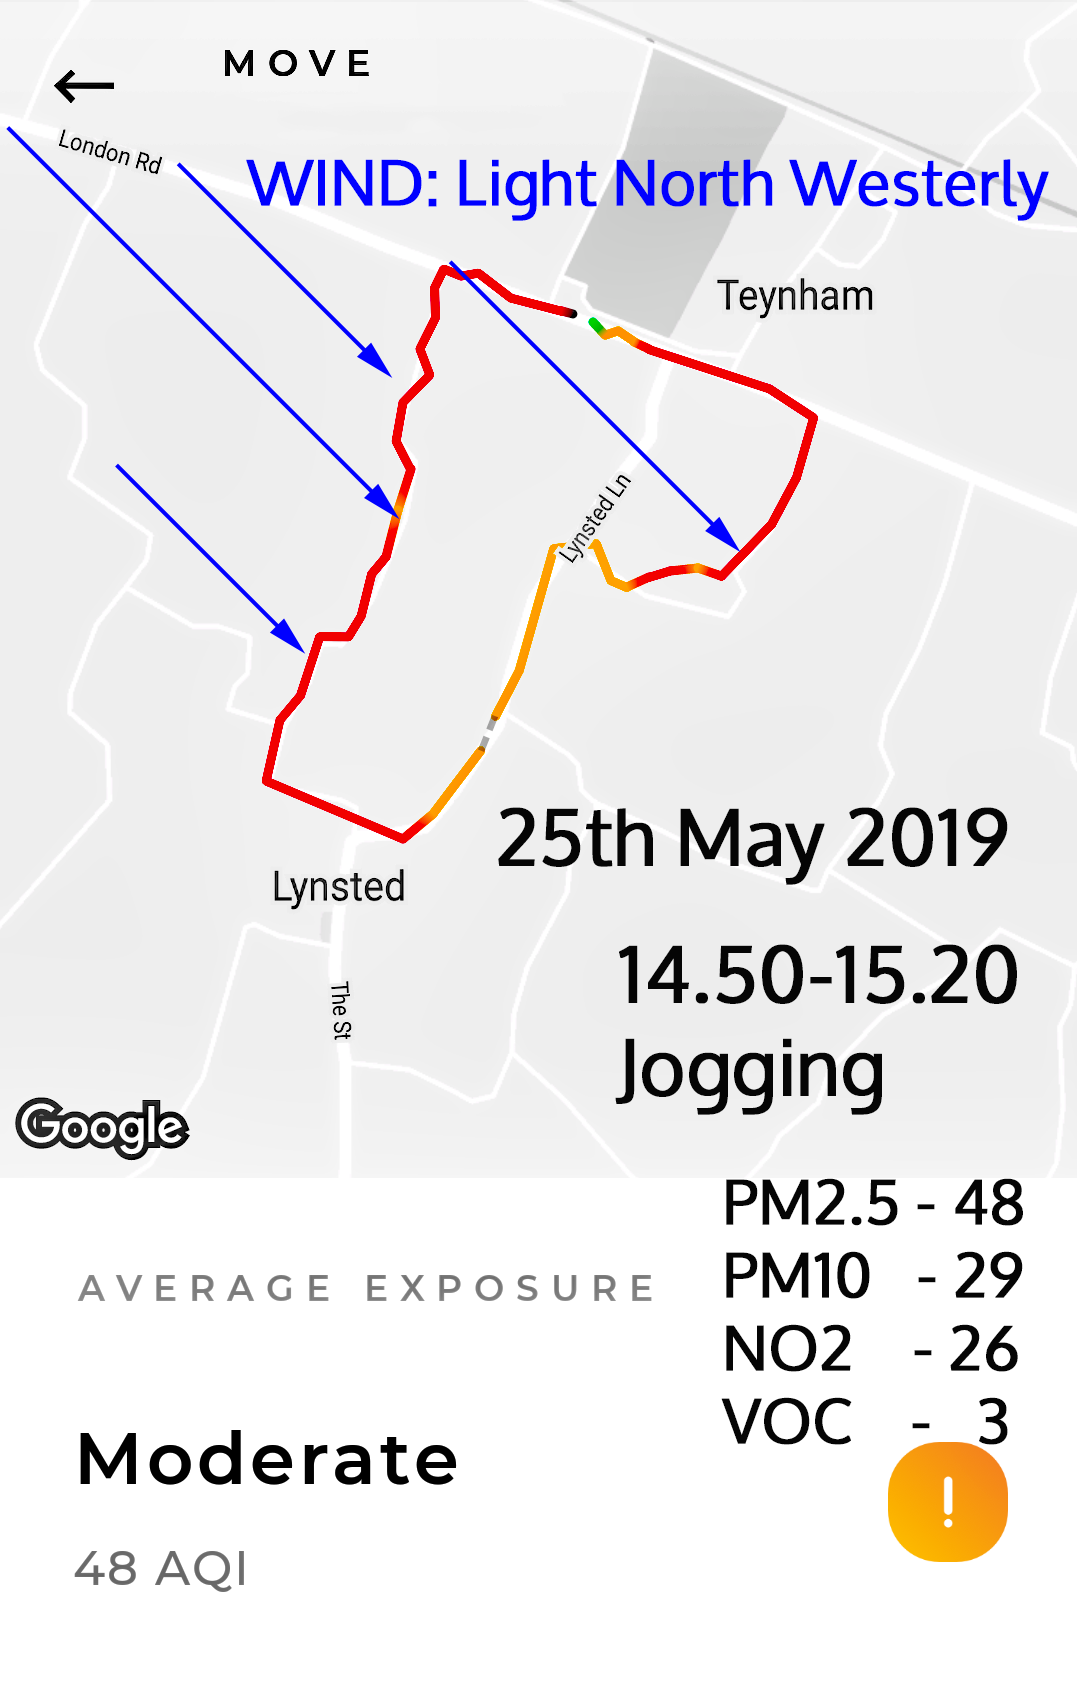
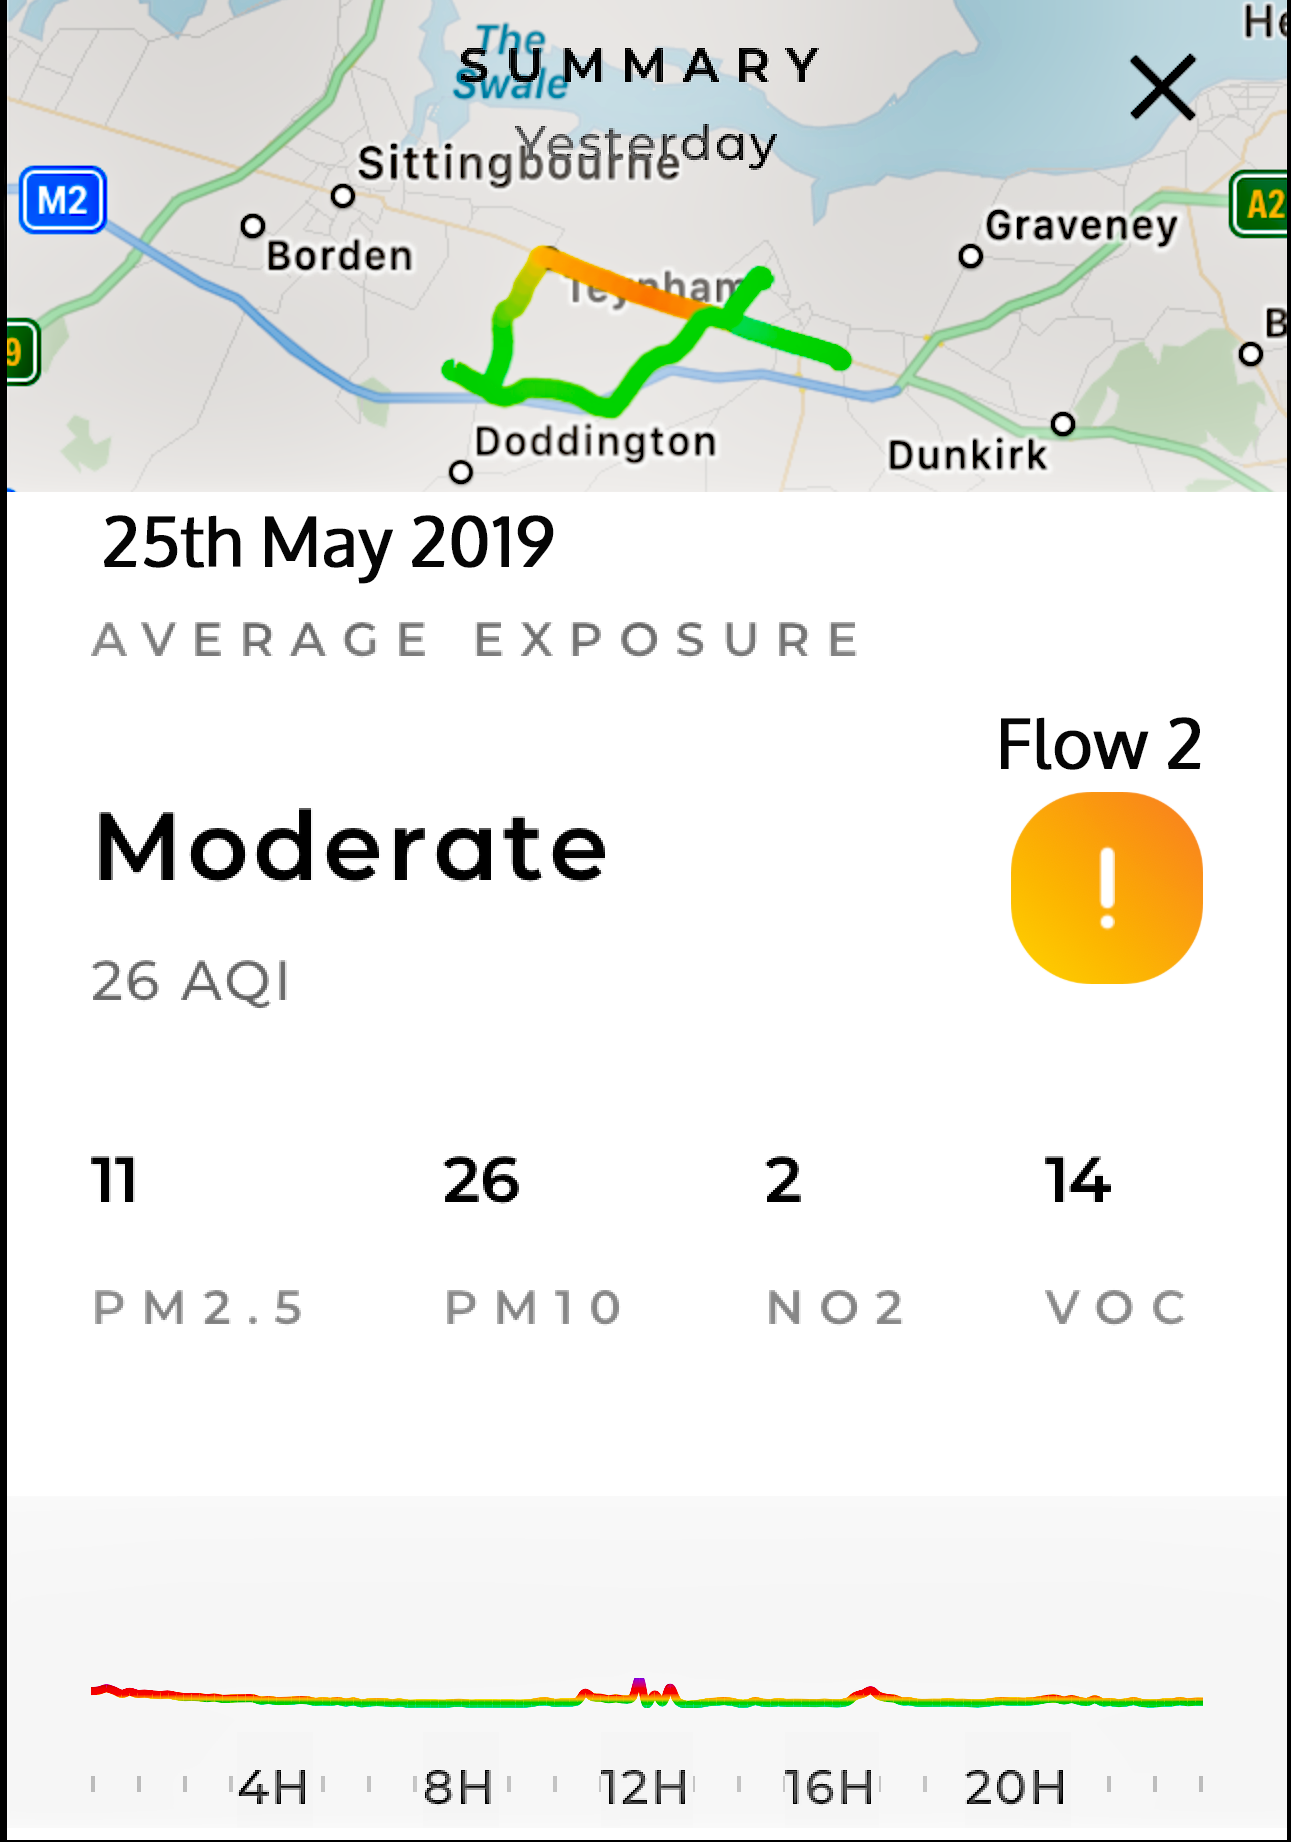
| 25th May Flow 1 Greenstreet Flow 2 Kingsdown |
37 |
24 |
9 2 |
13 14 |
MODERATE "Queueing Theory" Illustrated Pollution spreads to Lynsted Village |
Exceedance:- 11.30am - 14.10pm - PM2.5 - |
Graph: Wind: NNW - NW (9kph). Rain: 4.5mm. A good example of "Queuing Theory" in action! When traffic density is low enough, vehicles pass with lower contribution to pollution. But we noticed the traffic very suddenly grinding to very slow and jammed. This led to two Very High peaks (PM2.5 in particular) followed by an exceedance period, then mixed pollution into the evening. This shows that braking & idling vehicles suddenly build harmful levels of pollution. Jogging Map: Spread of pollution toward Lynsted Village. Flow 2: A2 shows as polluted while most countryside was Green |
|
| 11 | 26 | |||||||
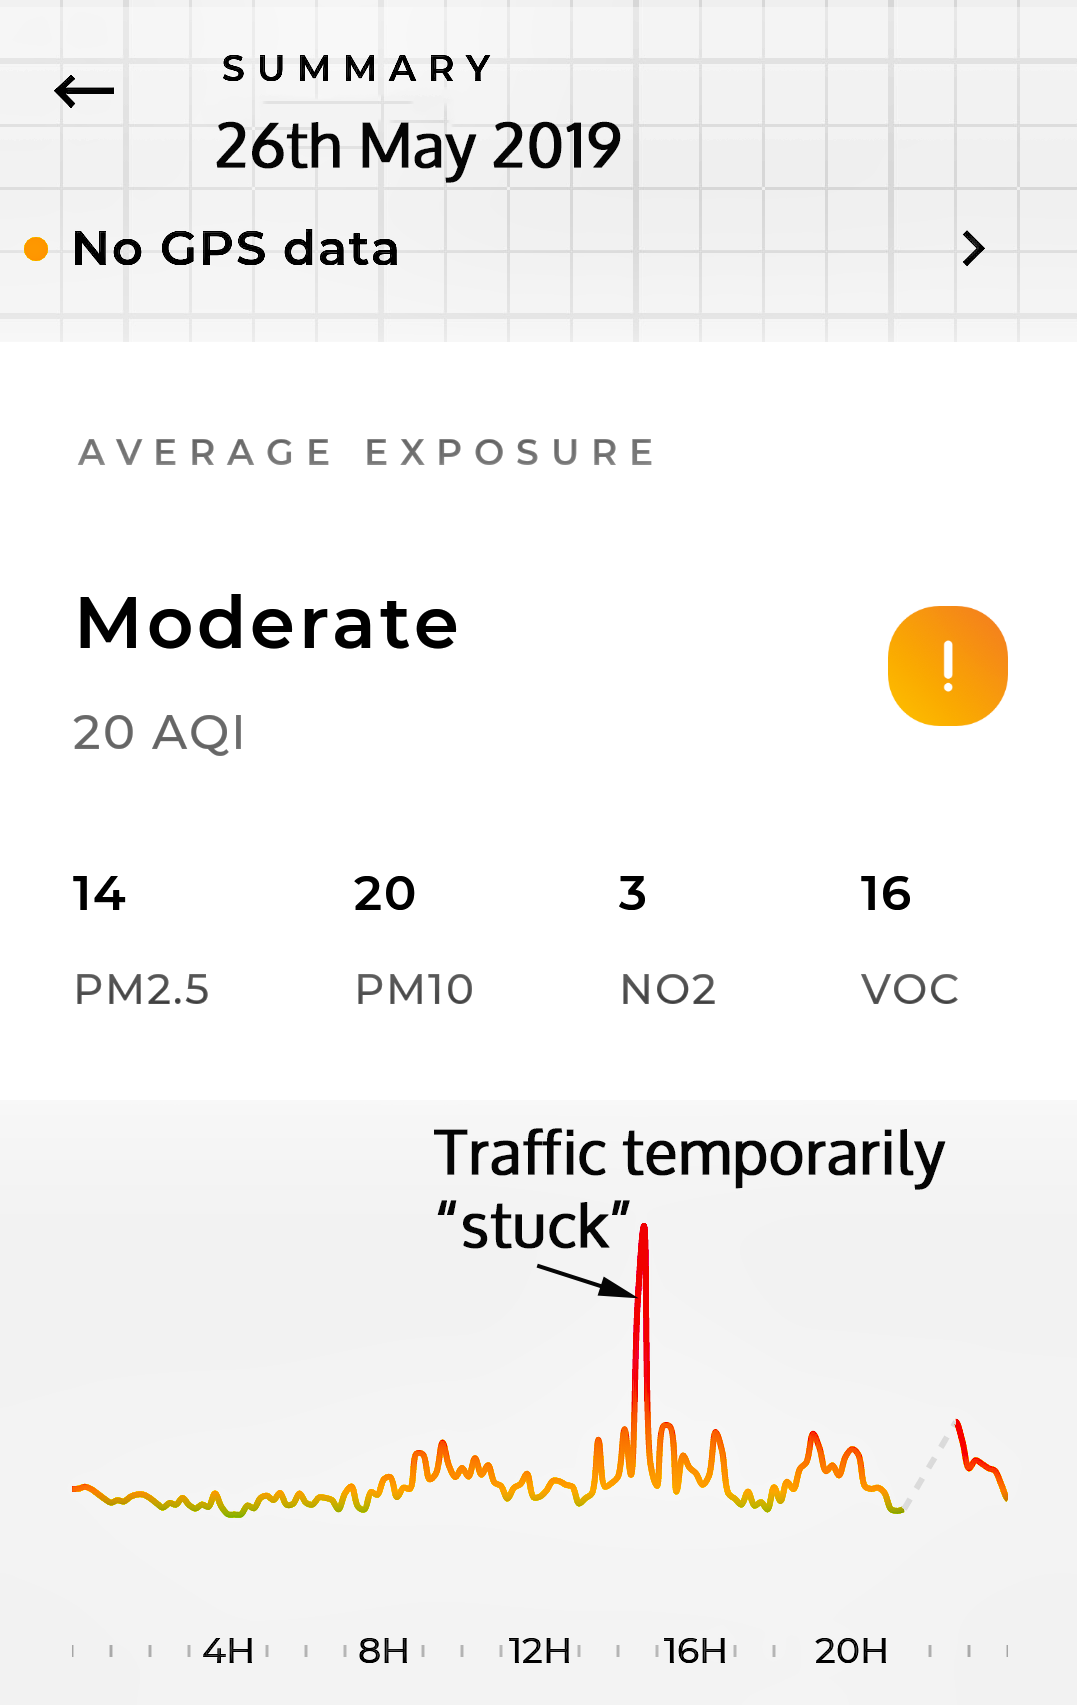
| 26th May Flow 1 Greenstreet |
14 |
20 |
3 |
16 |
MODERATE | Graph: Wind: WSW - W - WNW (18kph). Rain: 4.70mm. Periods of "Low" pollution and a spike of High (traffic got snarled up) then bumped along after 15.00pm. | ||
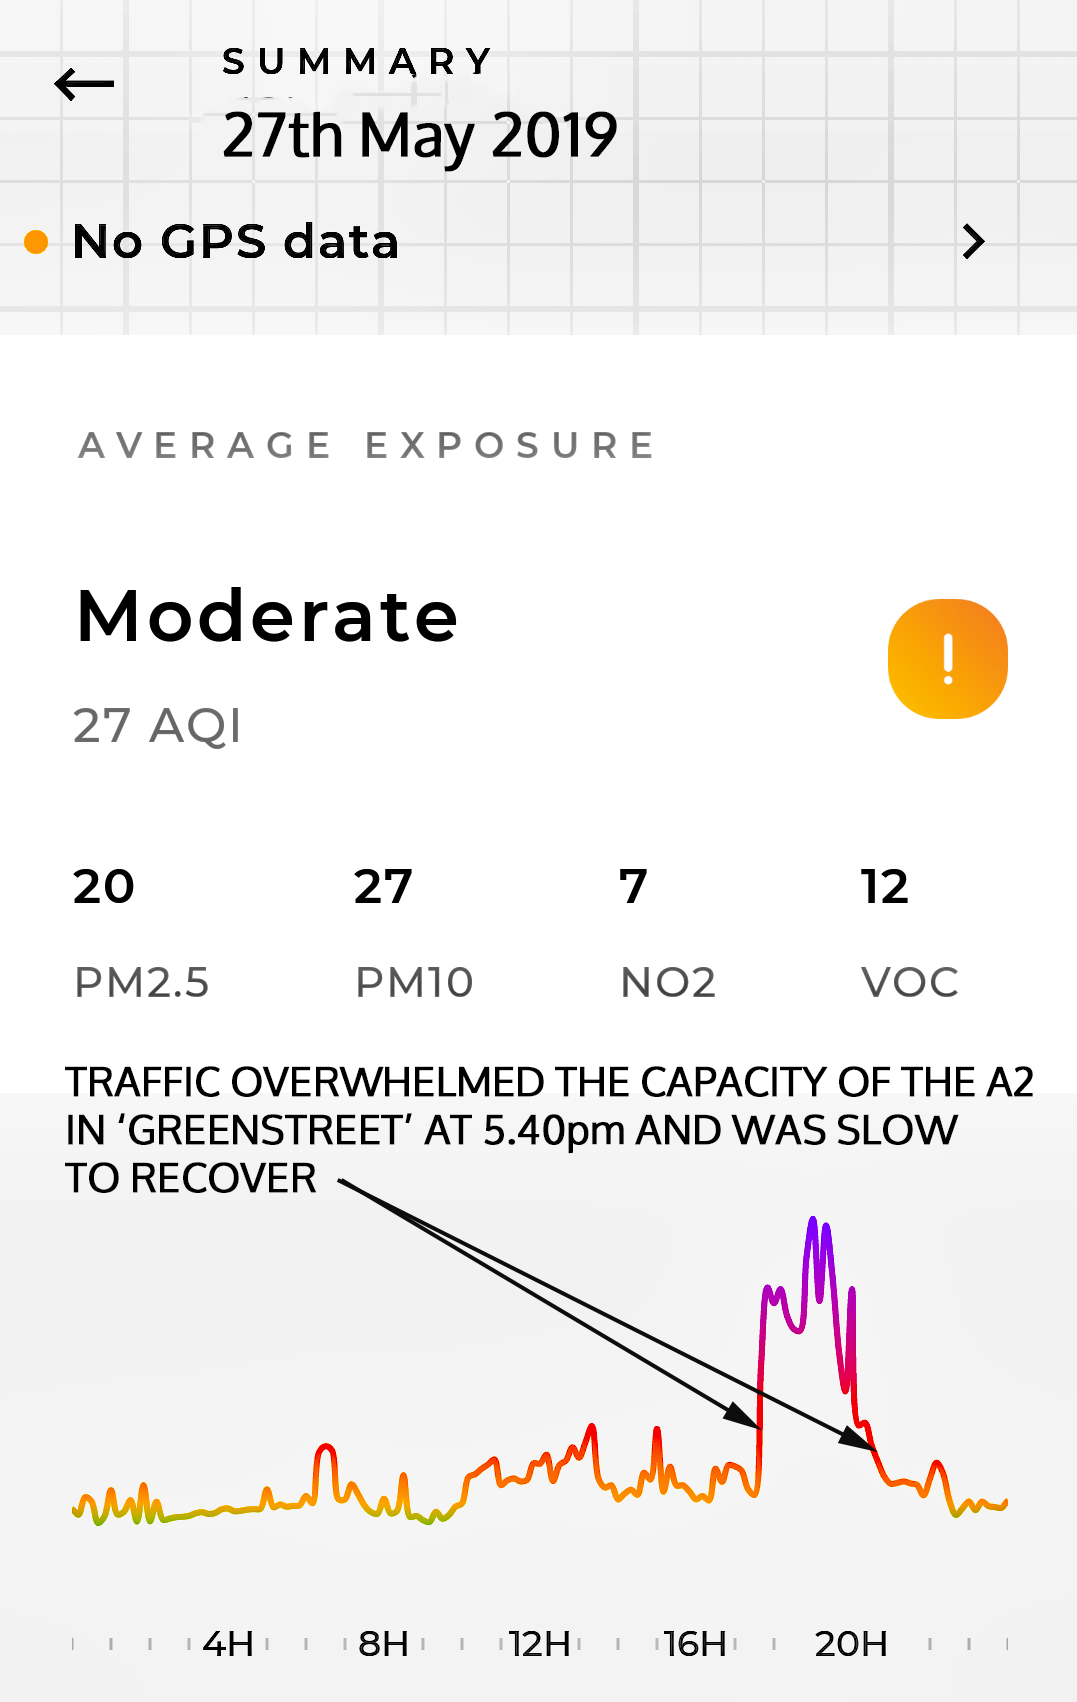
| 27th May Flow 1 Greenstreet |
20 |
27 |
7 |
12 |
MODERATE | Graph: Wind: NW - W (15kph). Rain: 2.00mm (evening). Something for everyone! "Low" to "Very High" - between 17.40 to 20.06pm there was a 'block' of peaks as the A2 passed it's "Service Rate". "Service Rate" is the principle that roads of different types and complexity have the ability to serve a particular volume and type of traffic - as soon as traffic hits the maximum "Service Rate" you get queues and jams and pollution concentrations. | ||
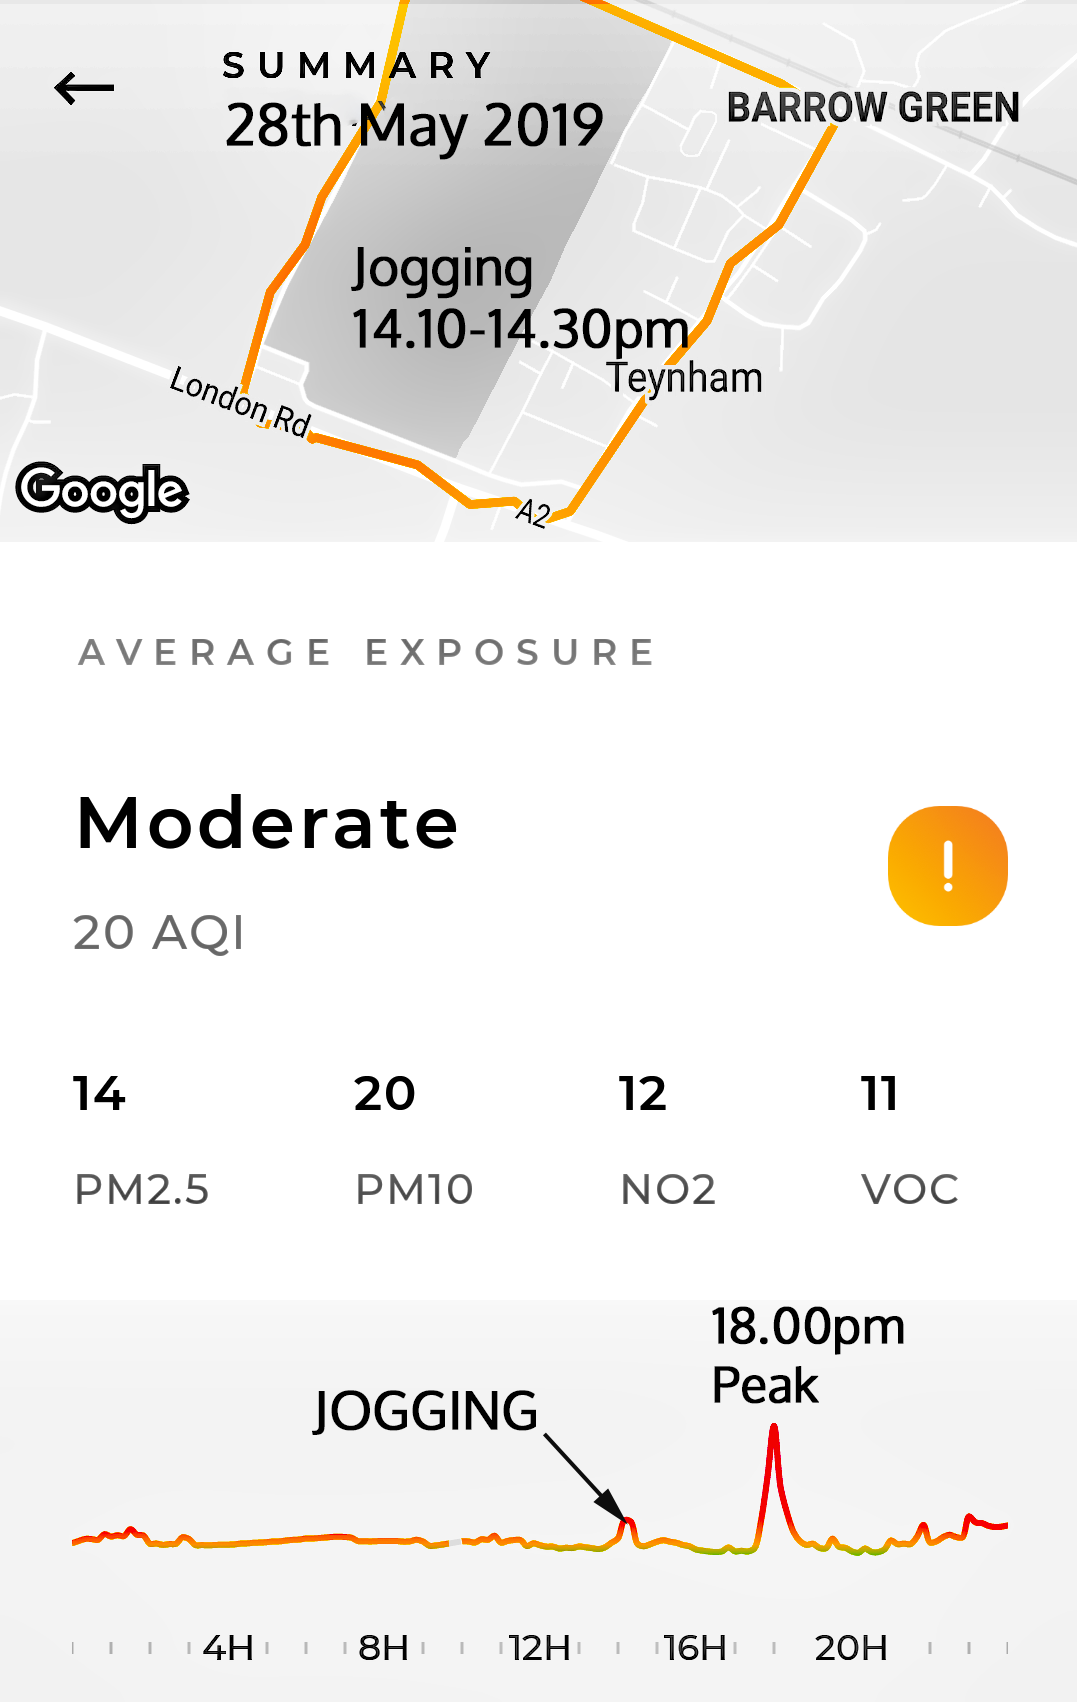
| 28th May Flow 1 Greenstreet Flow 2 Kingsdown |
14 . |
20 |
12 |
11 |
MODERATE | Graph: Very close to "Low" - a good day to enjoy strenuous exercise! Wind: W - NW - NNE - E (15kph). Rain: 6.50mm | ||
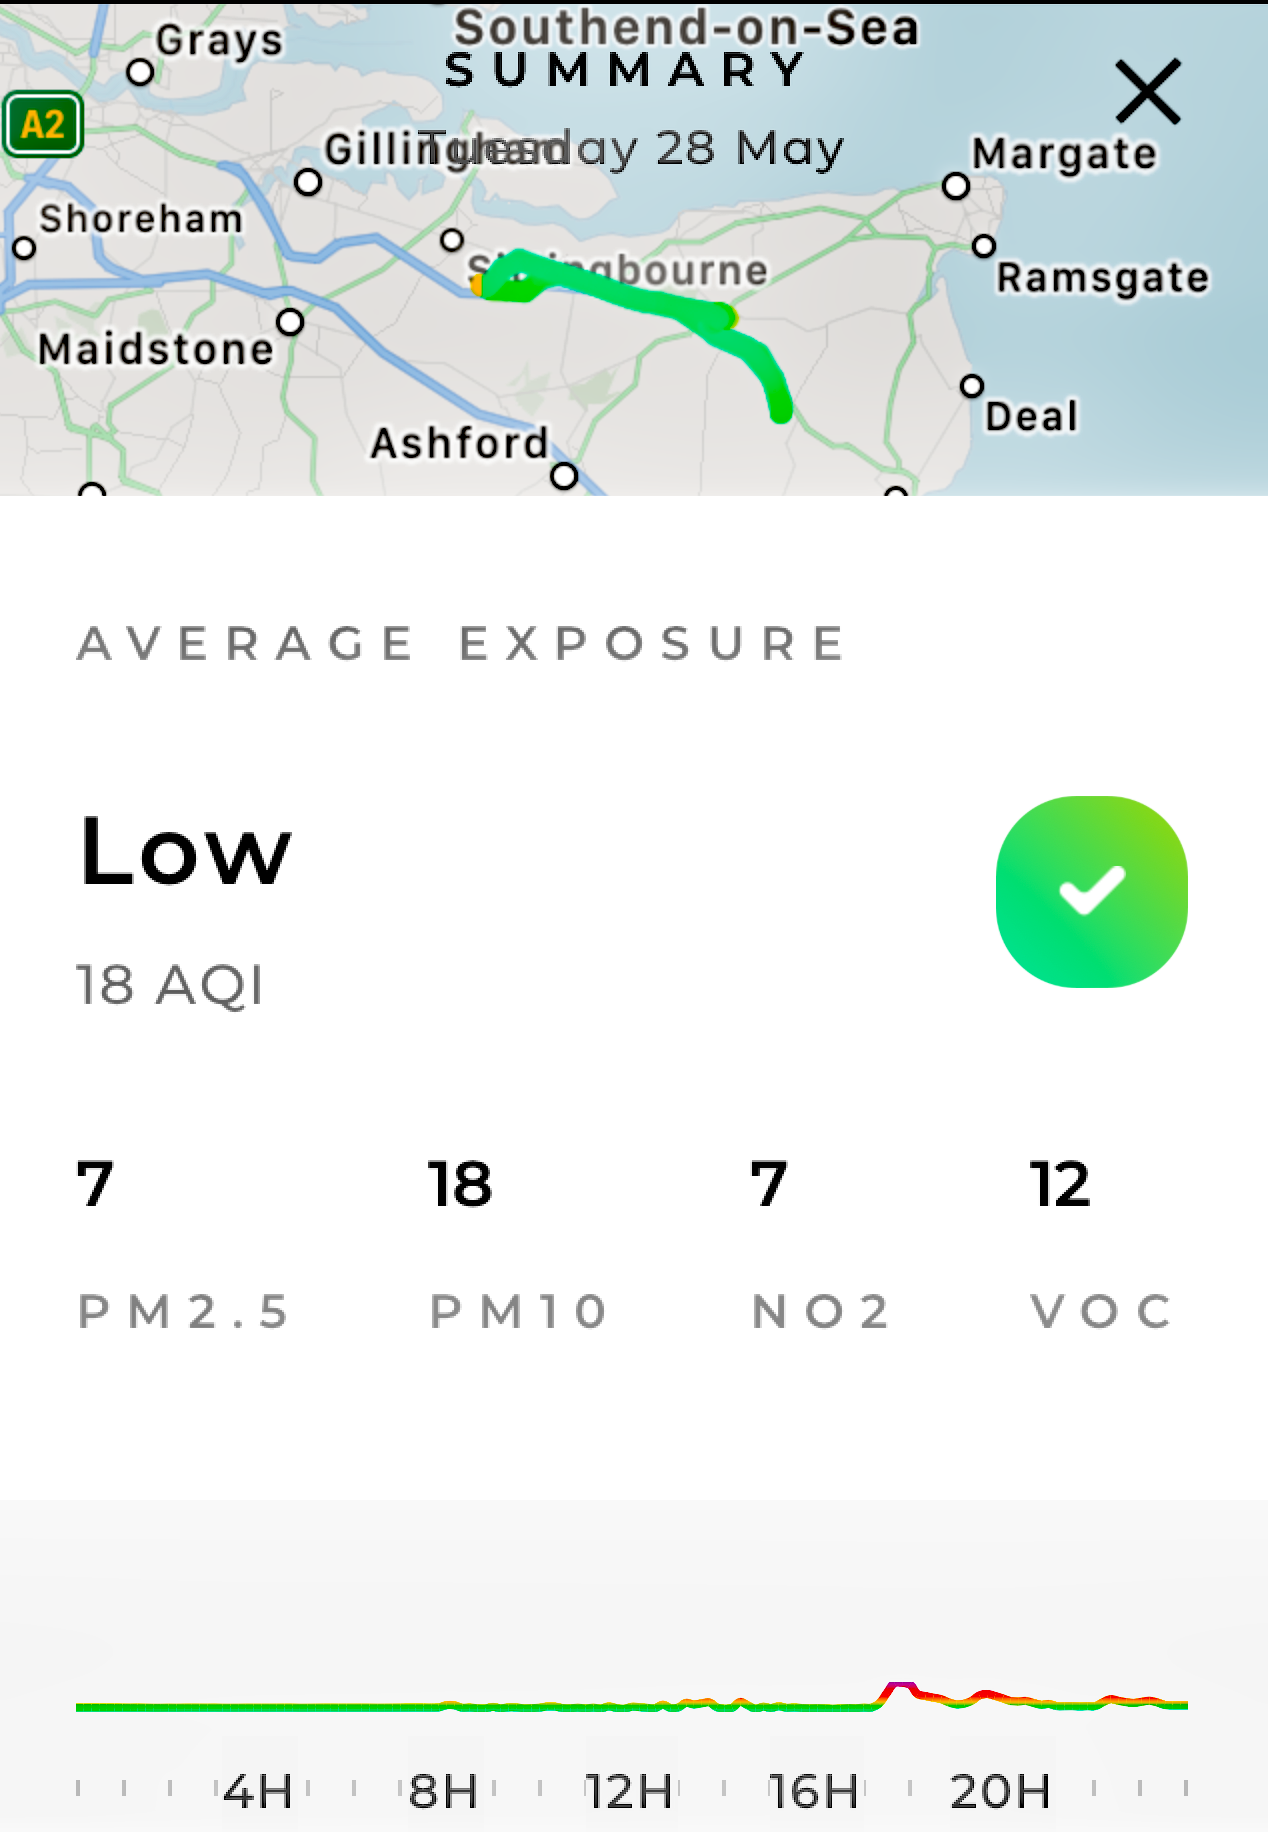
| 7 | 18 | 7 | 12 | LOW | Graph: Another good day on the move. | |||
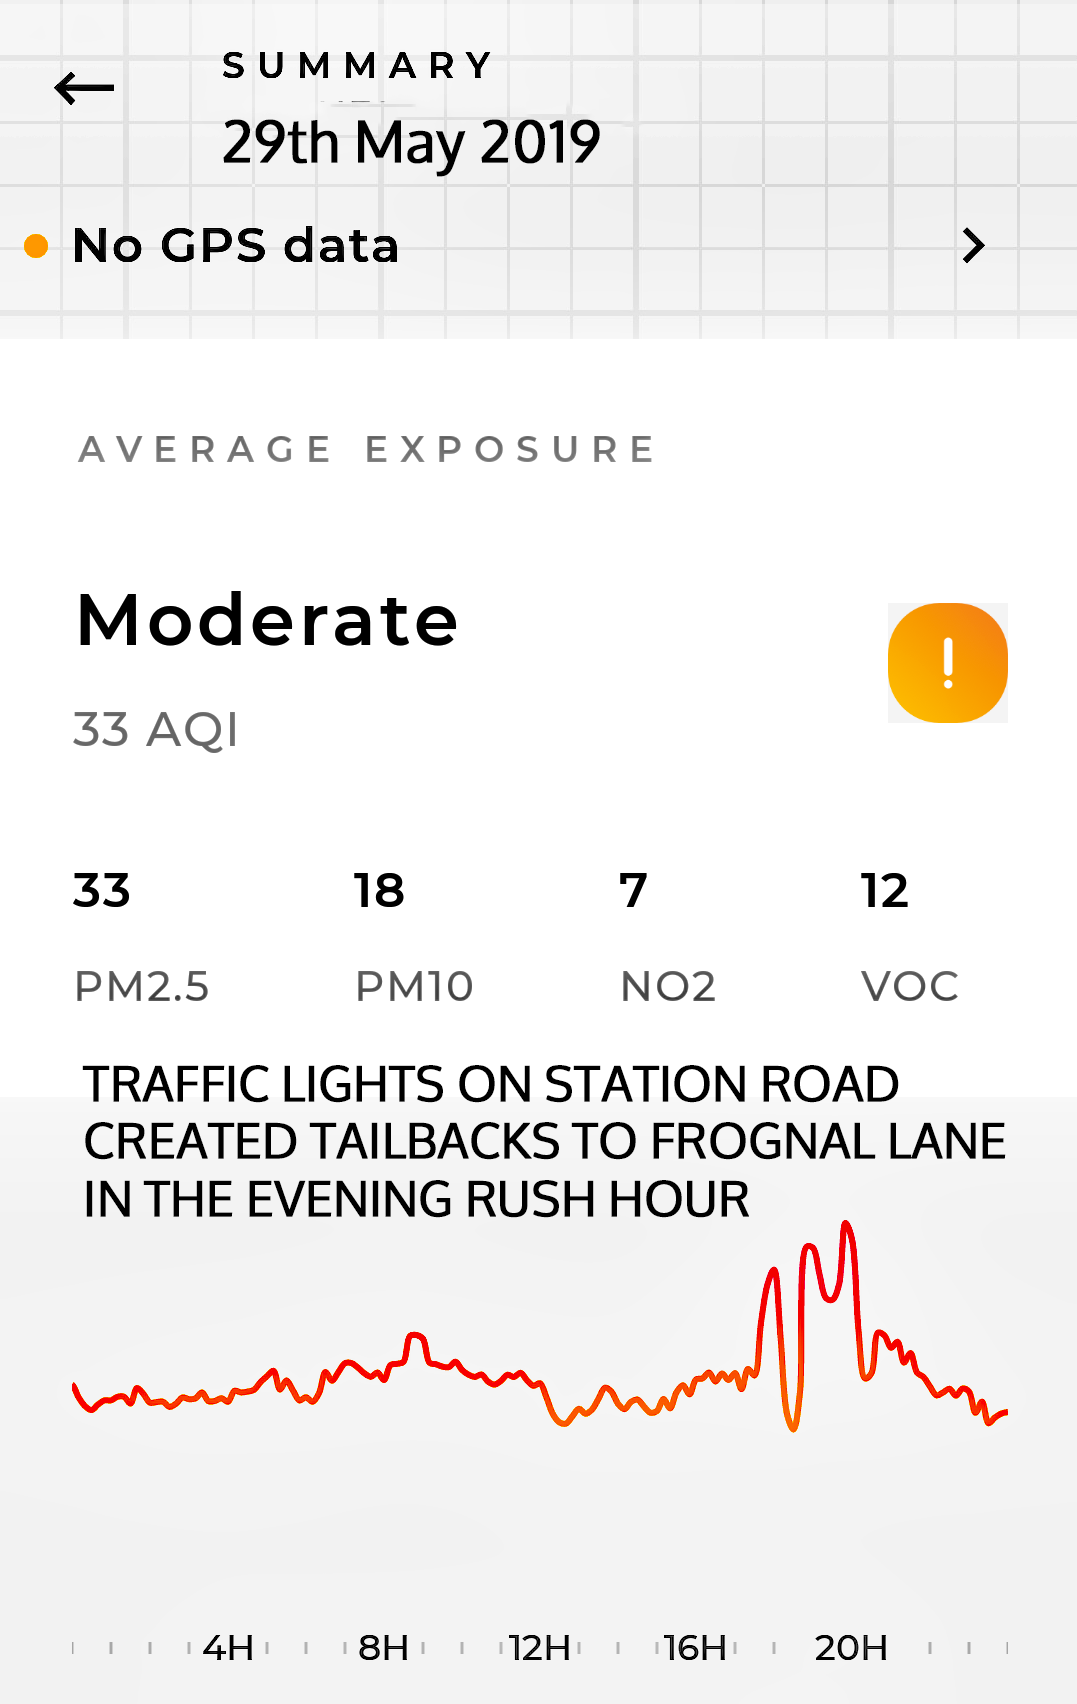
| 29th May Flow 1 Greenstreet Flow 2 Kingsdown (out and about) |
33 |
18 |
7 |
12 |
MODERATE | Graph: Wind: SE - S - SW (18kph). Rain: 1.60mm. Traffic lights on Station Road created tailbacks to Frognal Lane in the evening Rush hour. | ||
| 7 | 17 | 7 | 12 | LOW | Graph: A good day to be up on the Downs or simply out in the cold clear air! Now let's hope there is a world in which this is NORMAL! | |||
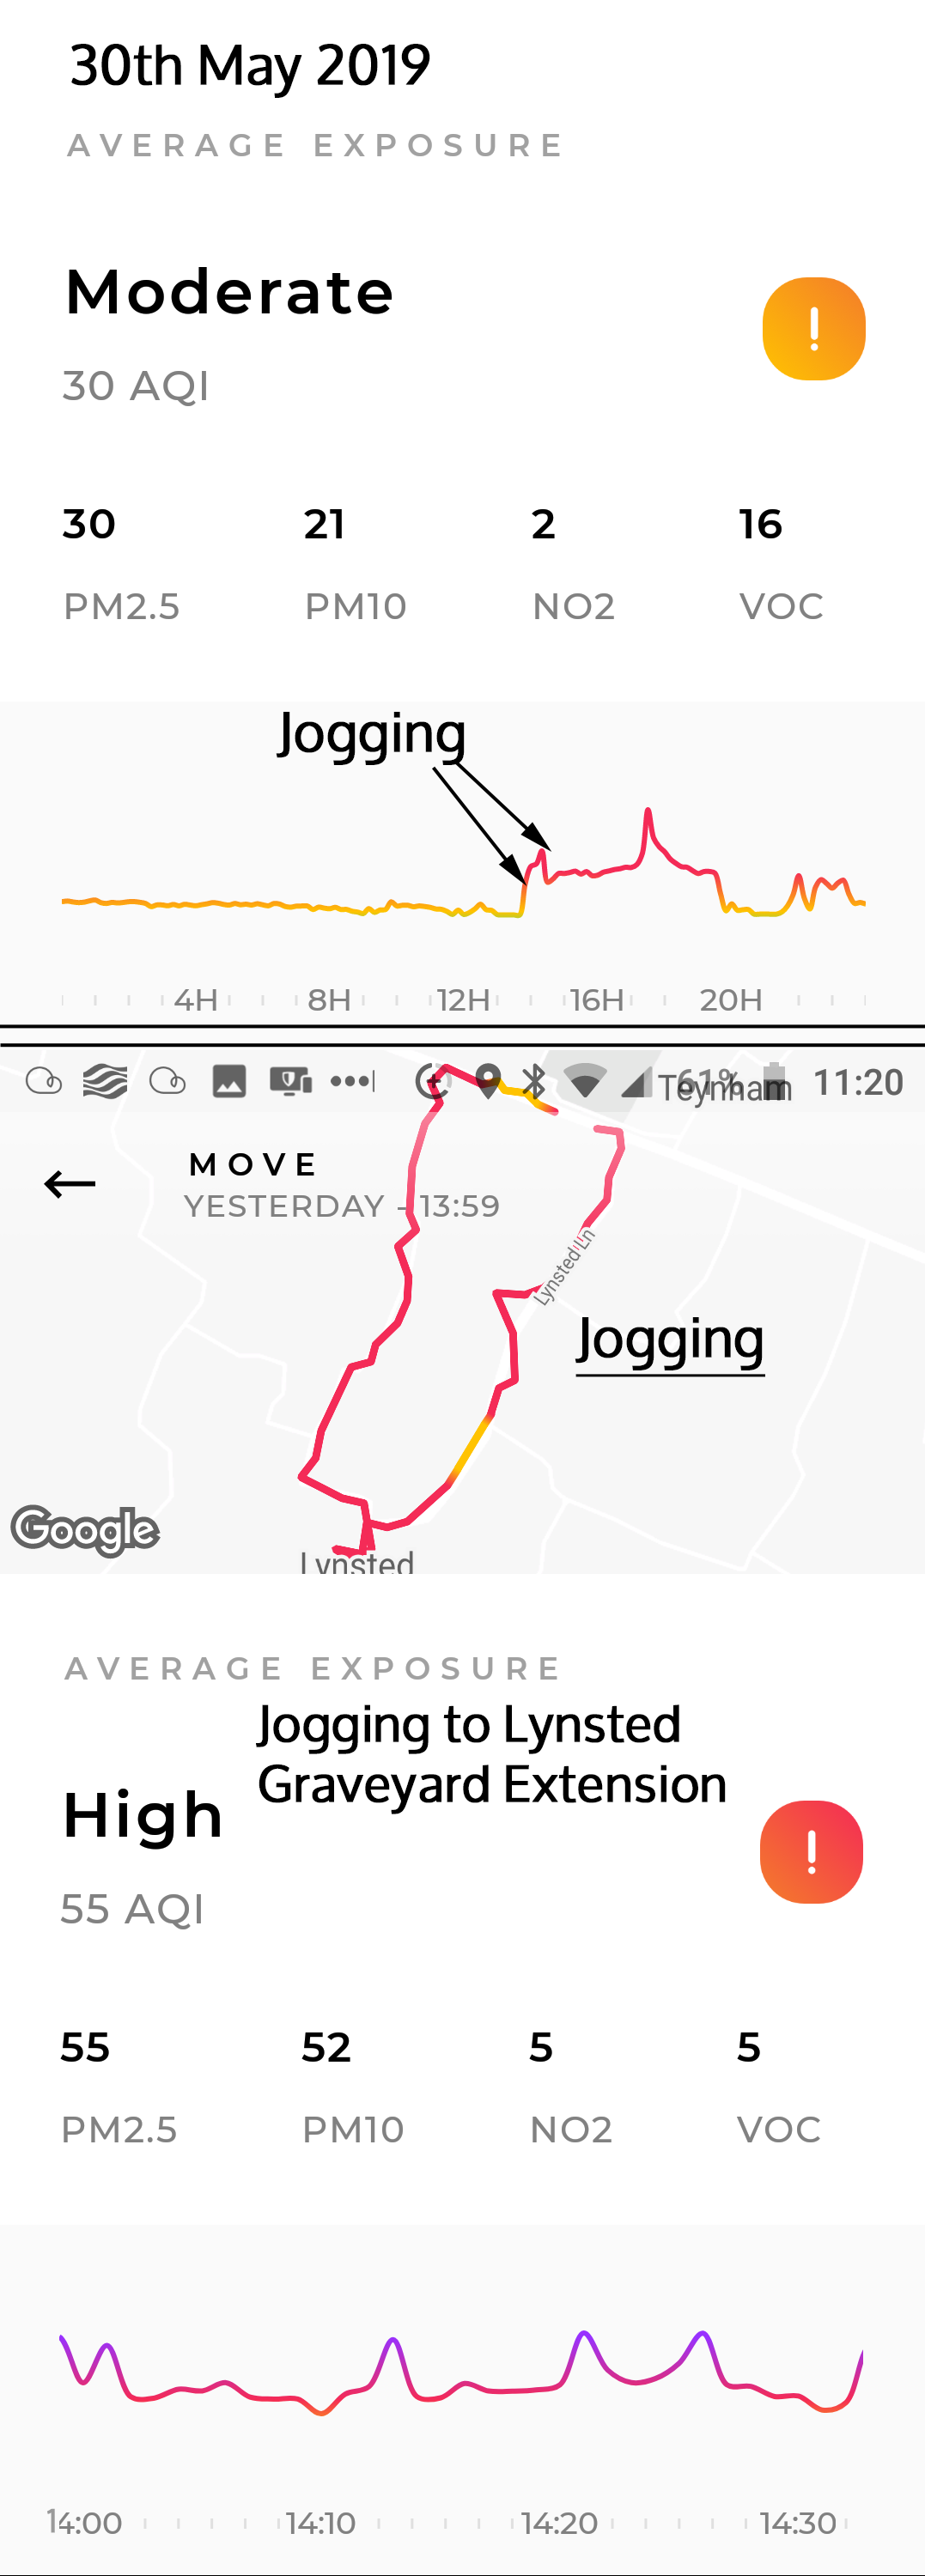
| 30th May Flow 1 Greenstreet Flow 2 Kingsdown |
30 . |
21 |
2 |
16 |
MODERATE | Graph: Wind: WSW - SW (19kph). Rain 0.50mm | ||
| 5 | 13 | 3 | 13 | LOW | Graph: "Low" except on the A2 and Sittingbourne. | |||
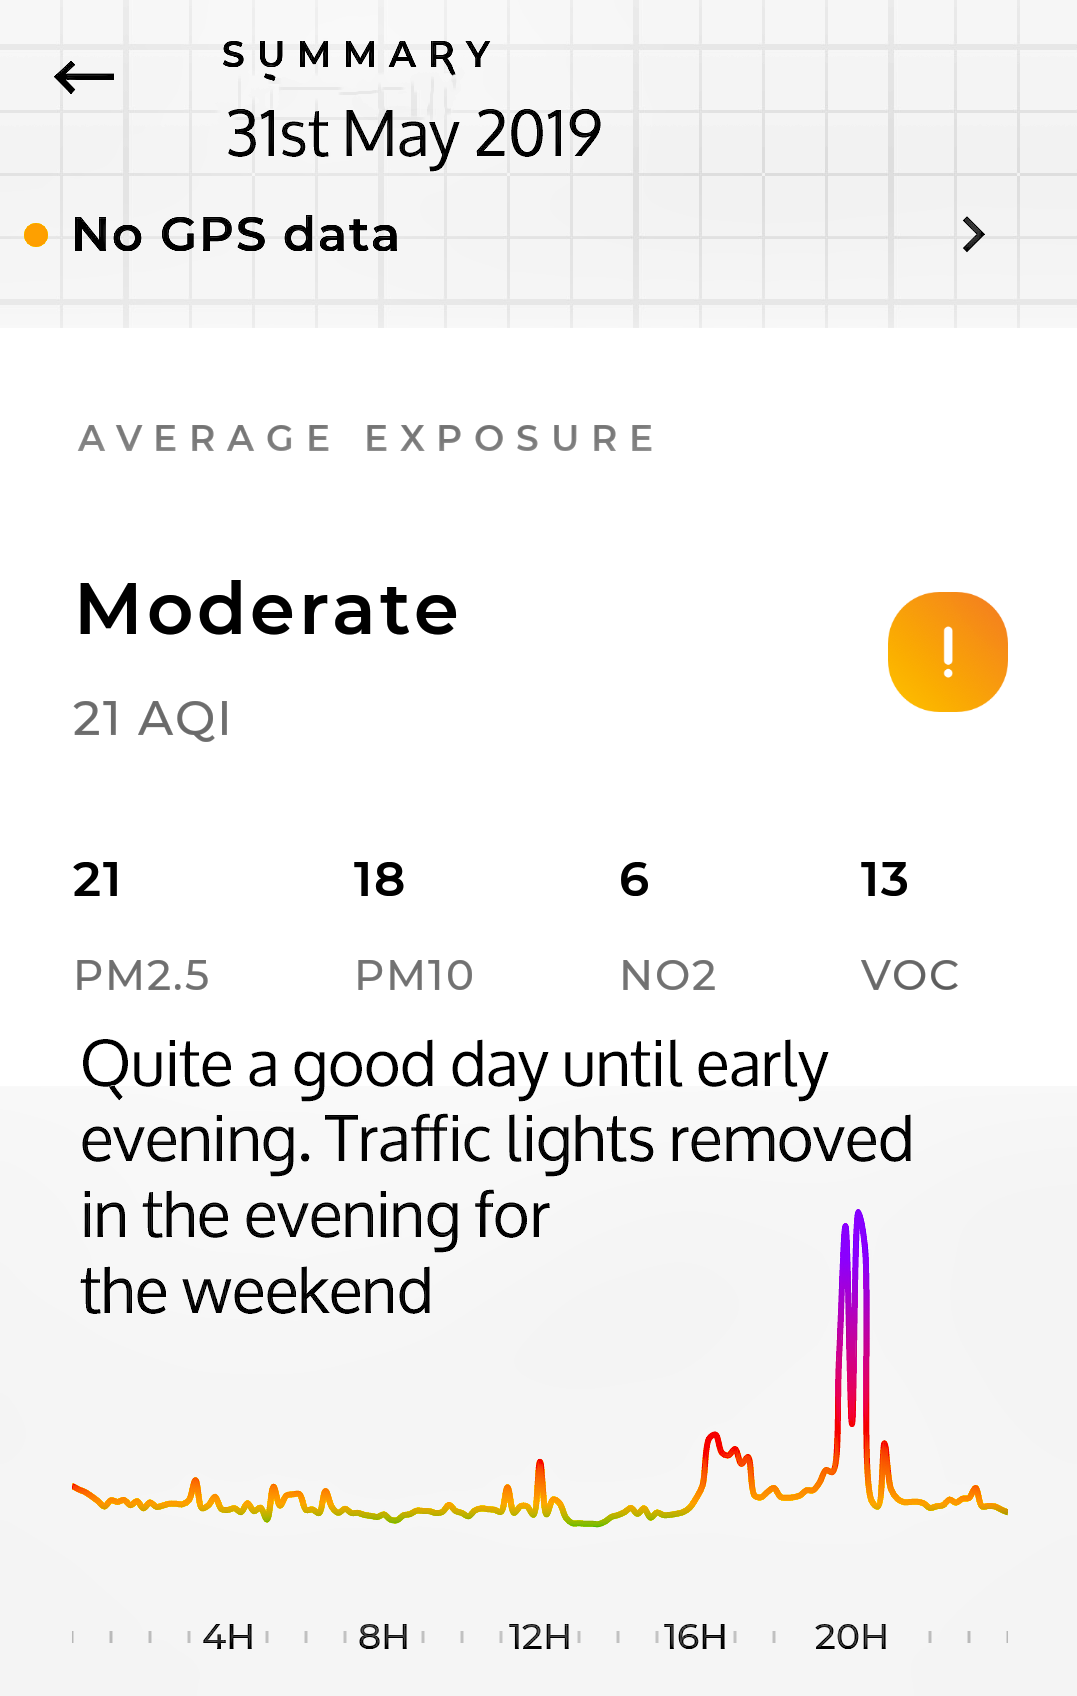
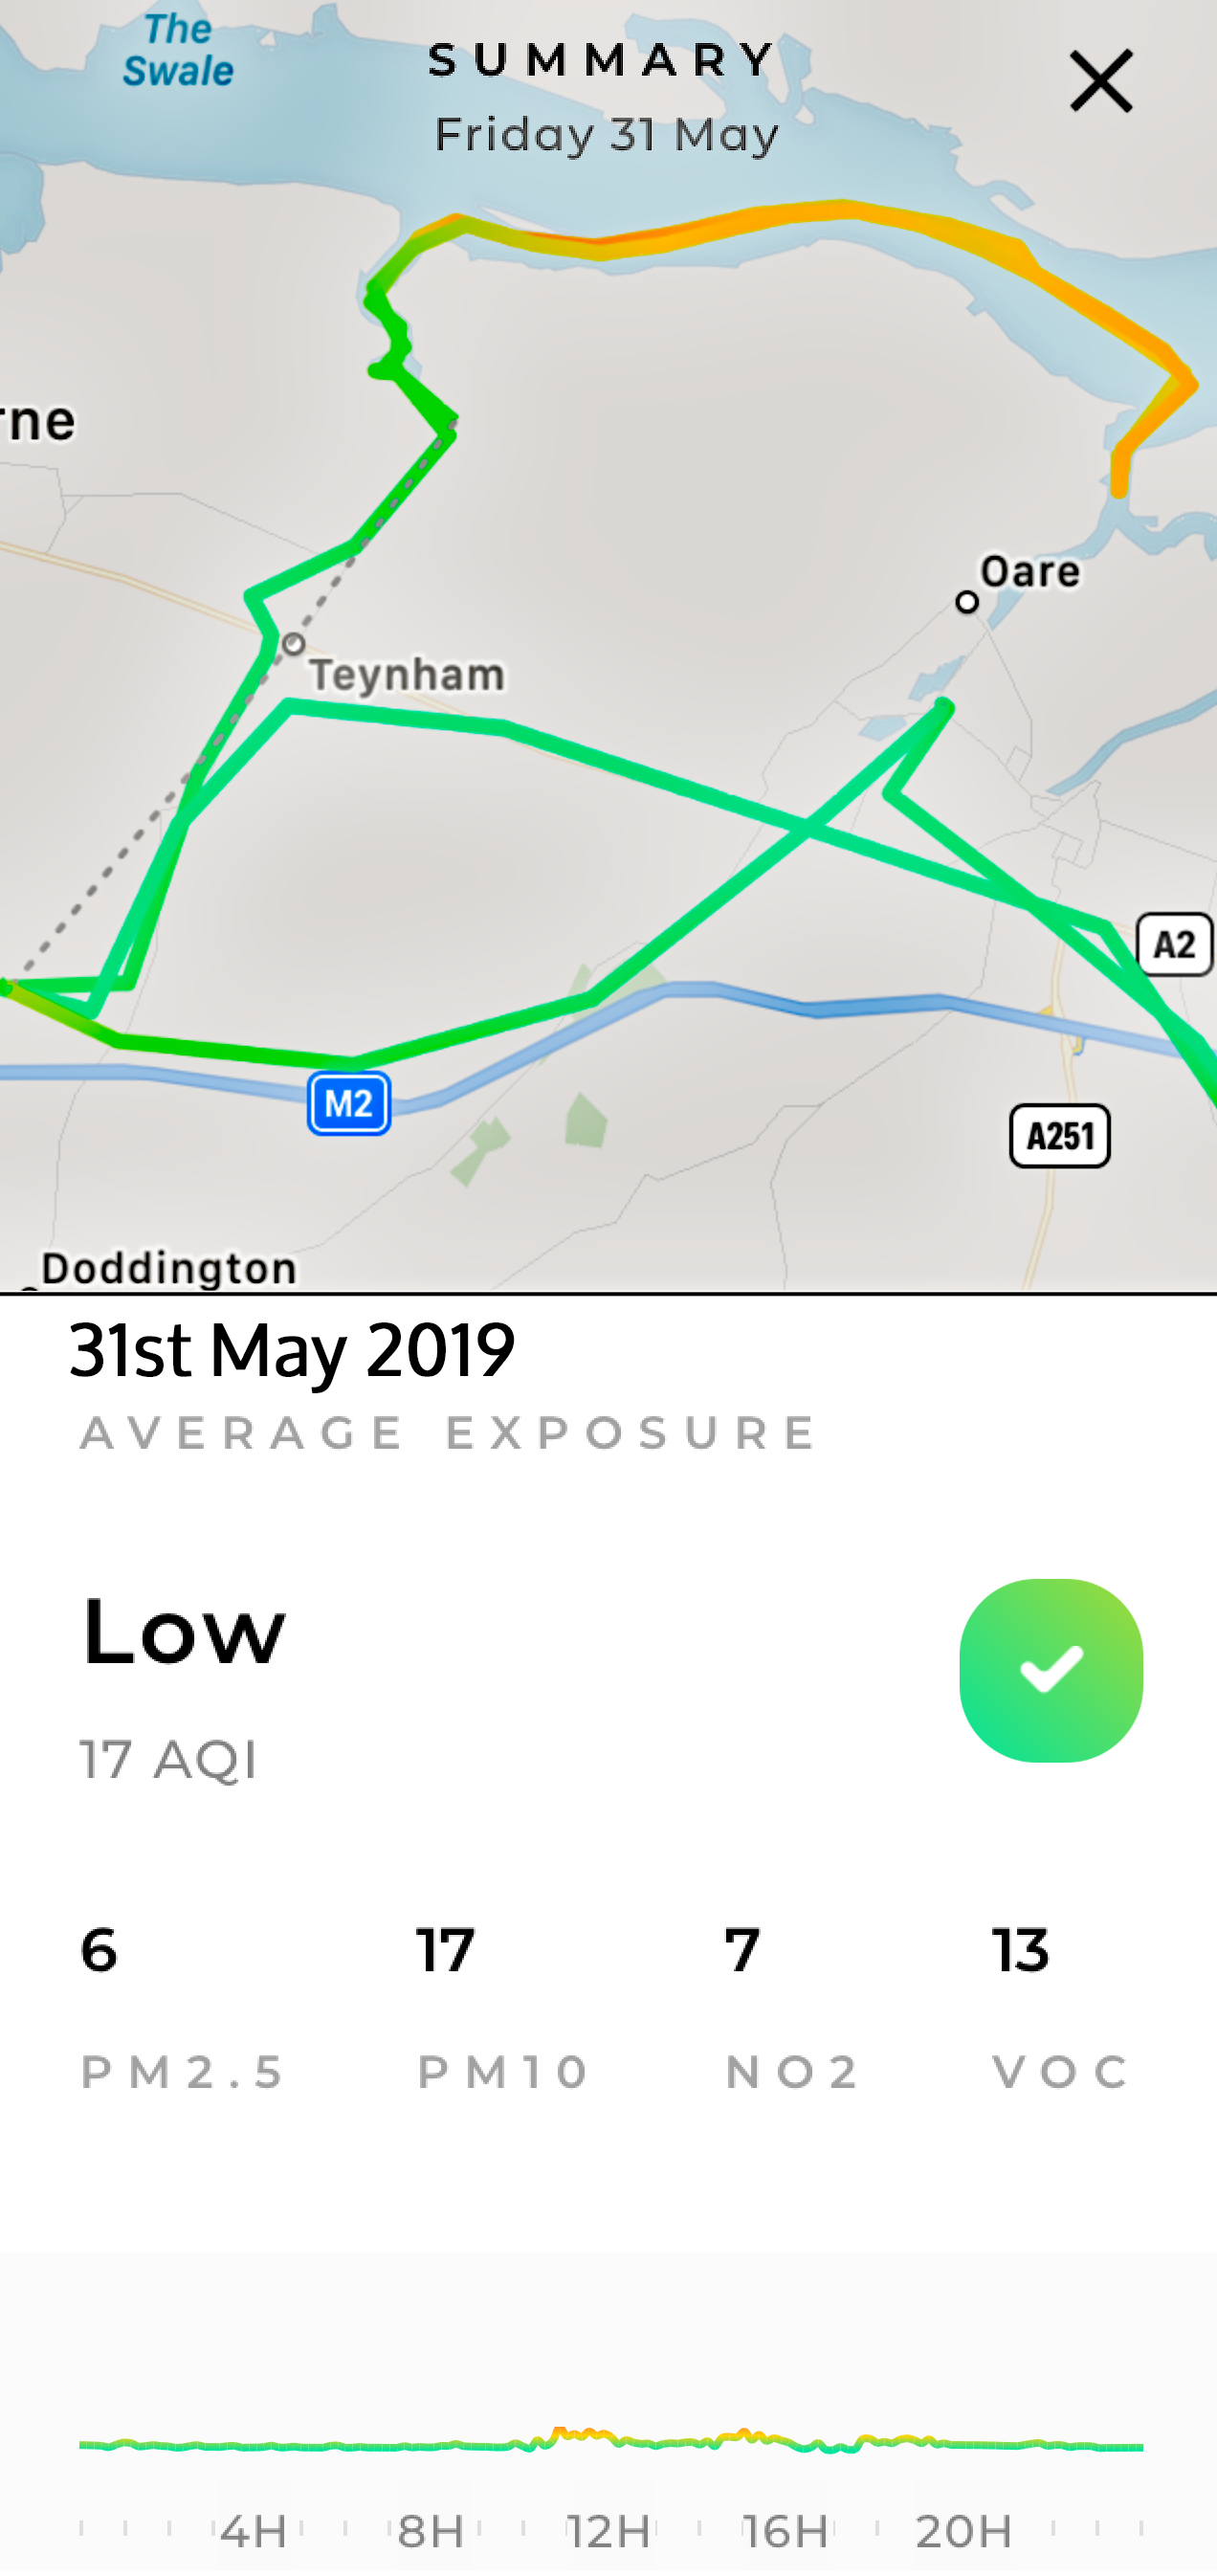
| 31st May Flow 1 Greenstreet Flow 2 Kingsdown |
21 . |
18 |
6 |
13 |
MODERATE | Graph: Wind: WSW - SW (17kph). Rain:0.80mm | ||
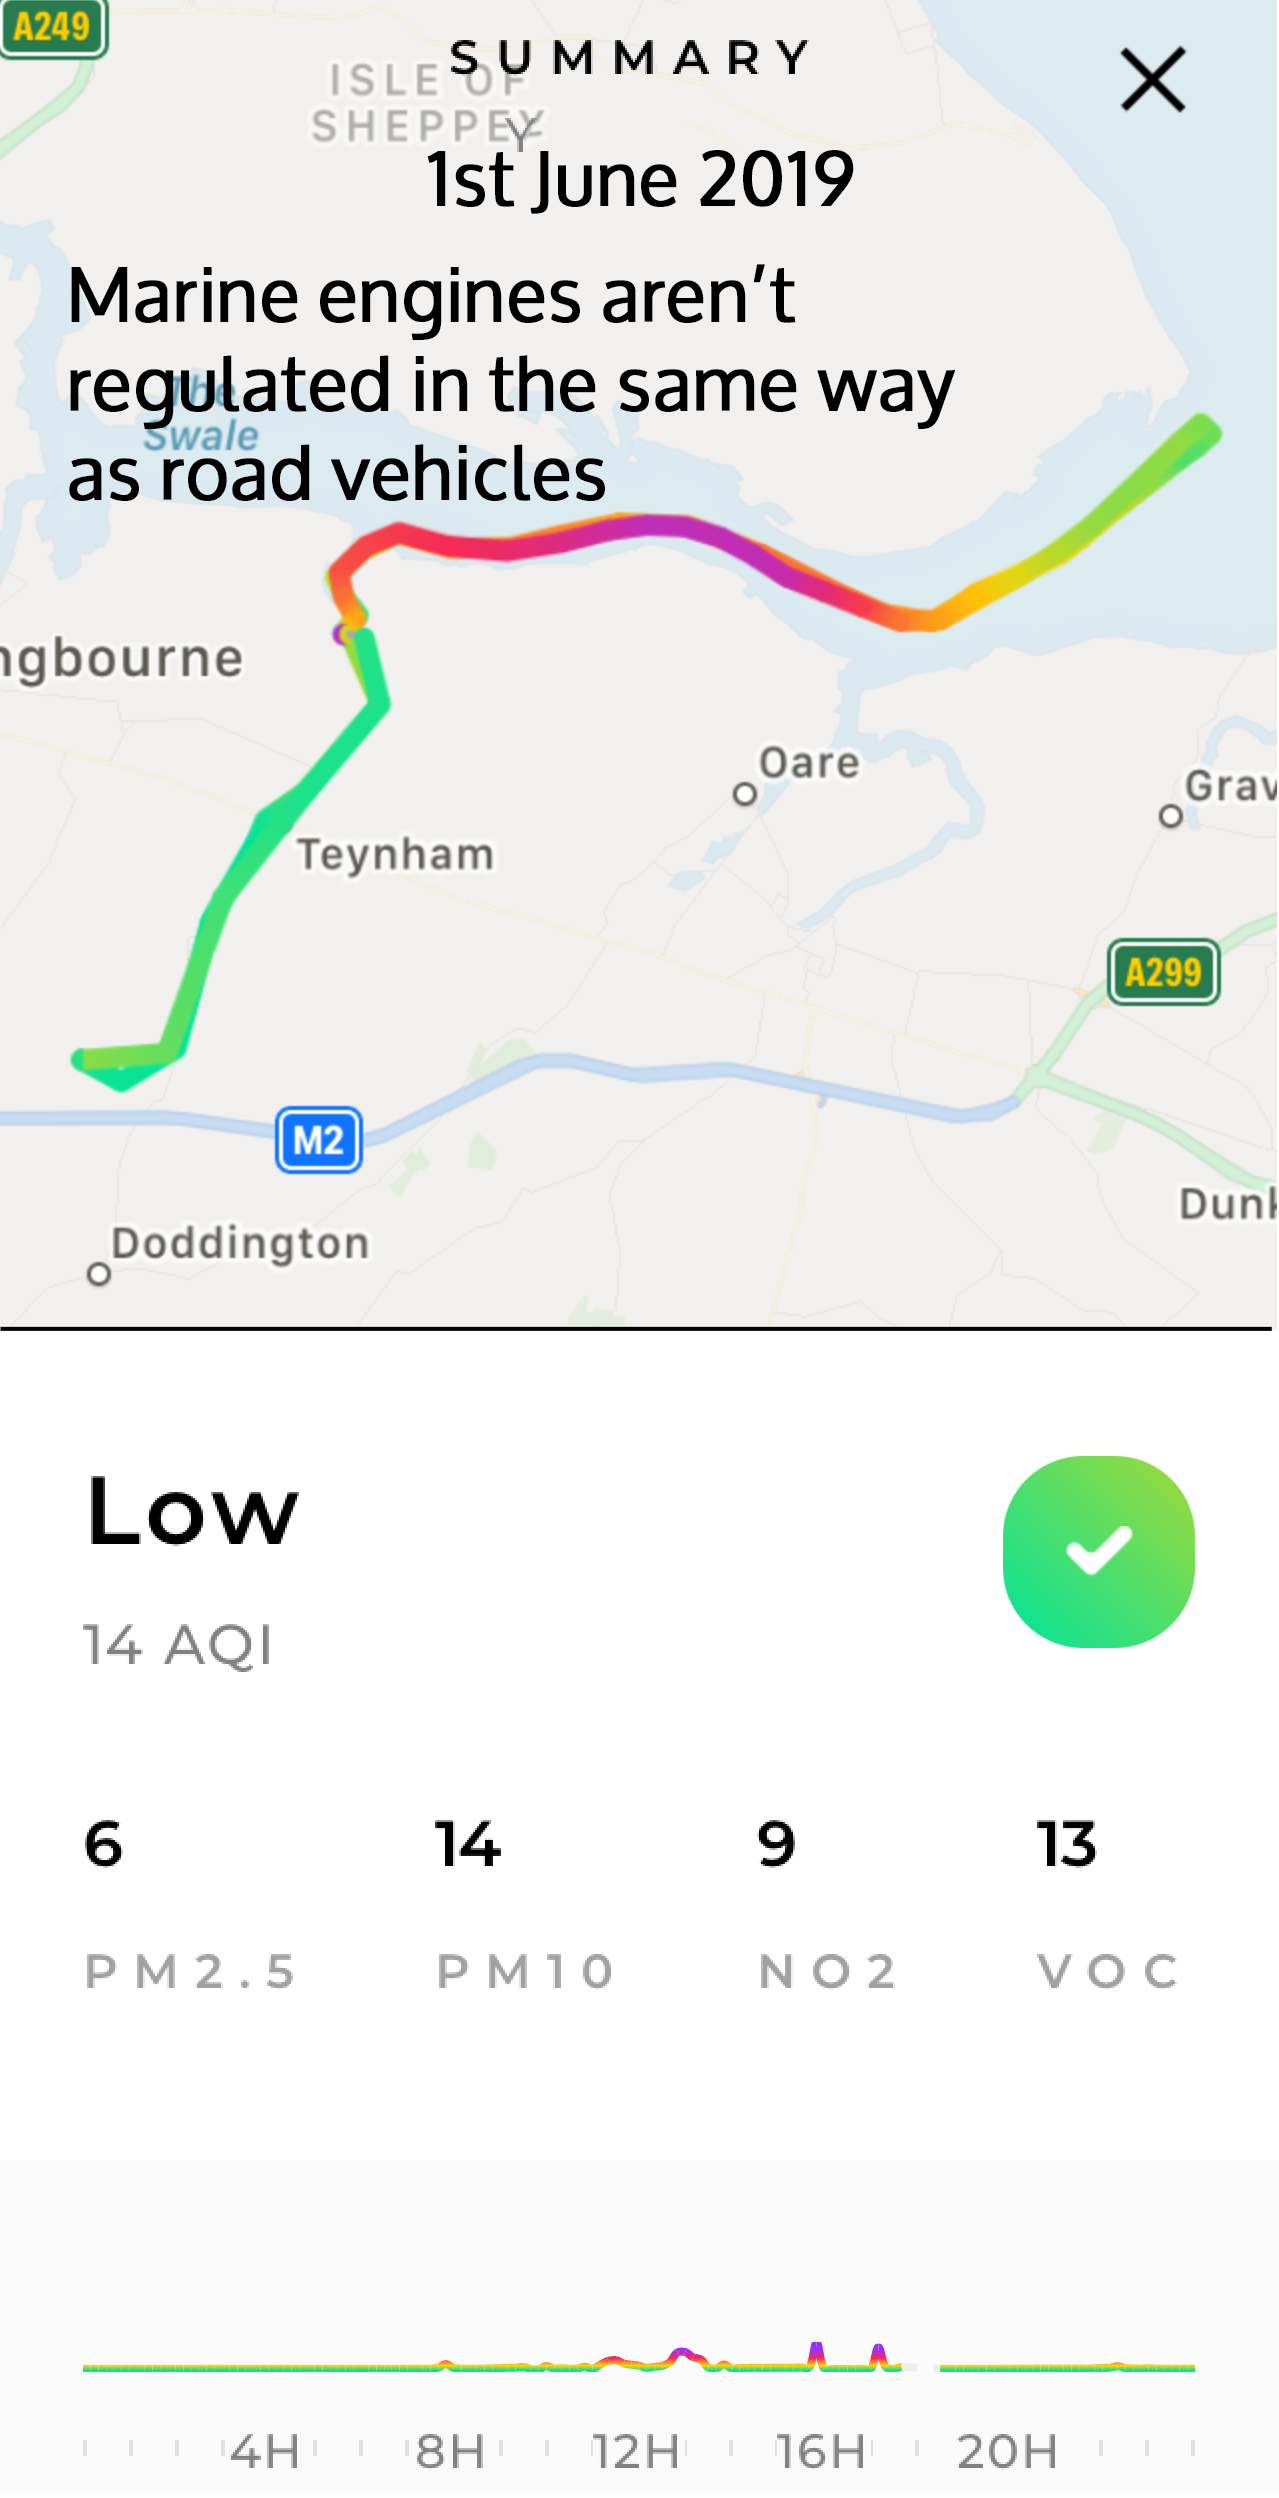
| 6 | 17 | 7 | 13 | LOW | Graph: The map confirms that marine craft emissions are not restricted in the same way that road vehicles are! | |||
| JUNE 2019 | ||||||||
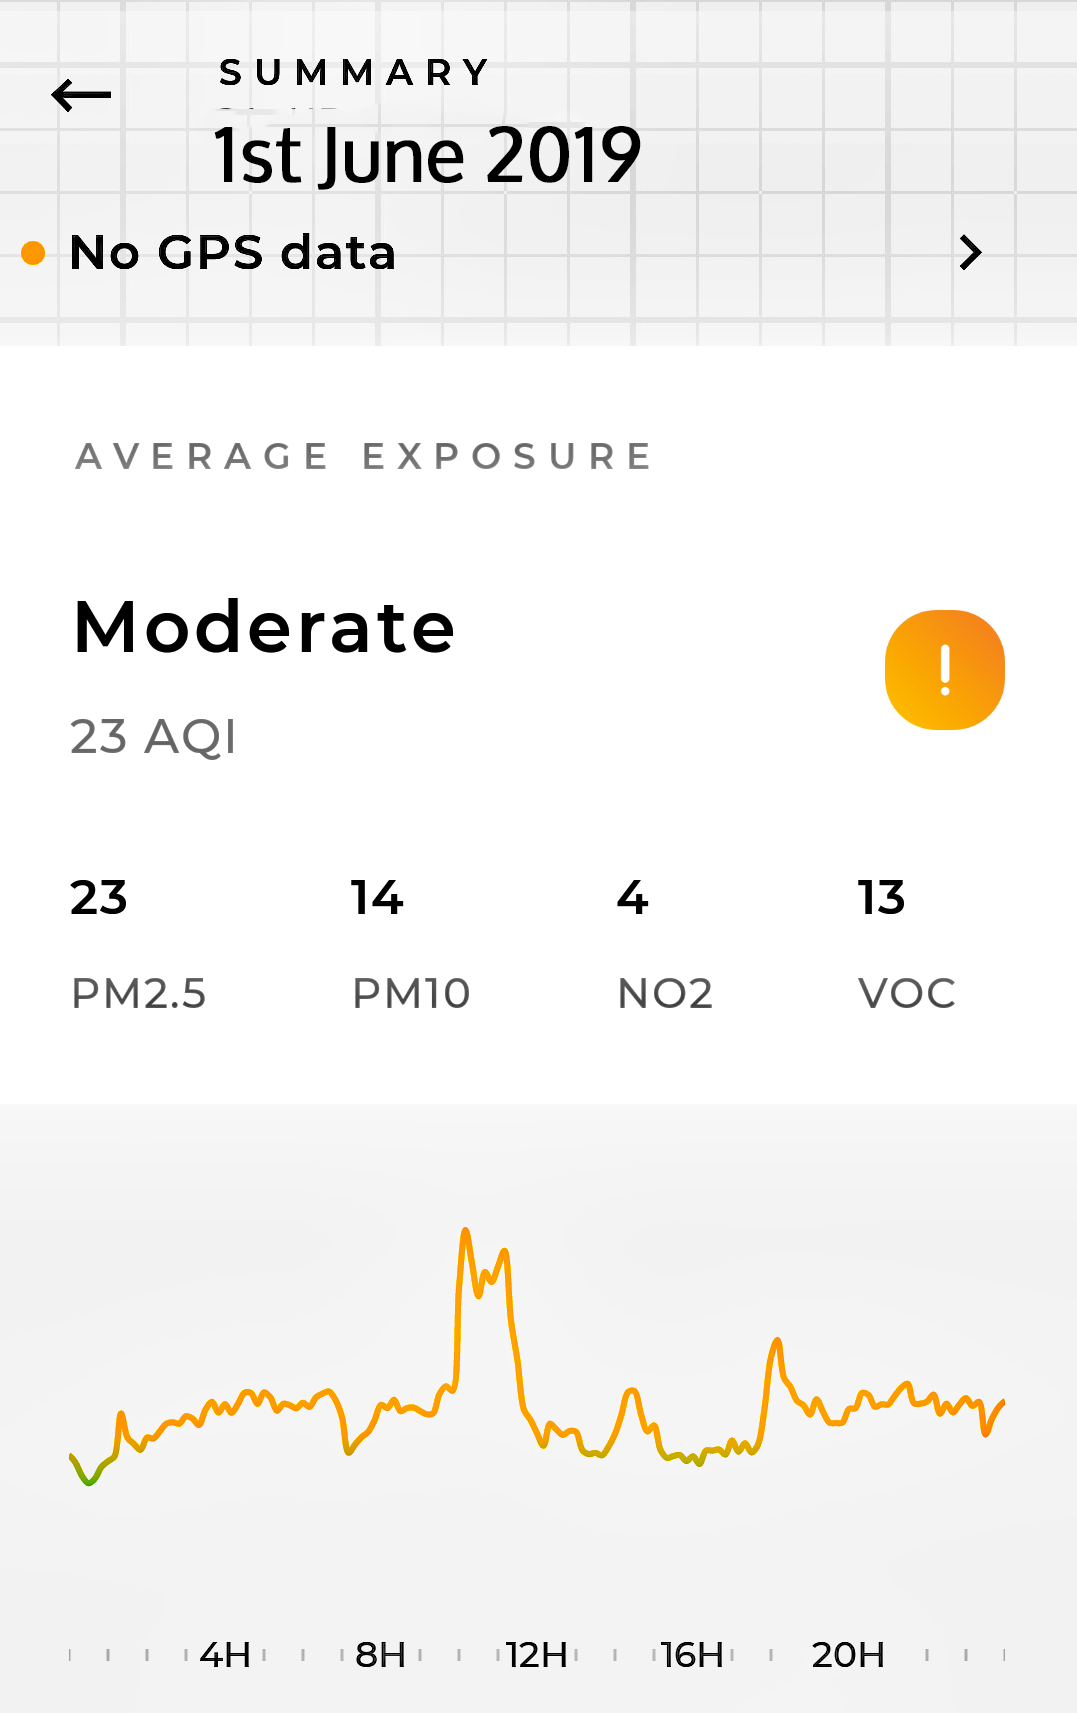
| 1st June Flow 1 Greenstreet Flow 2 Kingsdown |
23 |
14 |
4 |
13 |
MODERATE | Graph and map: Traffic lights removed. Small peaks at 'normal' times. Wind: SW - S - SSE (11kph). Rain: Dry. | ||
| 6 | 14 | 9 | 13 | LOW | Graph and map: A second day toillustrate how seriously polluted our waterways can be - without the same pollutant restrictions as landlubbers must adhere to. | |||
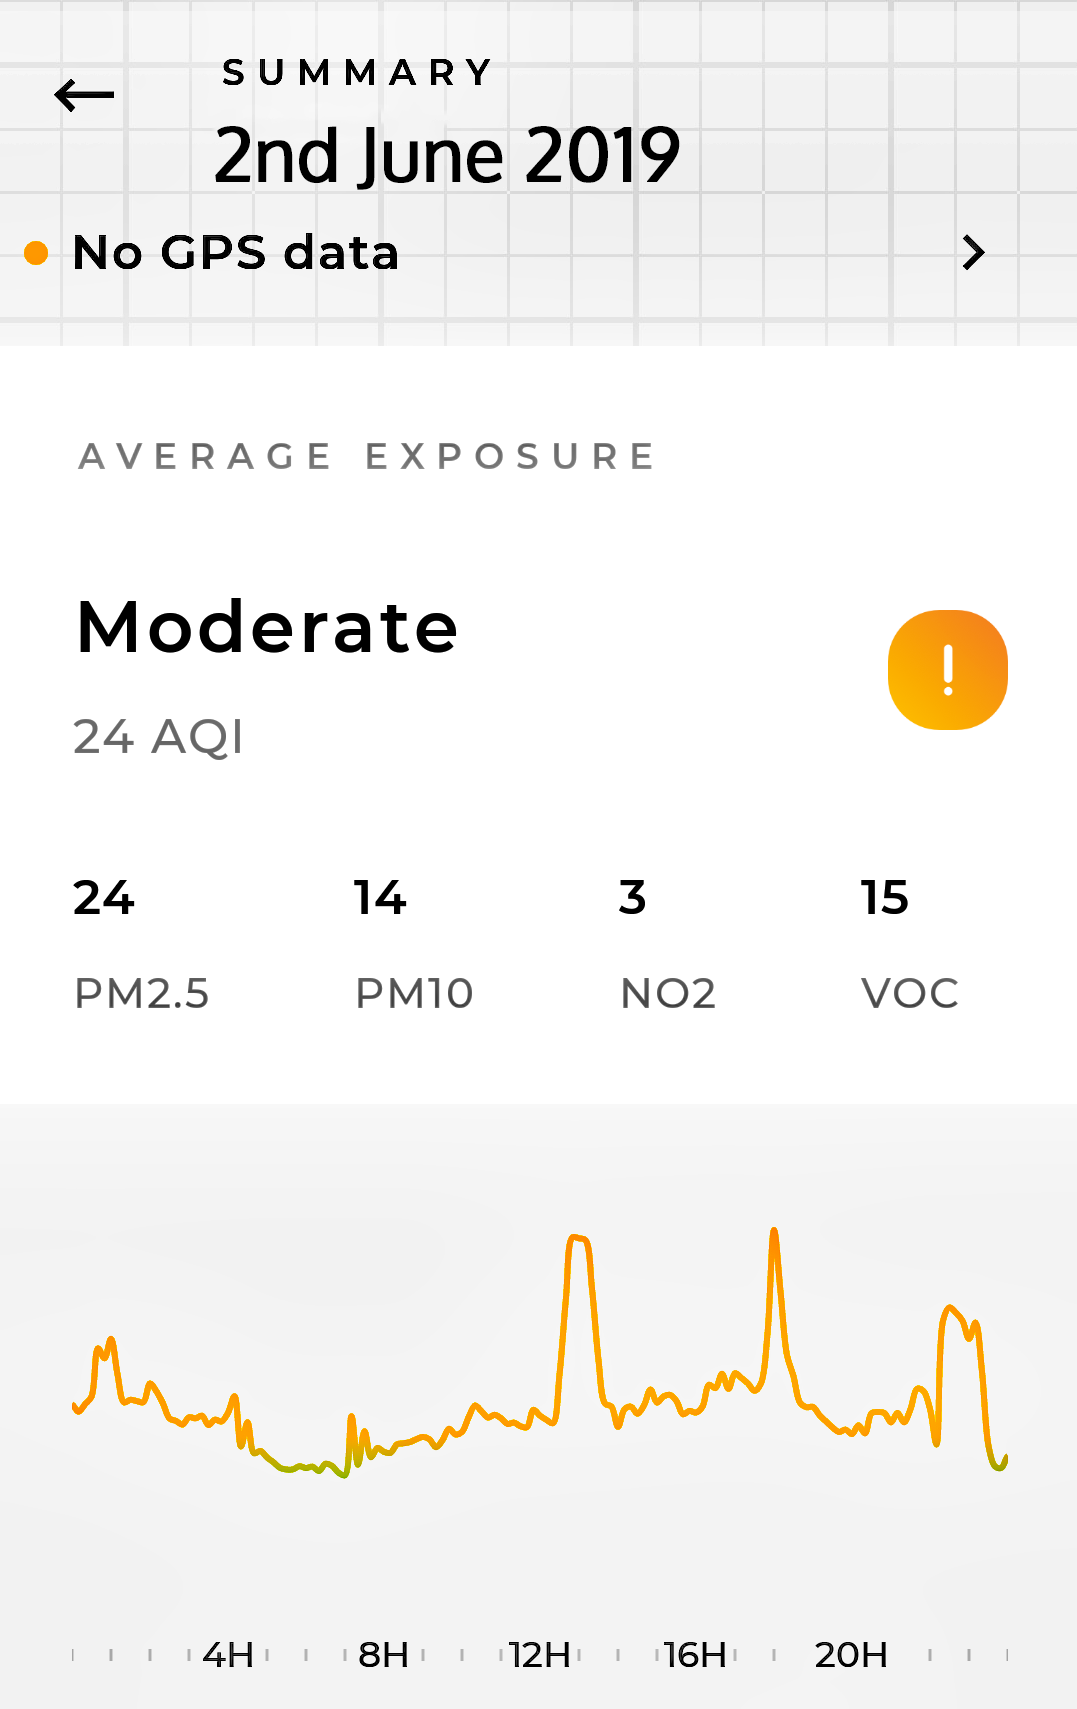
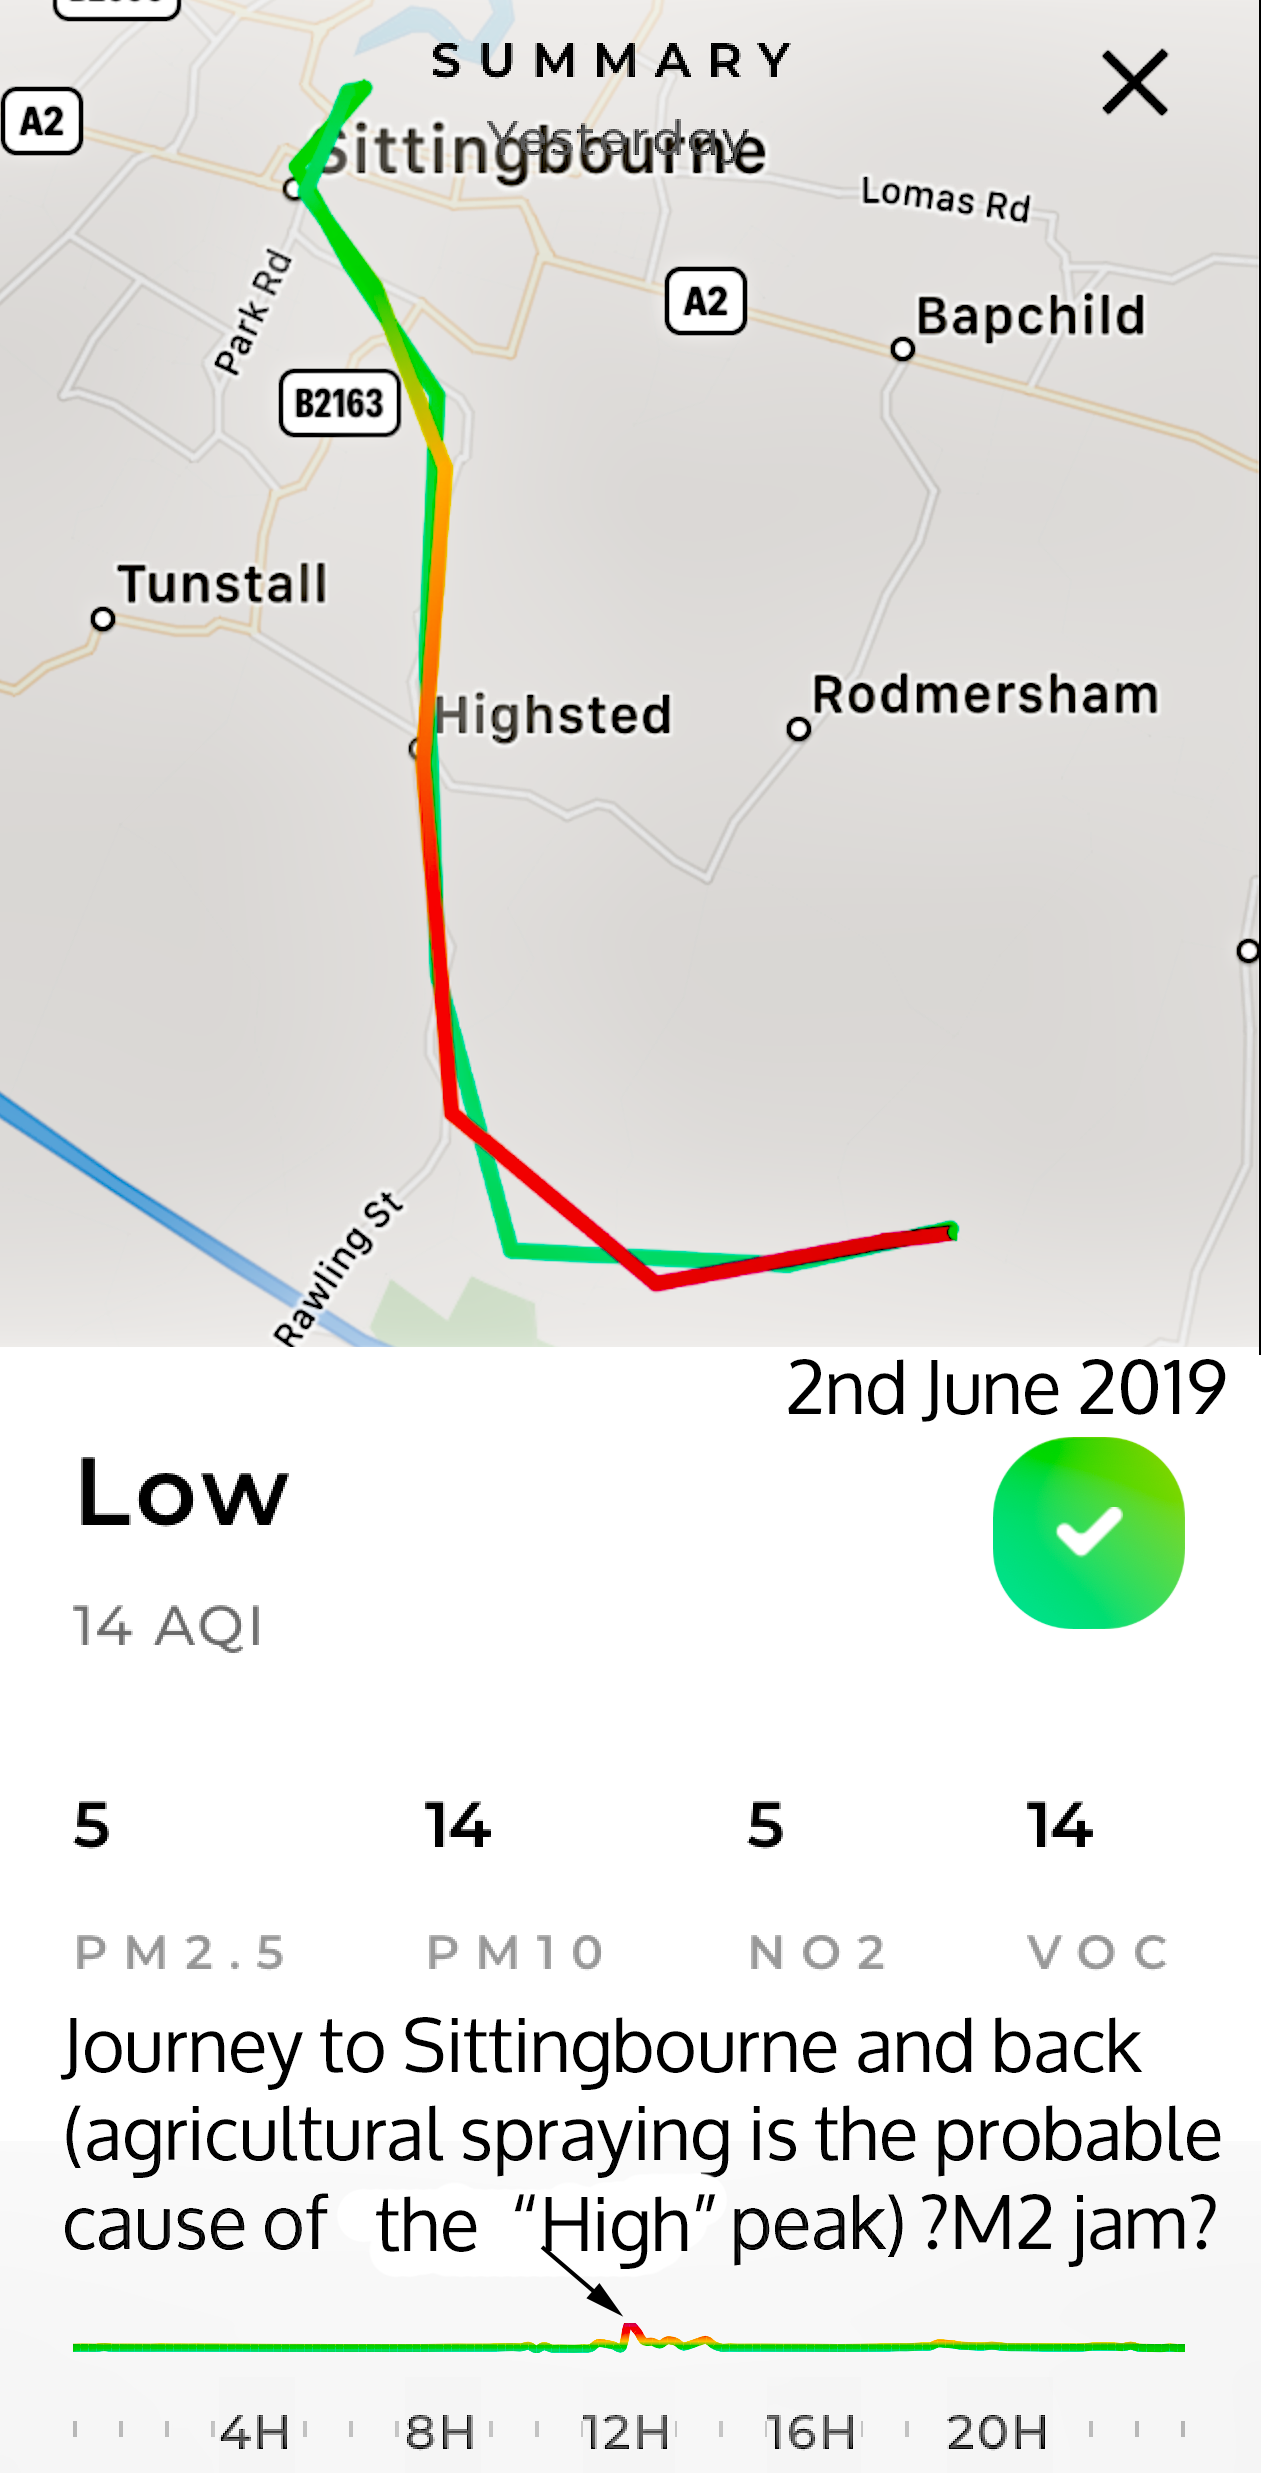
| 2nd June Flow 1 Greenstreet Flow 2 Kingsdown |
24 |
14 |
3 |
15 |
MODERATE | Graph: Wind: SSE - SSW - SW (22kph). Rain: Dry. | ||
| 5 | 14 | 5 | 14 | LOW | Graph and Map: High levels of pollution on a return journey from Sittingbourne alongside the M2. Perhaps a jam? Pungent smells suggest that agricultural spraying was a potential source? Otherwise, a good day to be enjoying the countryside. | |||
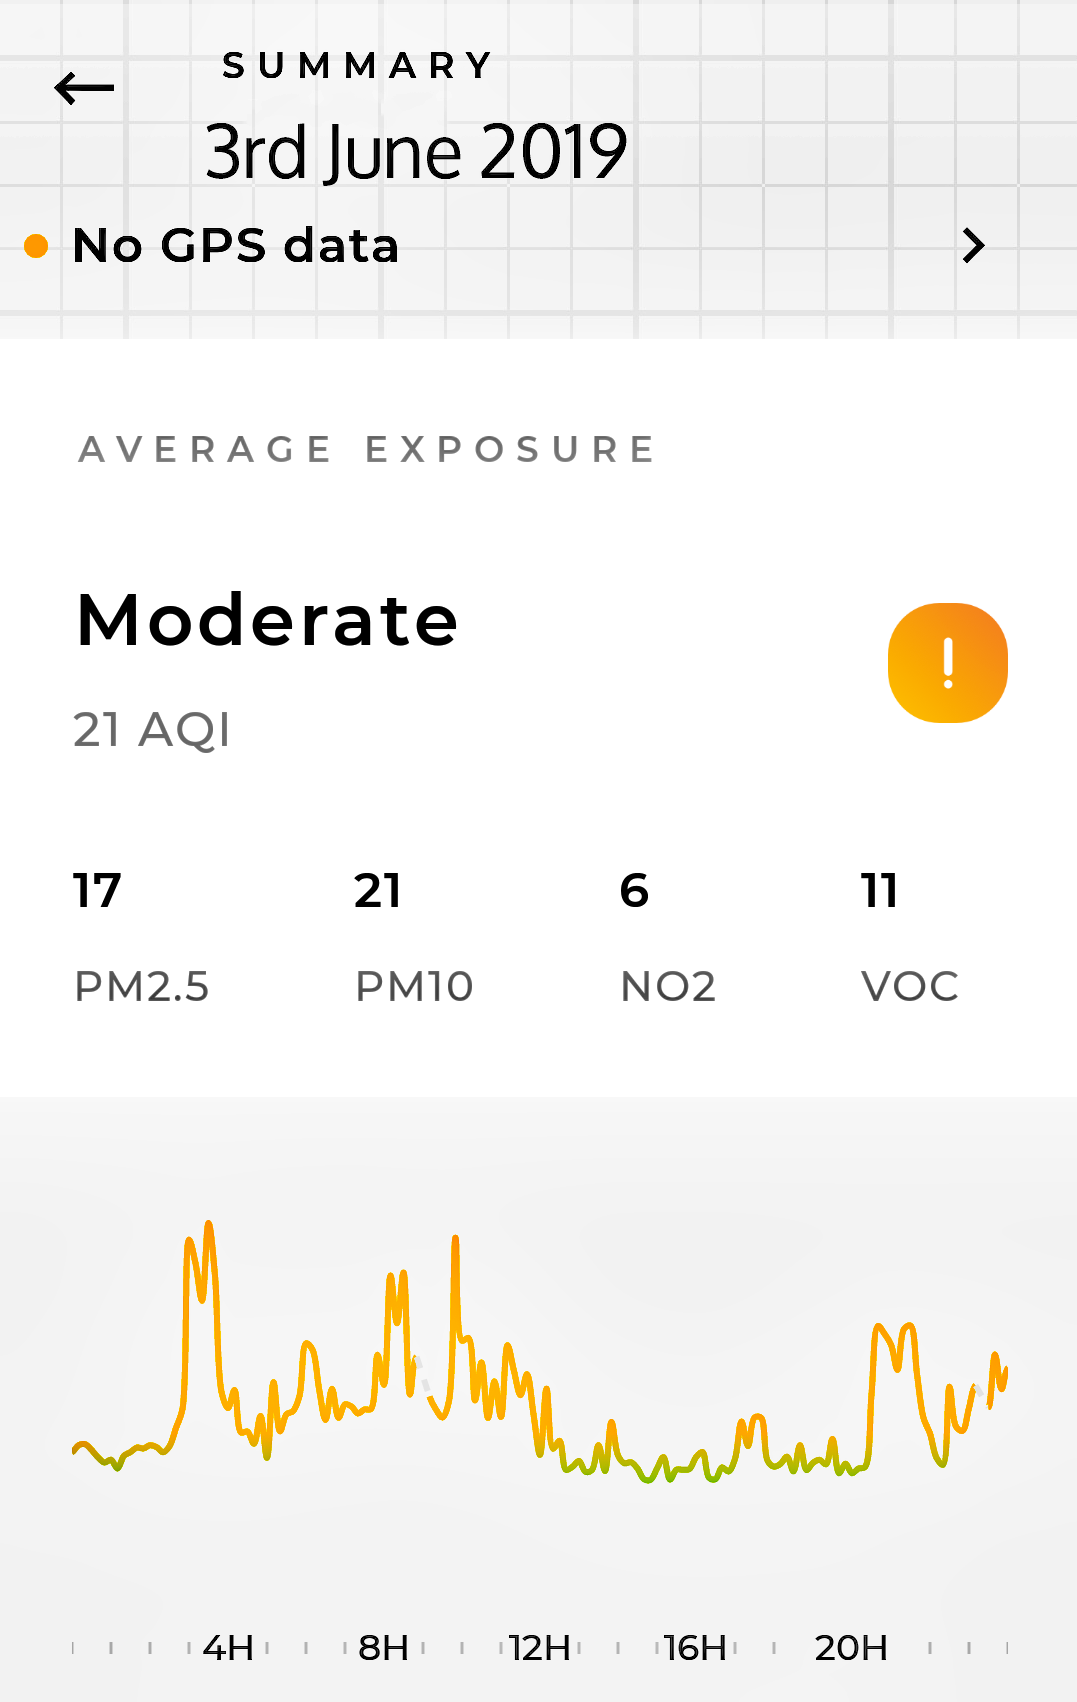
| 3rd June Flow 1 Greenstreet |
17 |
21 |
6 |
11 |
MODERATE | Graph: Wind: W - WSW - SW (18kph). Rain:1.10mm. Traffic flowed fairly evenly inspite of the traffic lights at the other end of Greenstreet | ||
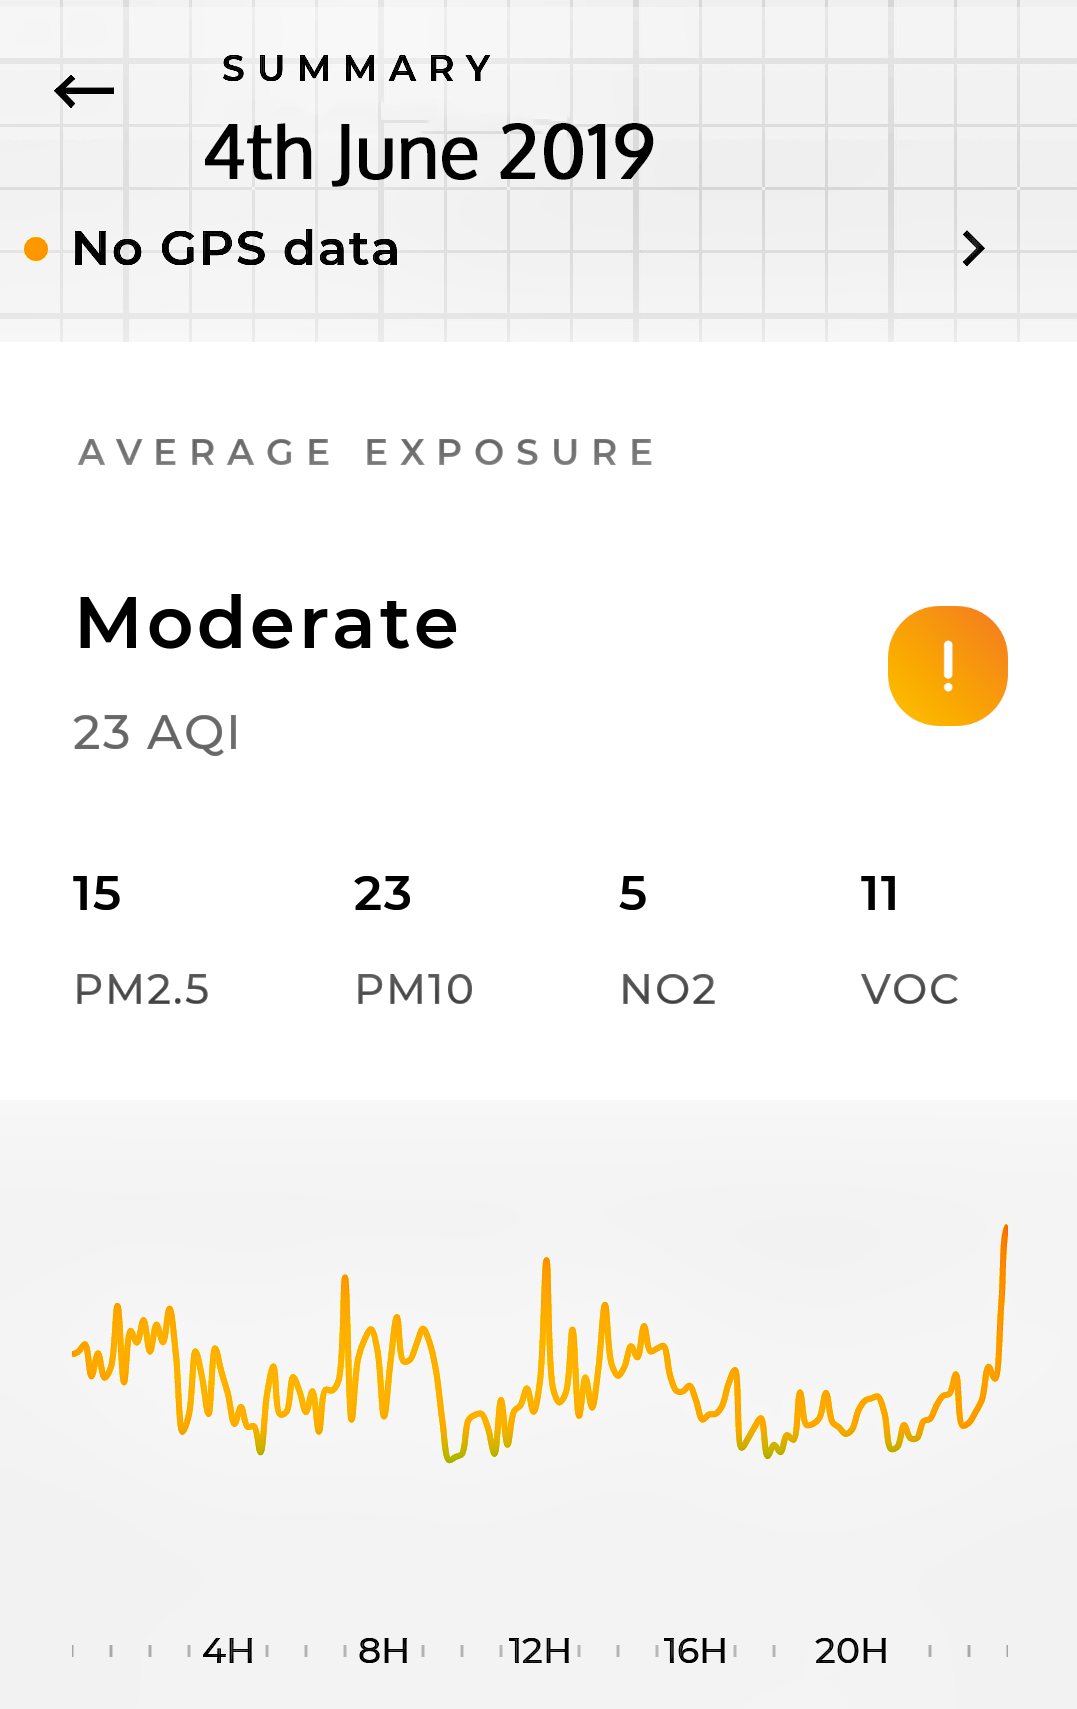
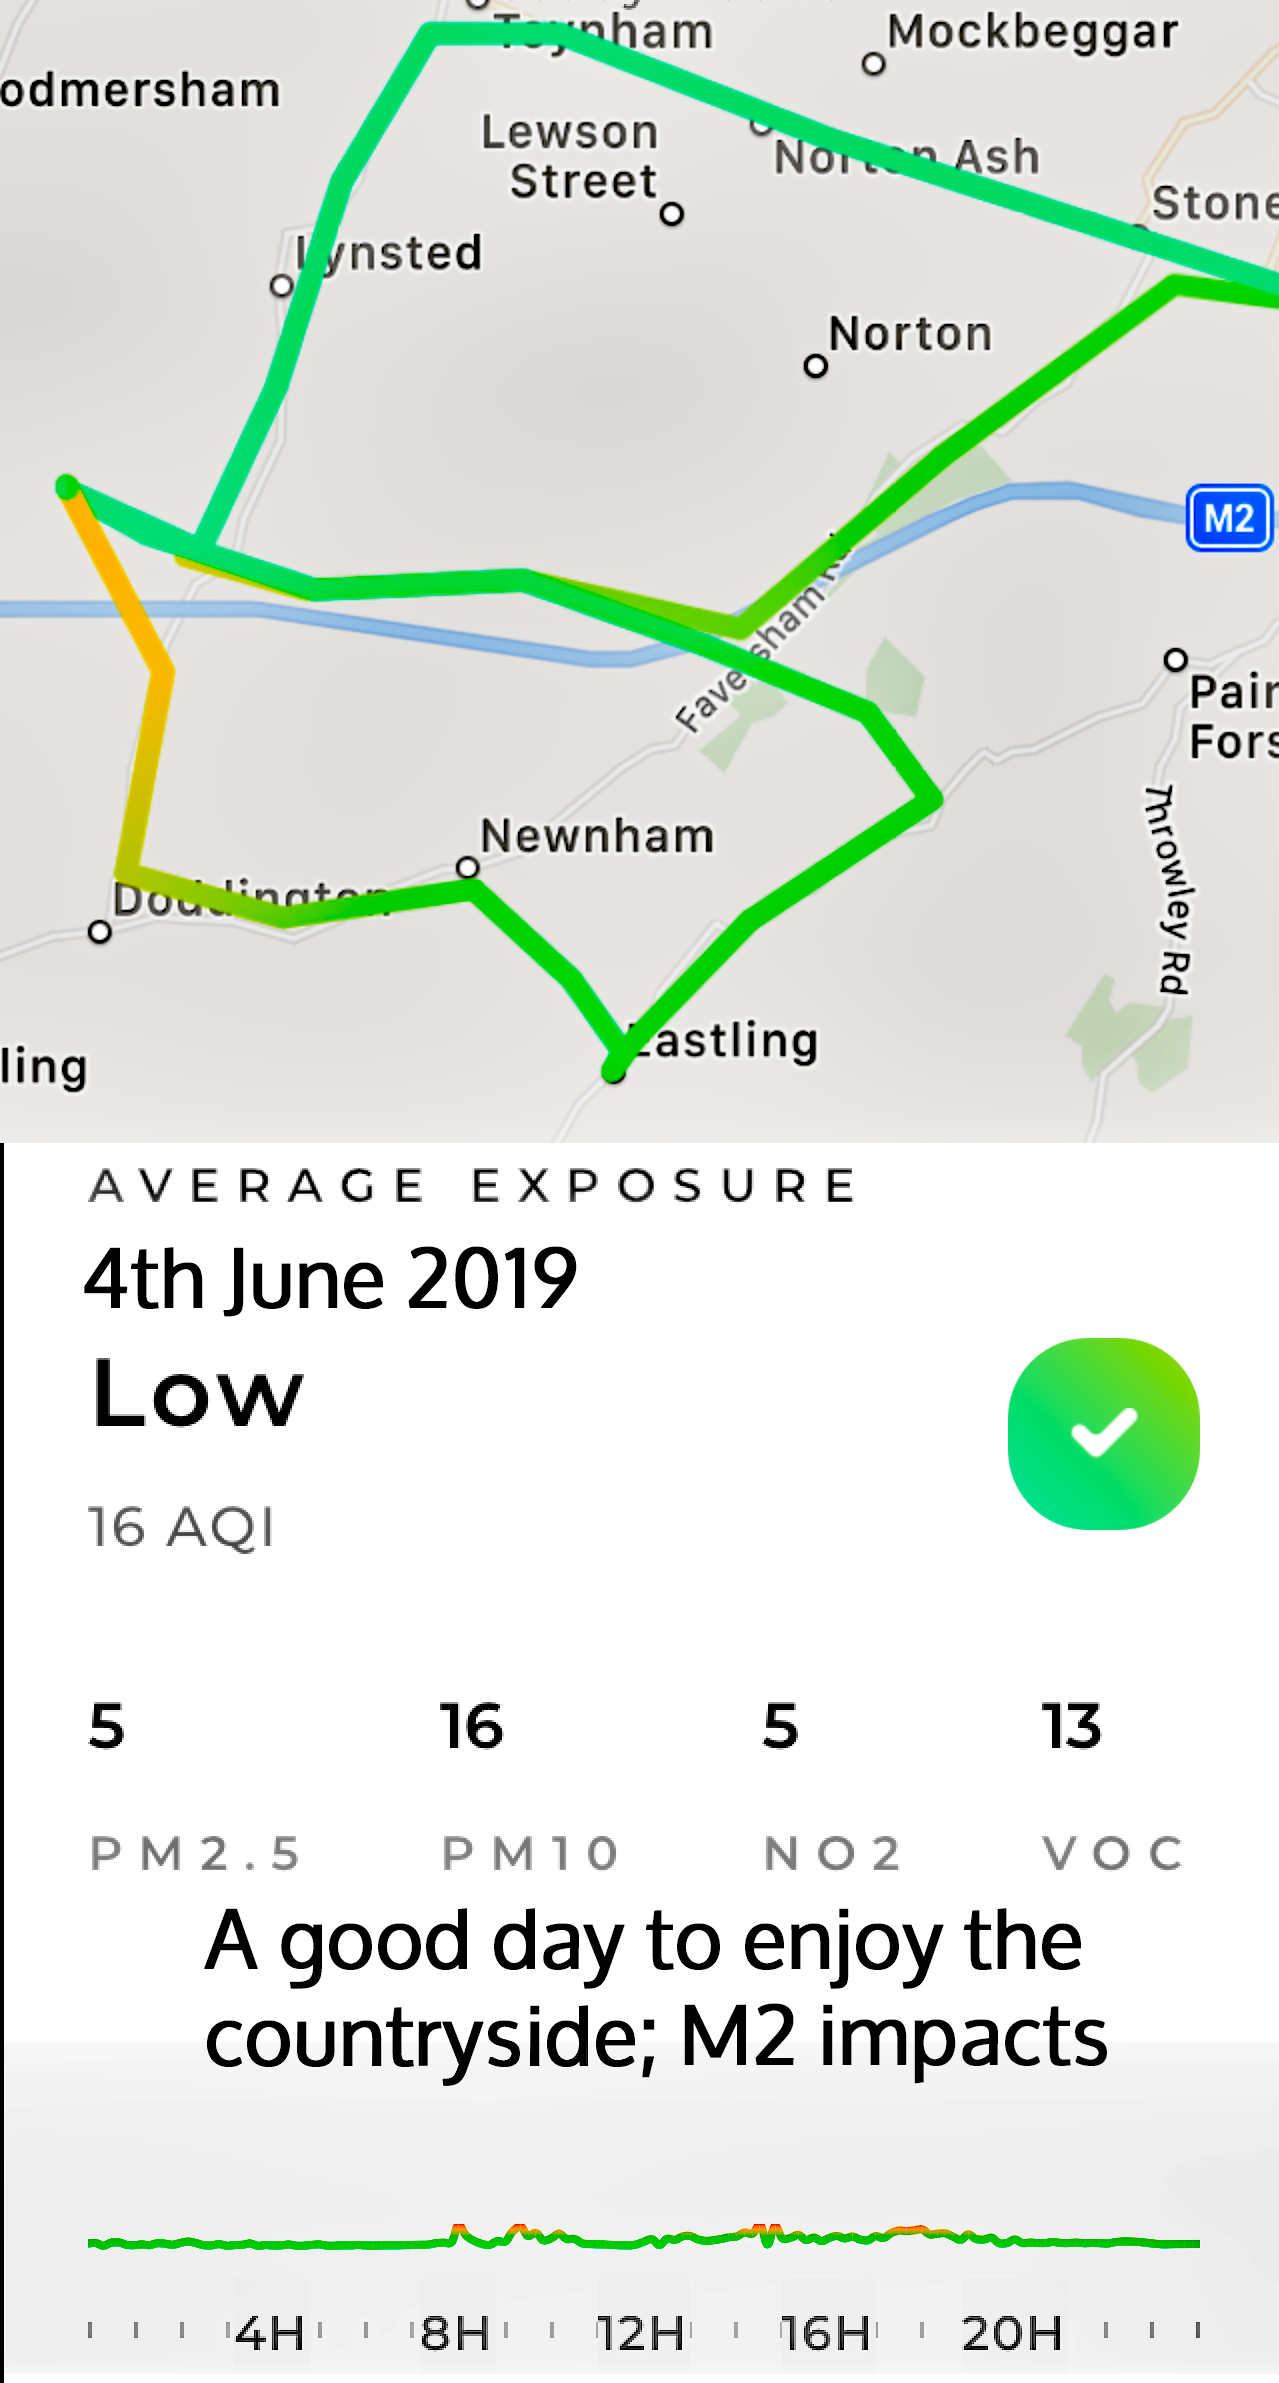
| 4th June Flow 1 Greenstreet Flow 2 Kingsdown |
15 |
23 |
5 |
11 |
MODERATE | Graph: Wind: SSW - SE - SSW - S (13kph). Rain: 9.4mm (afternoon) | ||
| 5 | 16 | 5 | 13 | LOW | Graph and Map: Low pollution throughout the downland area with a small impact close to the M2 | |||
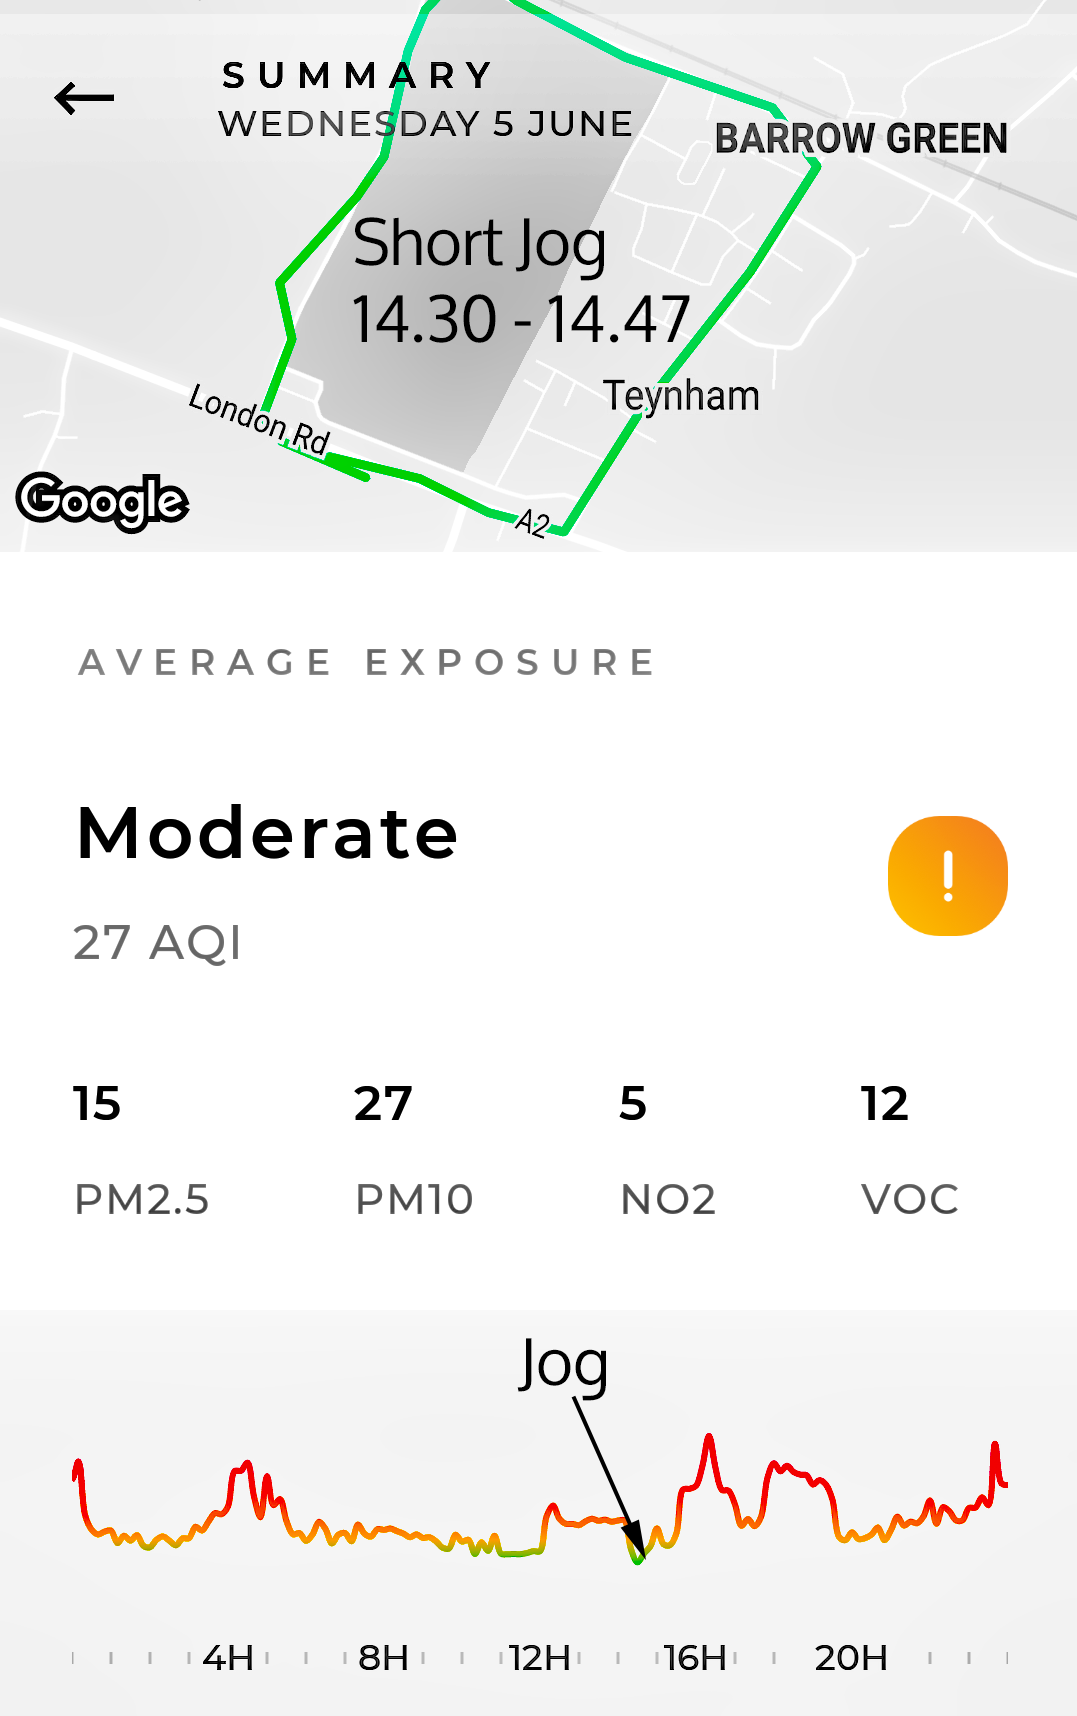
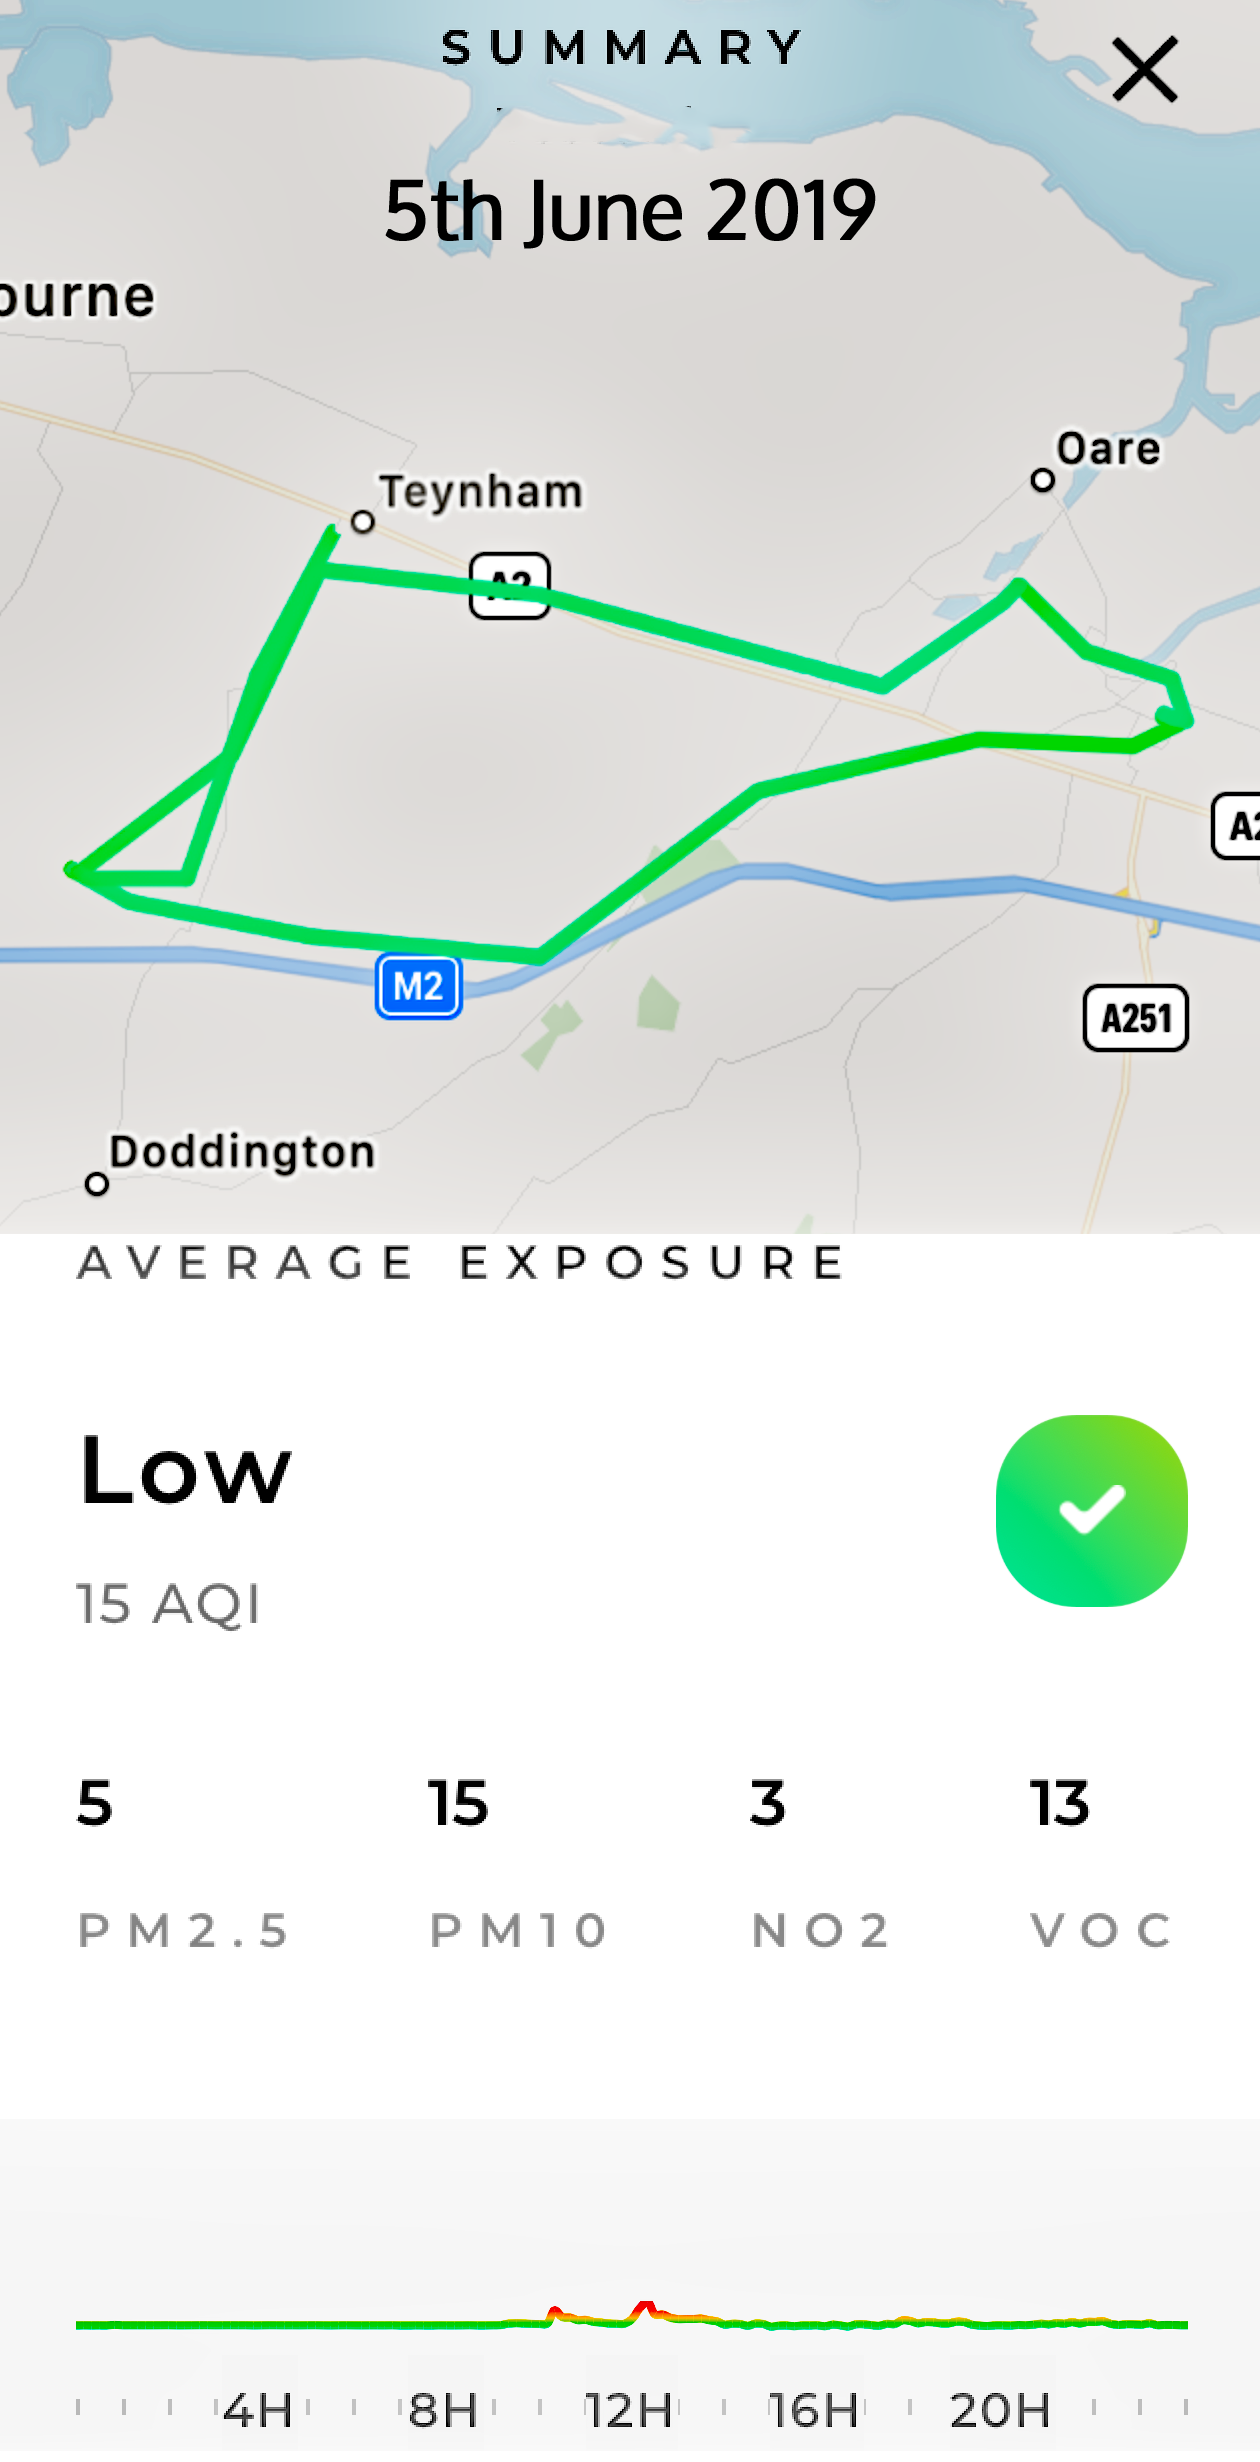
| 5th June Flow 1 Greenstreet Flow 2 Kingsdown |
15 |
27 |
5 |
12 |
MODERATE | Graph: Wind: S - SW - SSW - SW (16kph). Rain: 0.50mm Generally increasing pollution but still Moderate. | ||
| 5 | 15 | 3 | 13 | LOW | Graph and Map: A good day in the countryside. | |||
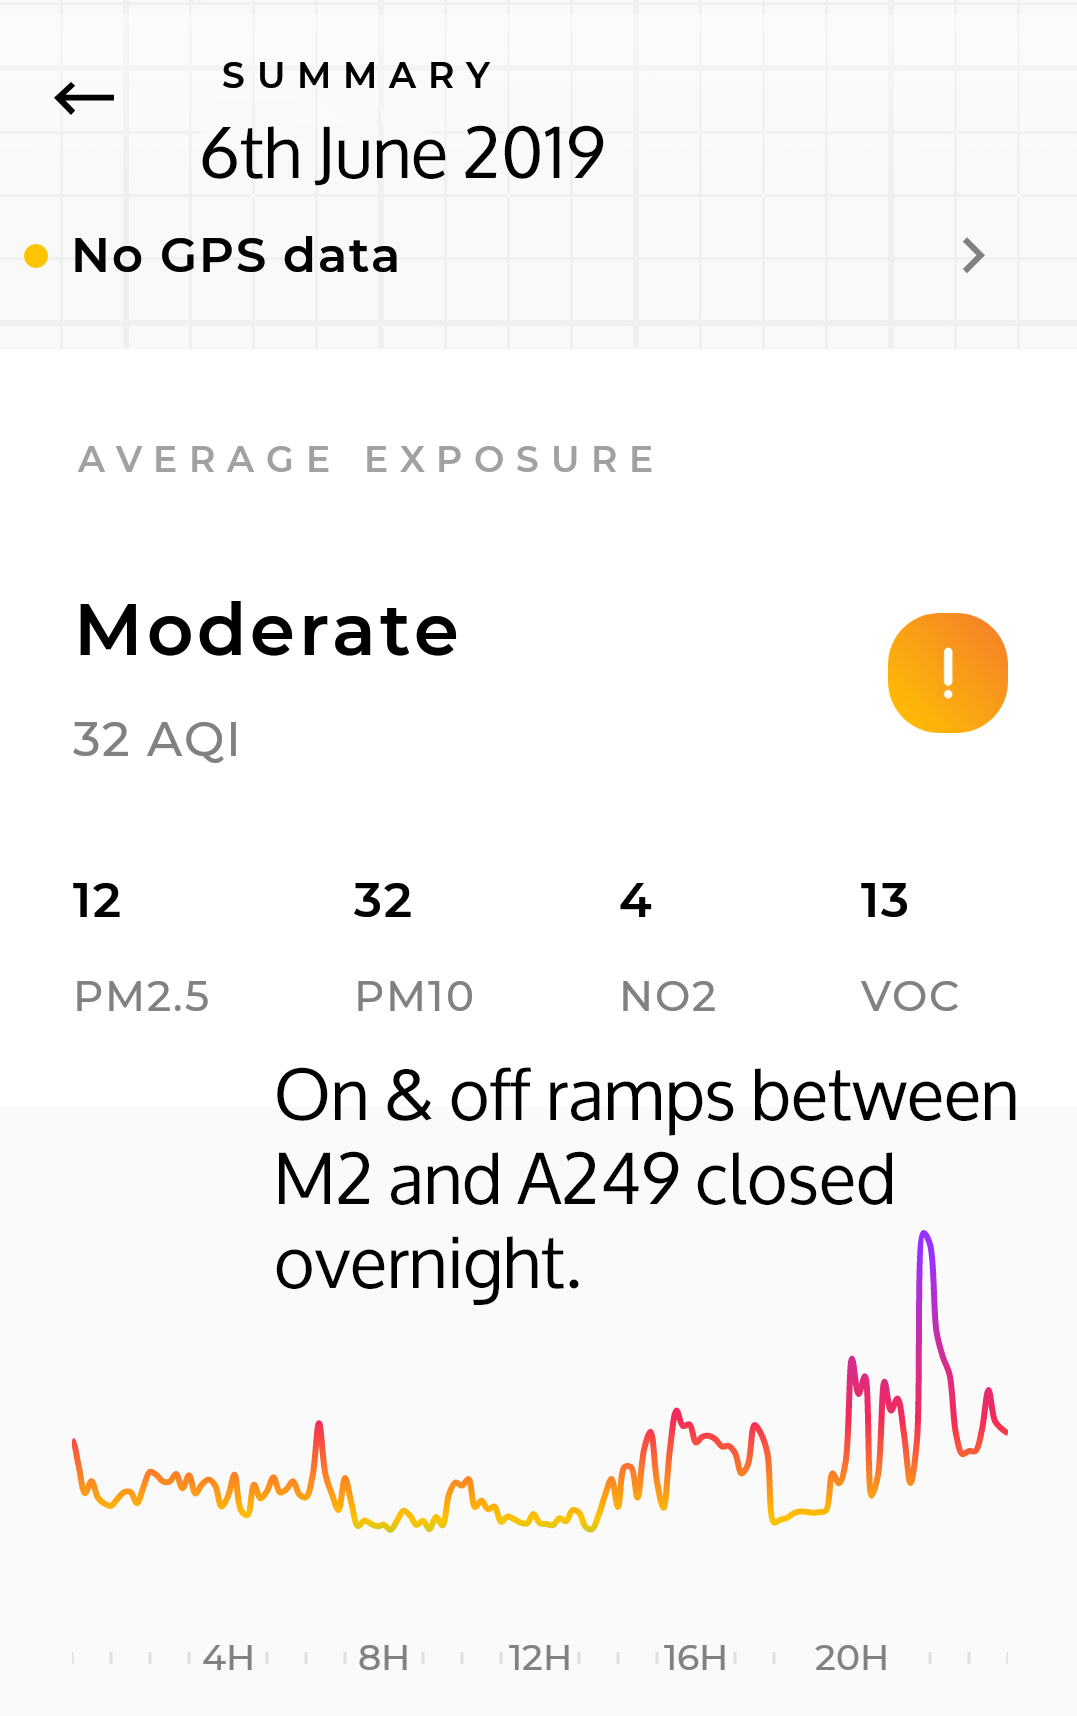
| 6th June Flow 1 Greenstreet |
12 |
32 |
4 |
13 |
MODERATE | Graph: Wind: SW - WSW - SW - SSE (17kph). Rain: 0.50mm. High pollution overnight, there was a closure of the on and off slip roads between the A249 and A2. | ||
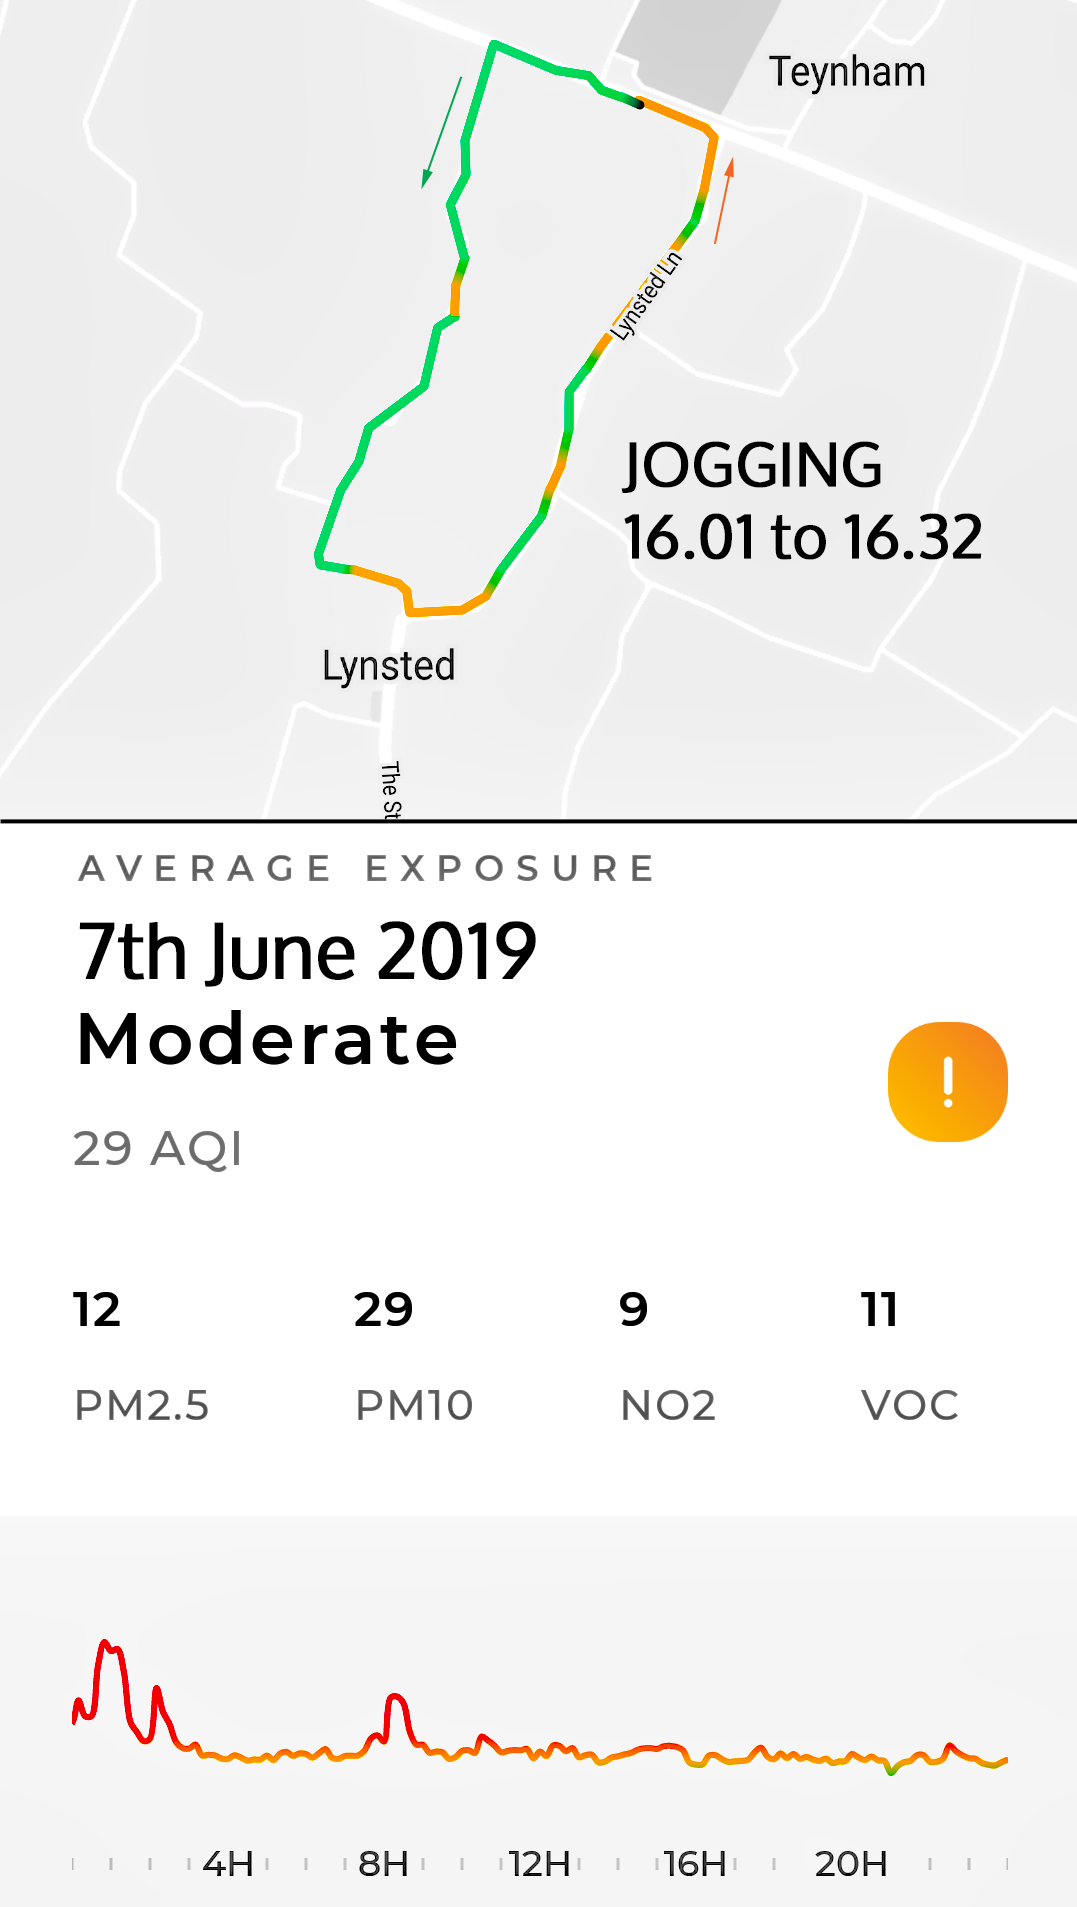
| 7th June Flow 1 Greenstreet |
12 |
29 |
9 |
11 |
MODERATE | Graph and Map: Wind: E - ESE - SE - SW (30kph). Rain: 10.40mm (all day after 9am).Stronger winds tend to lower pollution readings. Rain has the same effect. | ||
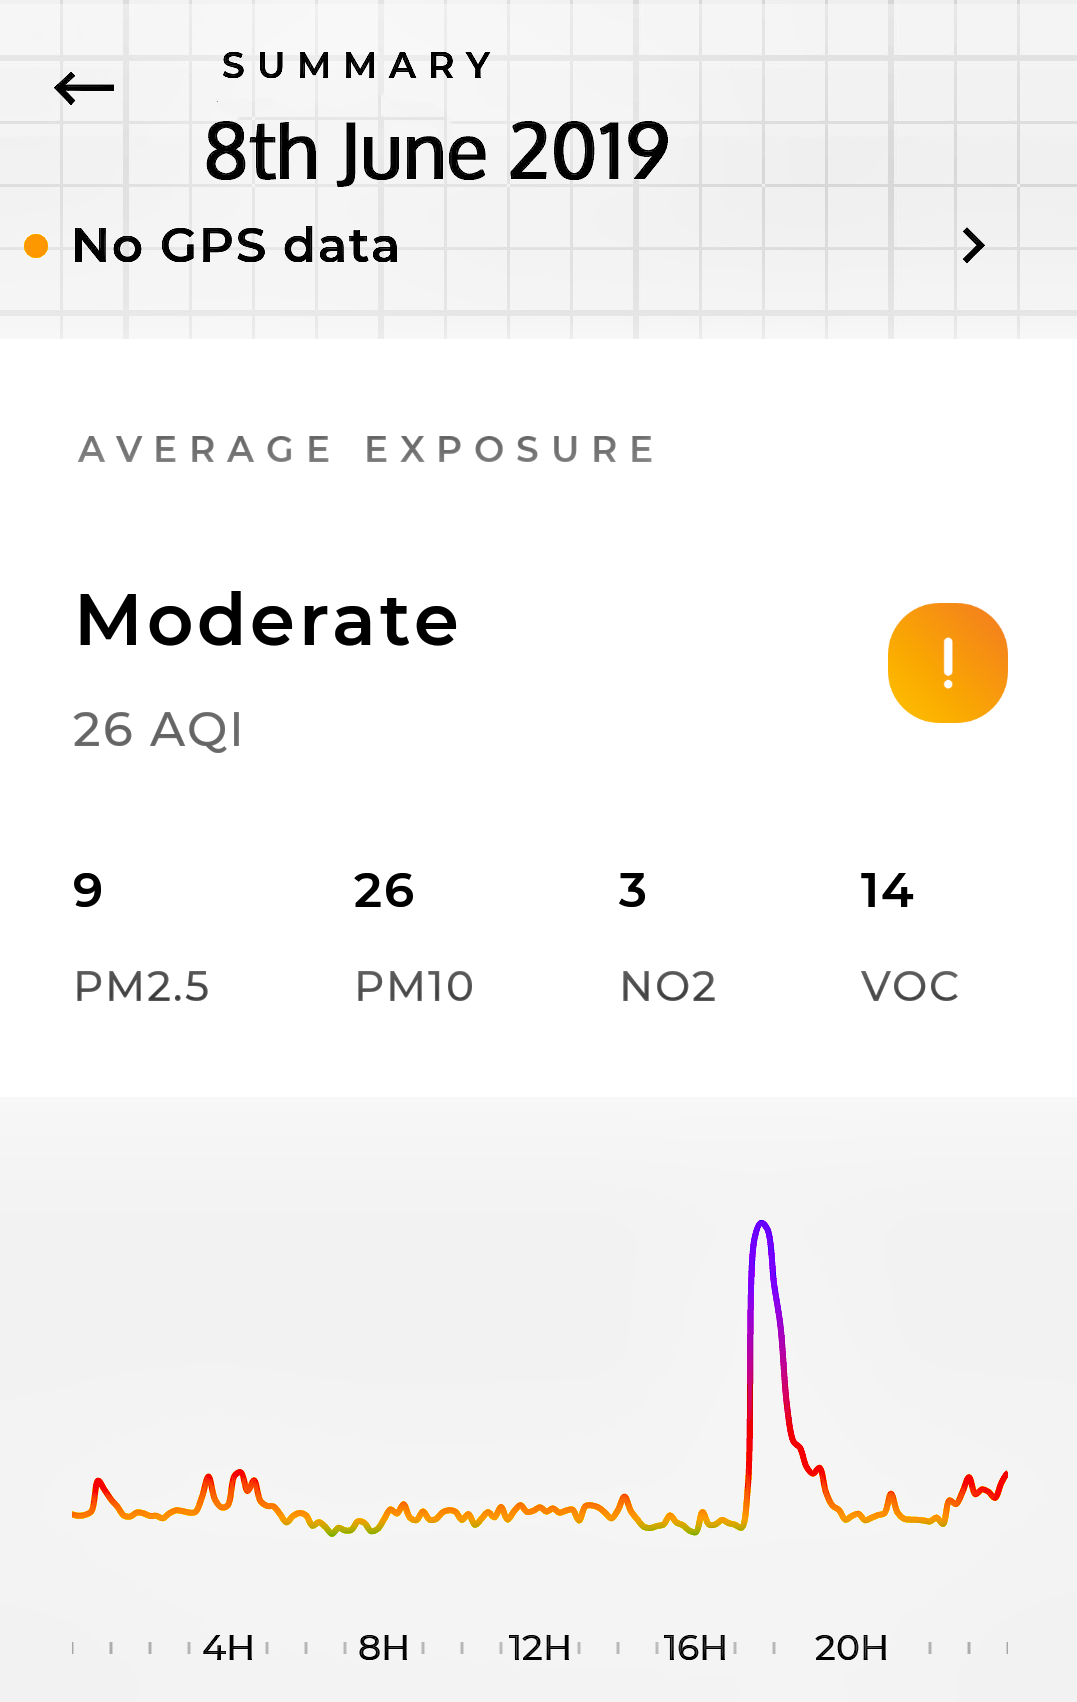
| 8th June Flow 1 Greenstreet |
9 |
26 |
3 |
14 |
MODERATE | Graph: Wind: SW-WSW-SW (35kph). Rain: 4.2mm. Wet day with breaks. Traffic hit saturation briefly in the afternoon to create a "Very High" peak. | ||
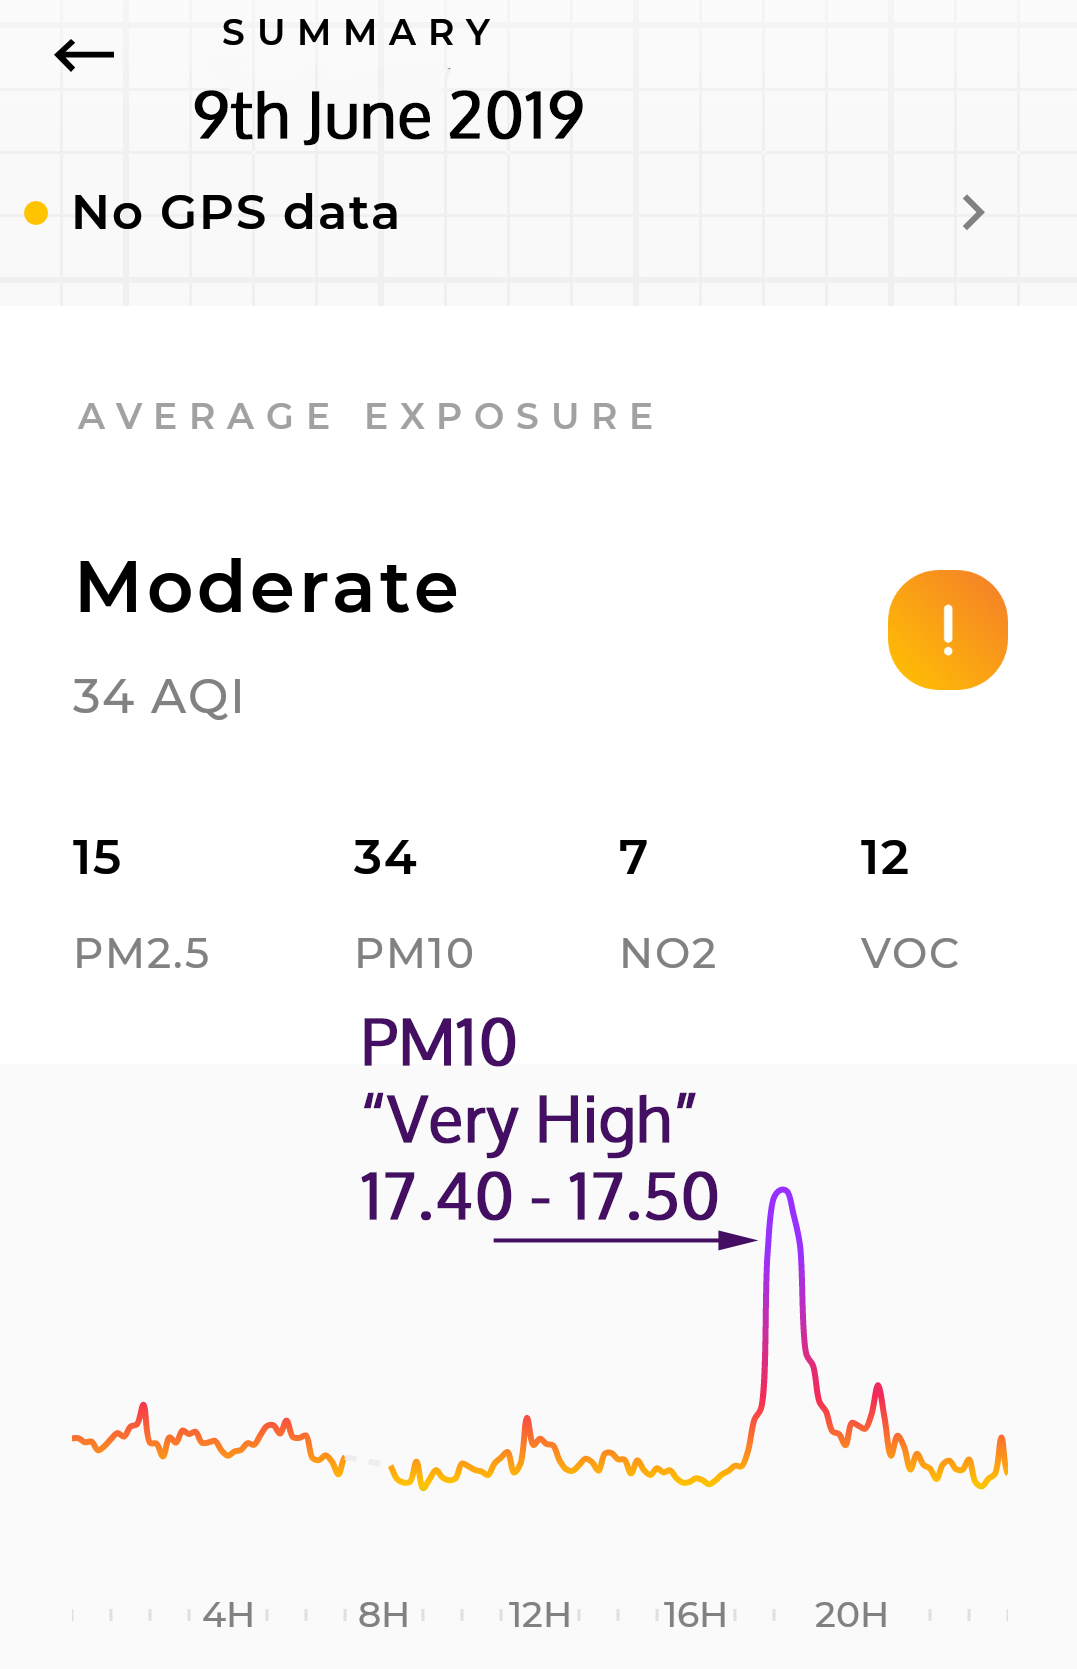
| 9th June Flow 1 Greenstreet |
15 |
34 |
7 |
12 |
MODERATE | Graph: Wind: SW - SSE - SSW (12kph). Rain: 3.4mm (afternoon and evening). Another "Very High'' peak (PM10) when traffic ground to a stop-start in the evening. | ||
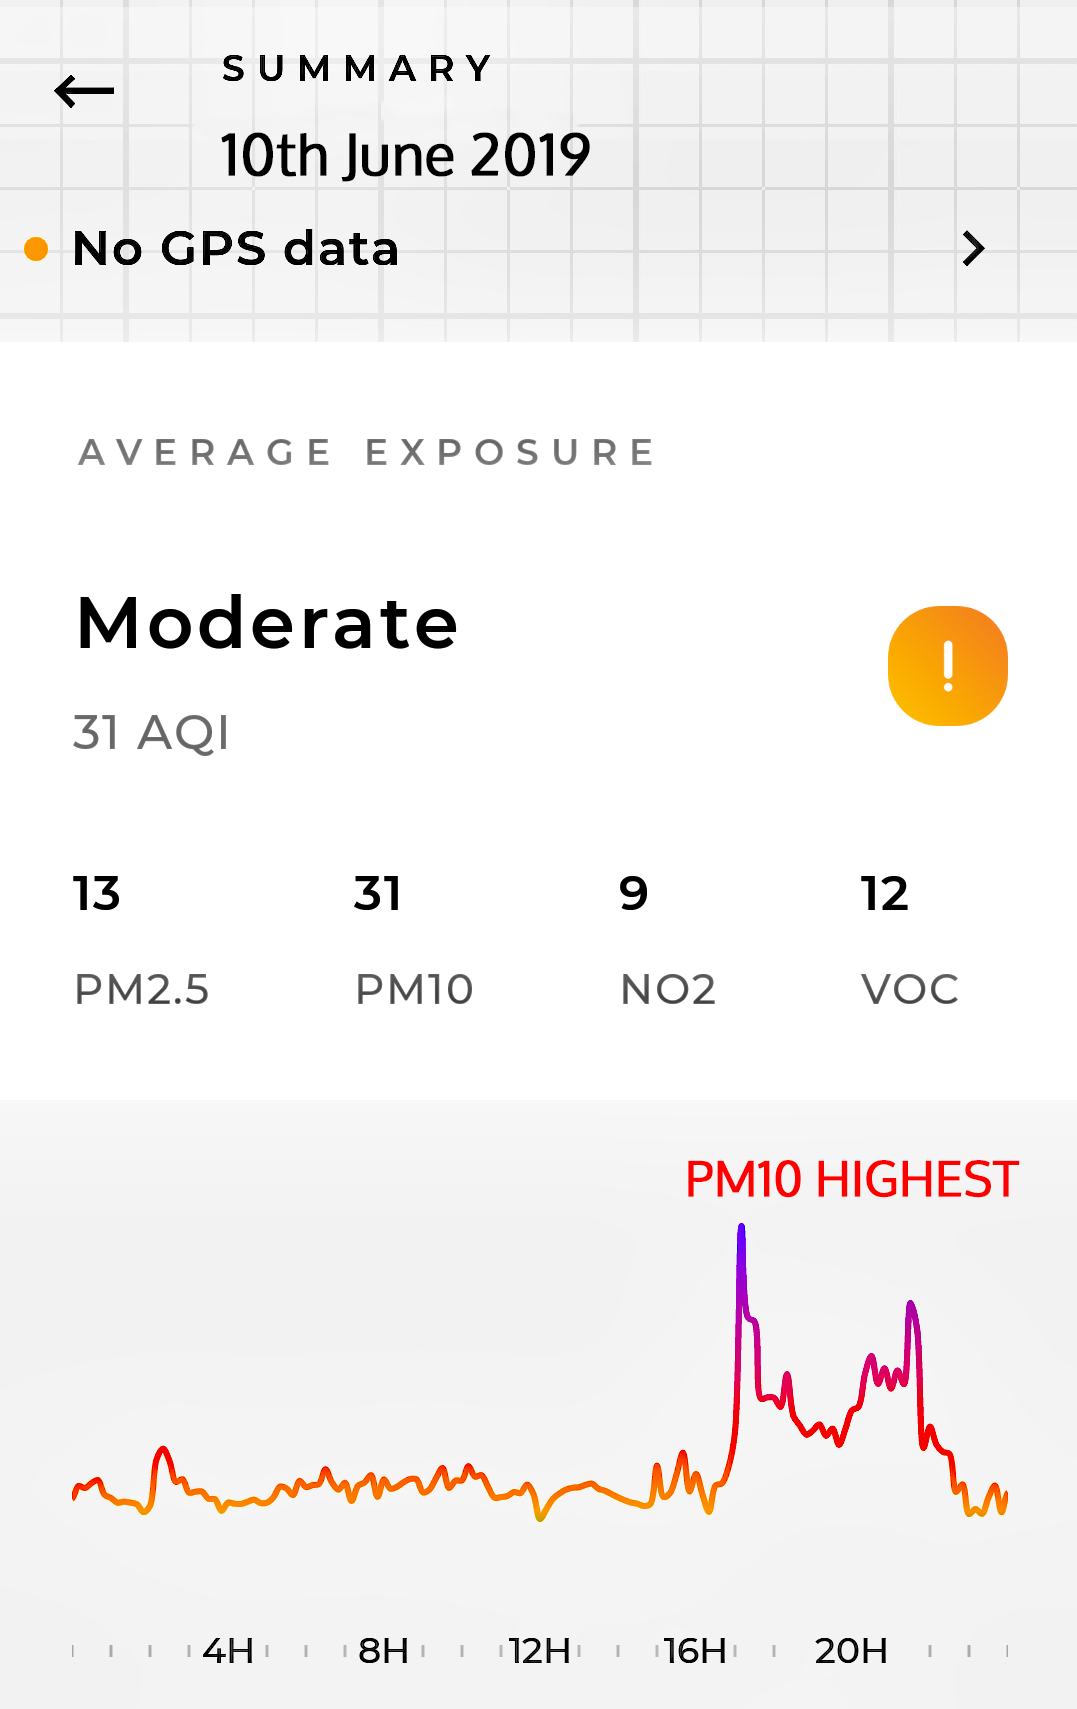
| 10th June Flow 1 Greenstreet |
13 |
31 |
9 |
12 |
MODERATE | Graph: Wind: NNW - N - NNE - ENE - SSE - SSW (15kph). Rain: 40.10mm. Very Wet! From 4.30pm PM10 pollutants very suddenly increased - until calming down at 11pm. | ||
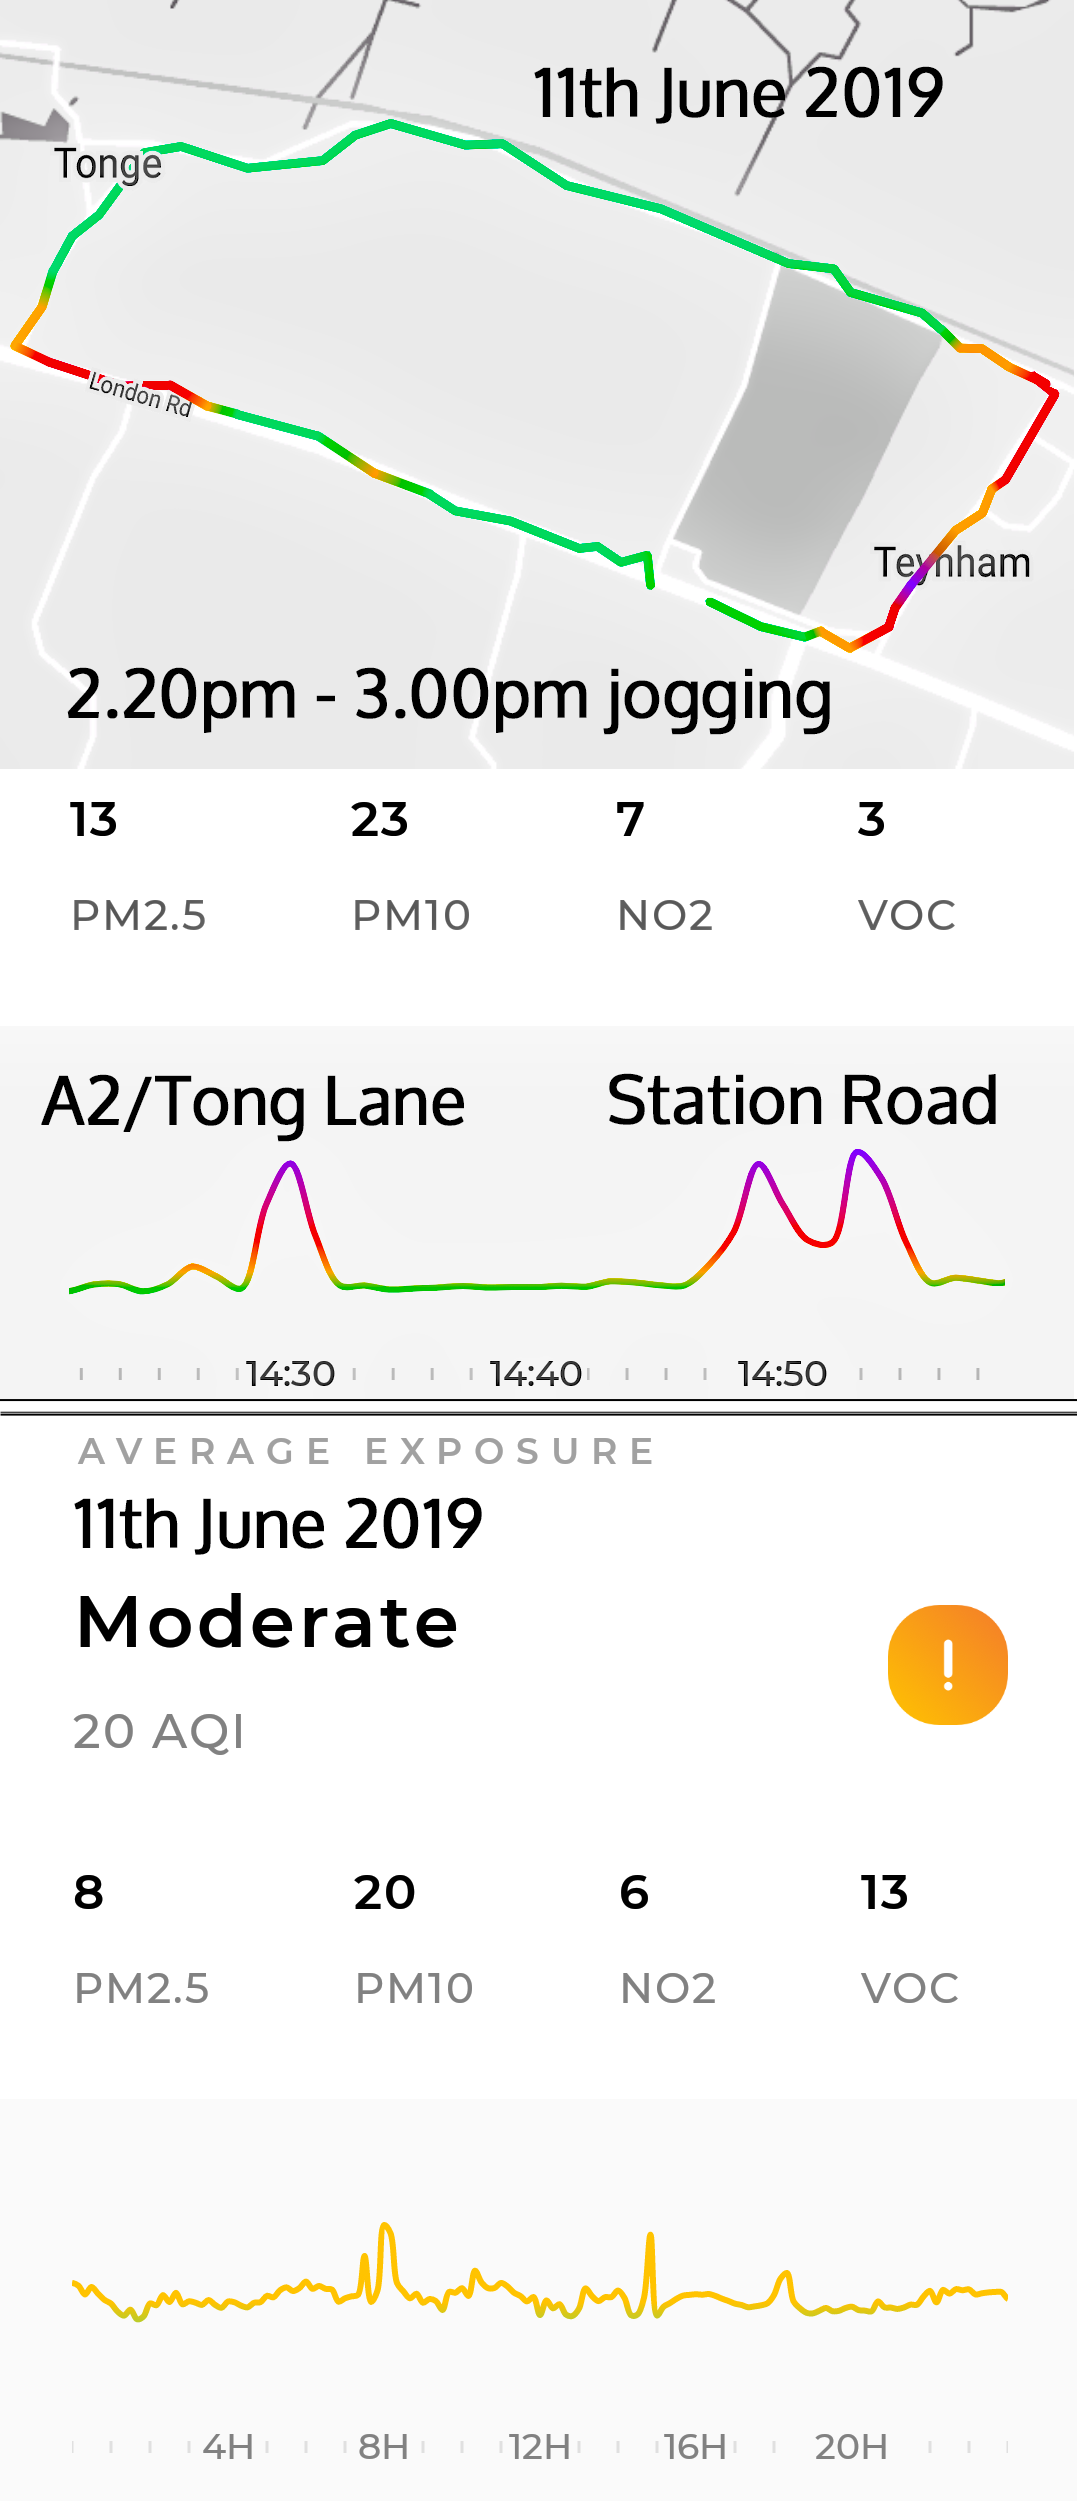
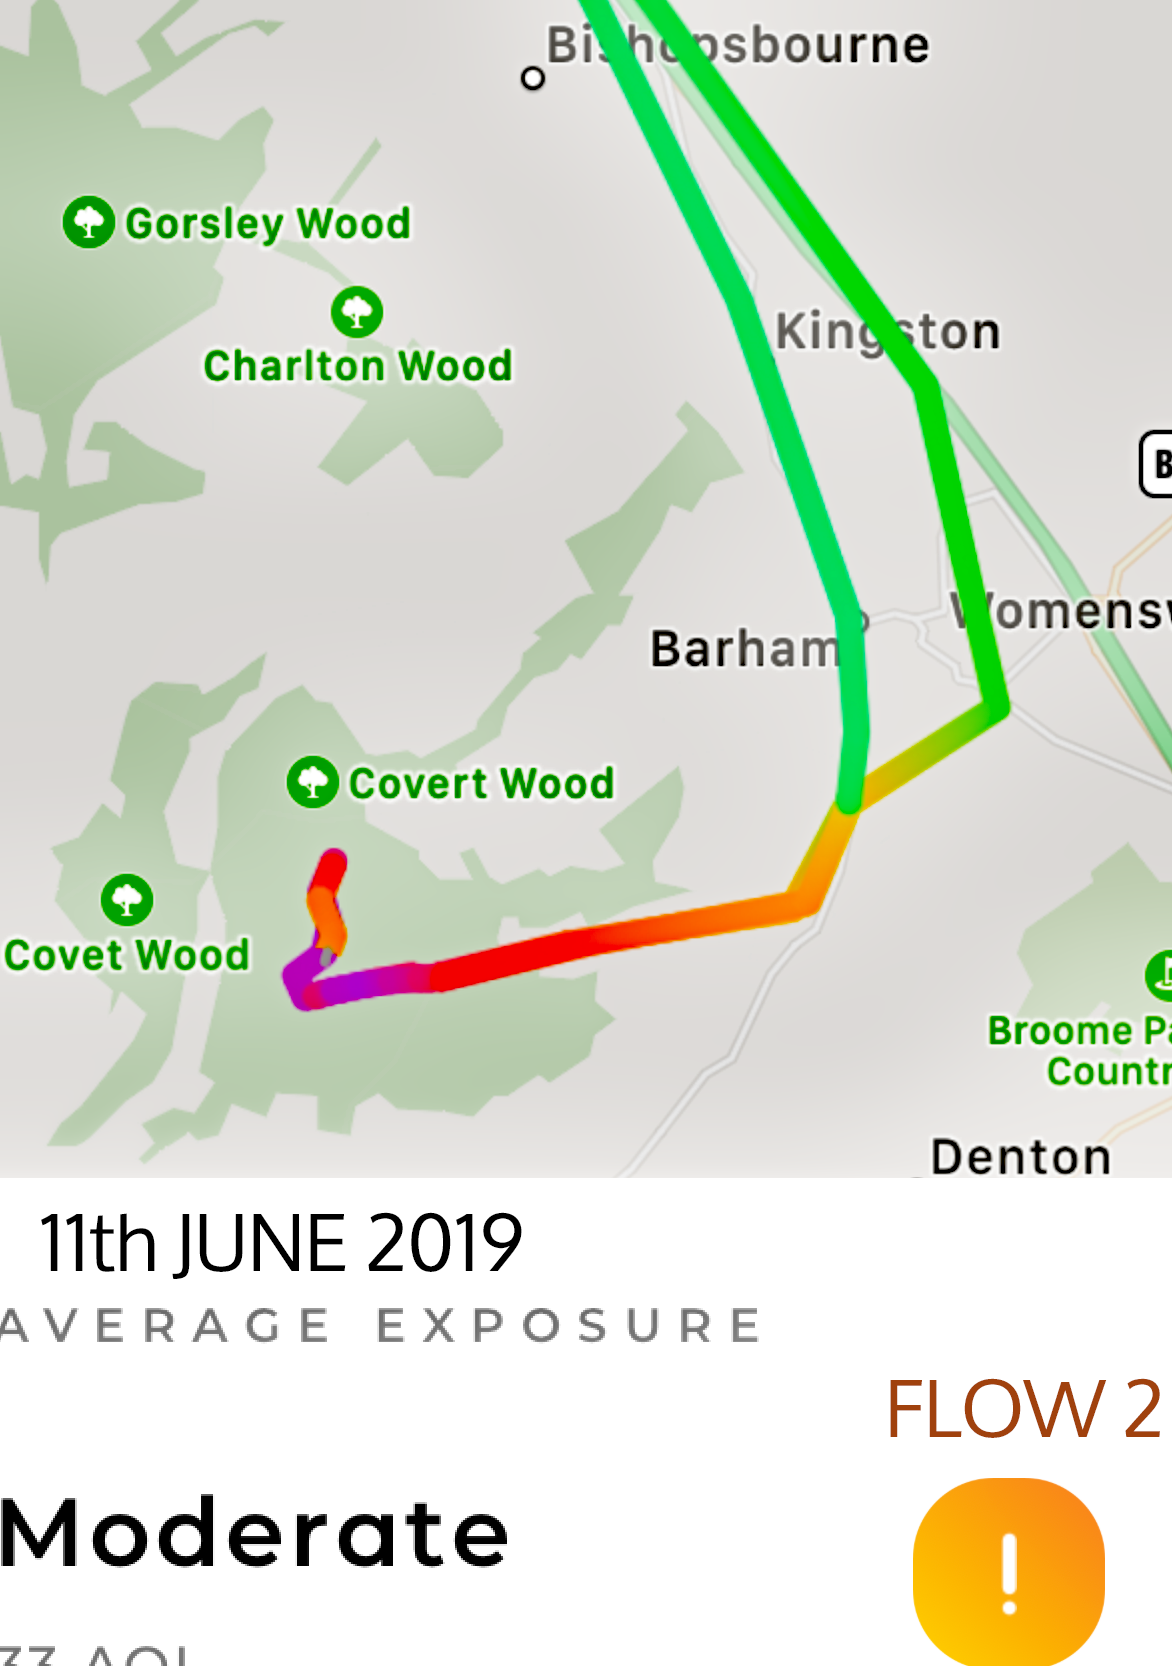
| 11th June Flow 1 Greenstreet |
8 |
20 |
6 |
13 |
MODERATE | Graph: Wind: SSW - S - SE (10kph). Rain: 0.80mm. Flow 2: This map comes from a dog-walk amongst active coppicing. So, if this was the culprit, there is no getting entirely away from pullution particles. |
||
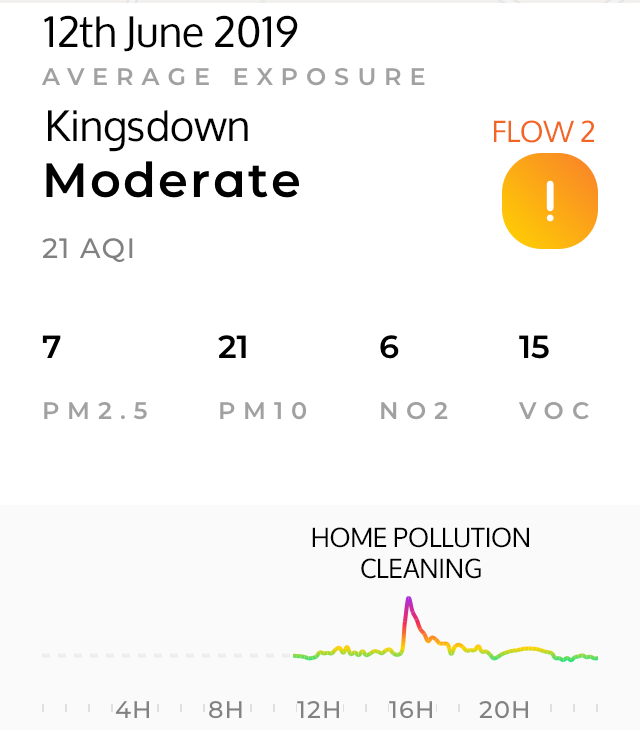
| 12th June Flow 1 Greenstreet Flow 2 Kingsdown |
9 |
21 |
7 |
13 |
MODERATE | Graph: Wind: NNE - NE - E - ESE (8kph ). Rain: 8.40mm. The 3.00am peak returns. | ||
7 |
21 |
6 |
15 |
MODERATE | Graph: Wind: NNE - NE - E - ESE (8kph ). Rain: 8.40mm. The 3.00am peak returns. Graph: Indoors pollution features when cleaning undertaken. |
|||
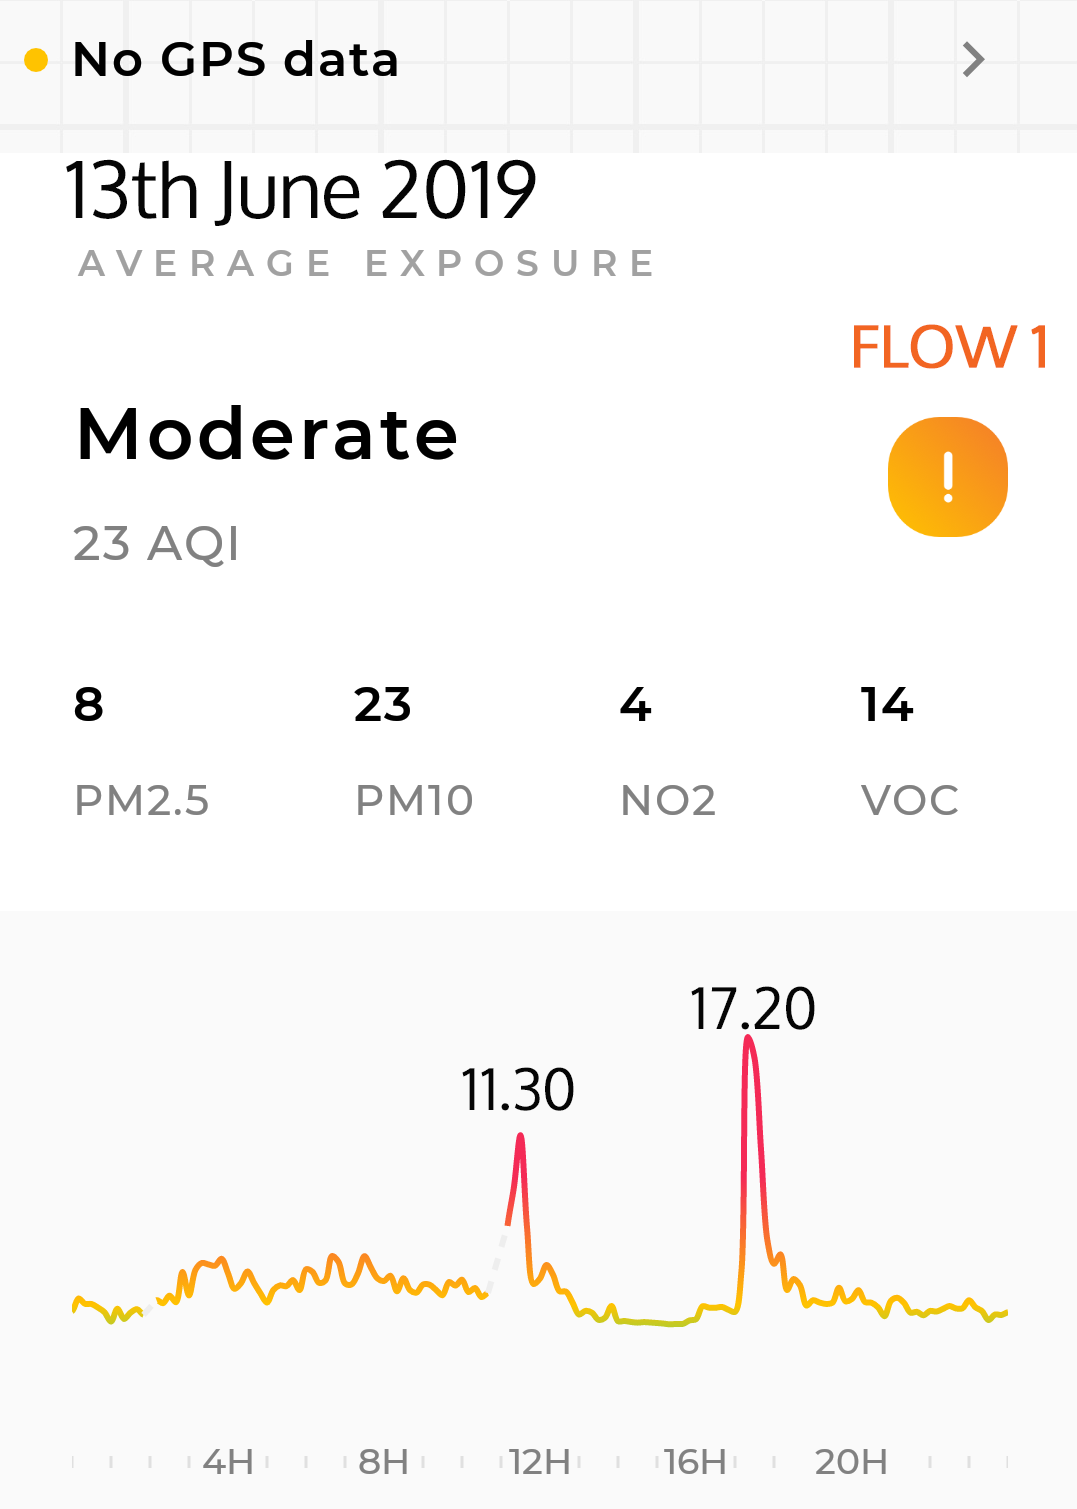
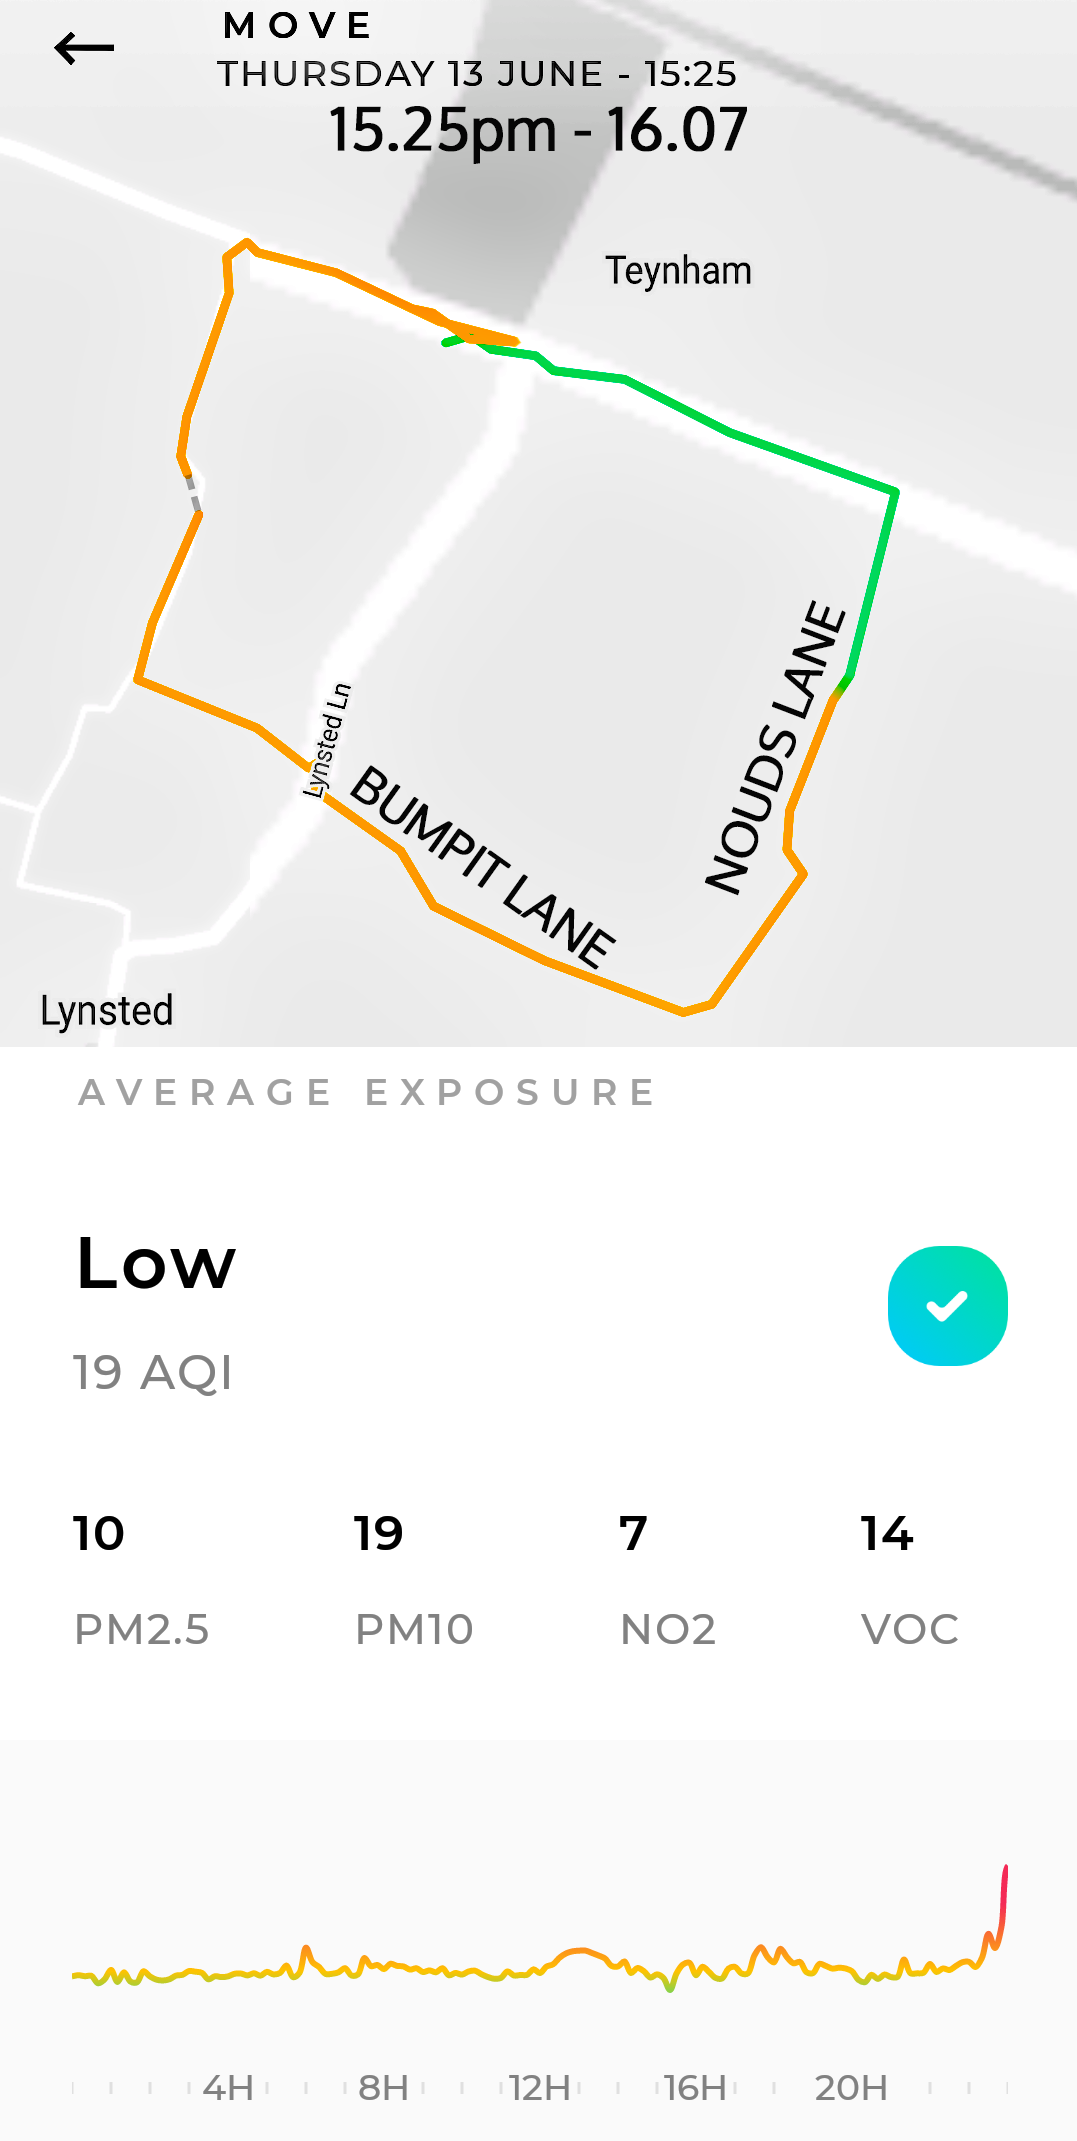
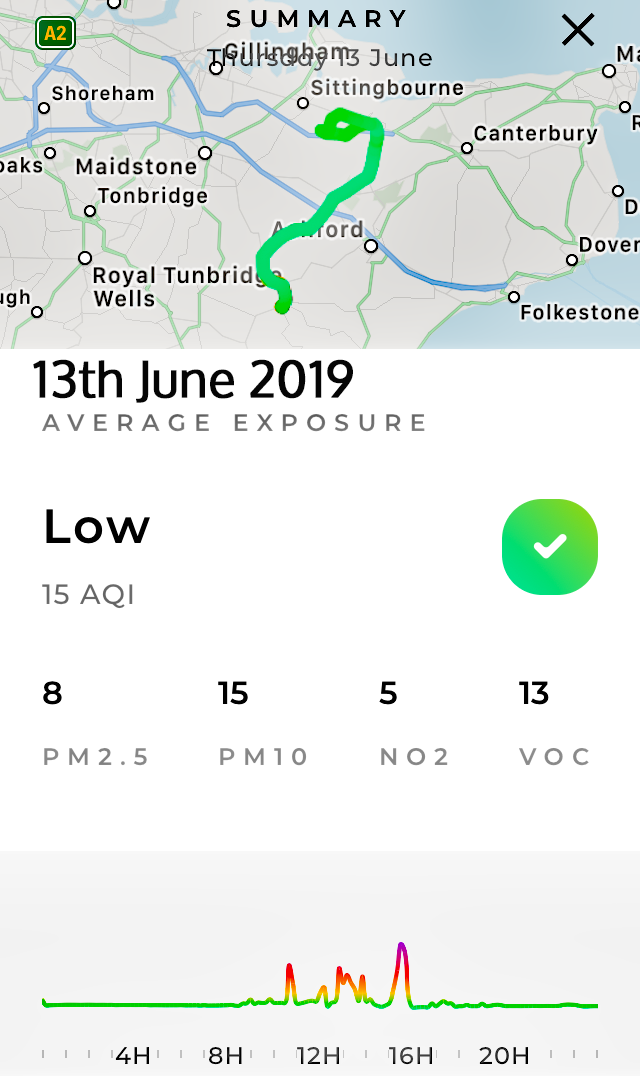
| 13th June Flow 1 Greenstreet Flow 2 Kingsdown |
10 |
19 |
7 |
14 |
LOW |
Graph: Wind: S - SW - SSW (25kph) Rain: 2.20mm. The second LOW pollution on the A2 (cf 24th May). Marginal result as I got MODERATE on a run - NOx was higher down Nouds Lane. |
||
| 8 | 15 | 8 | 13 | LOW | Flow 2: Graph: A good day in the countryside. Low pollution at many times. | |||
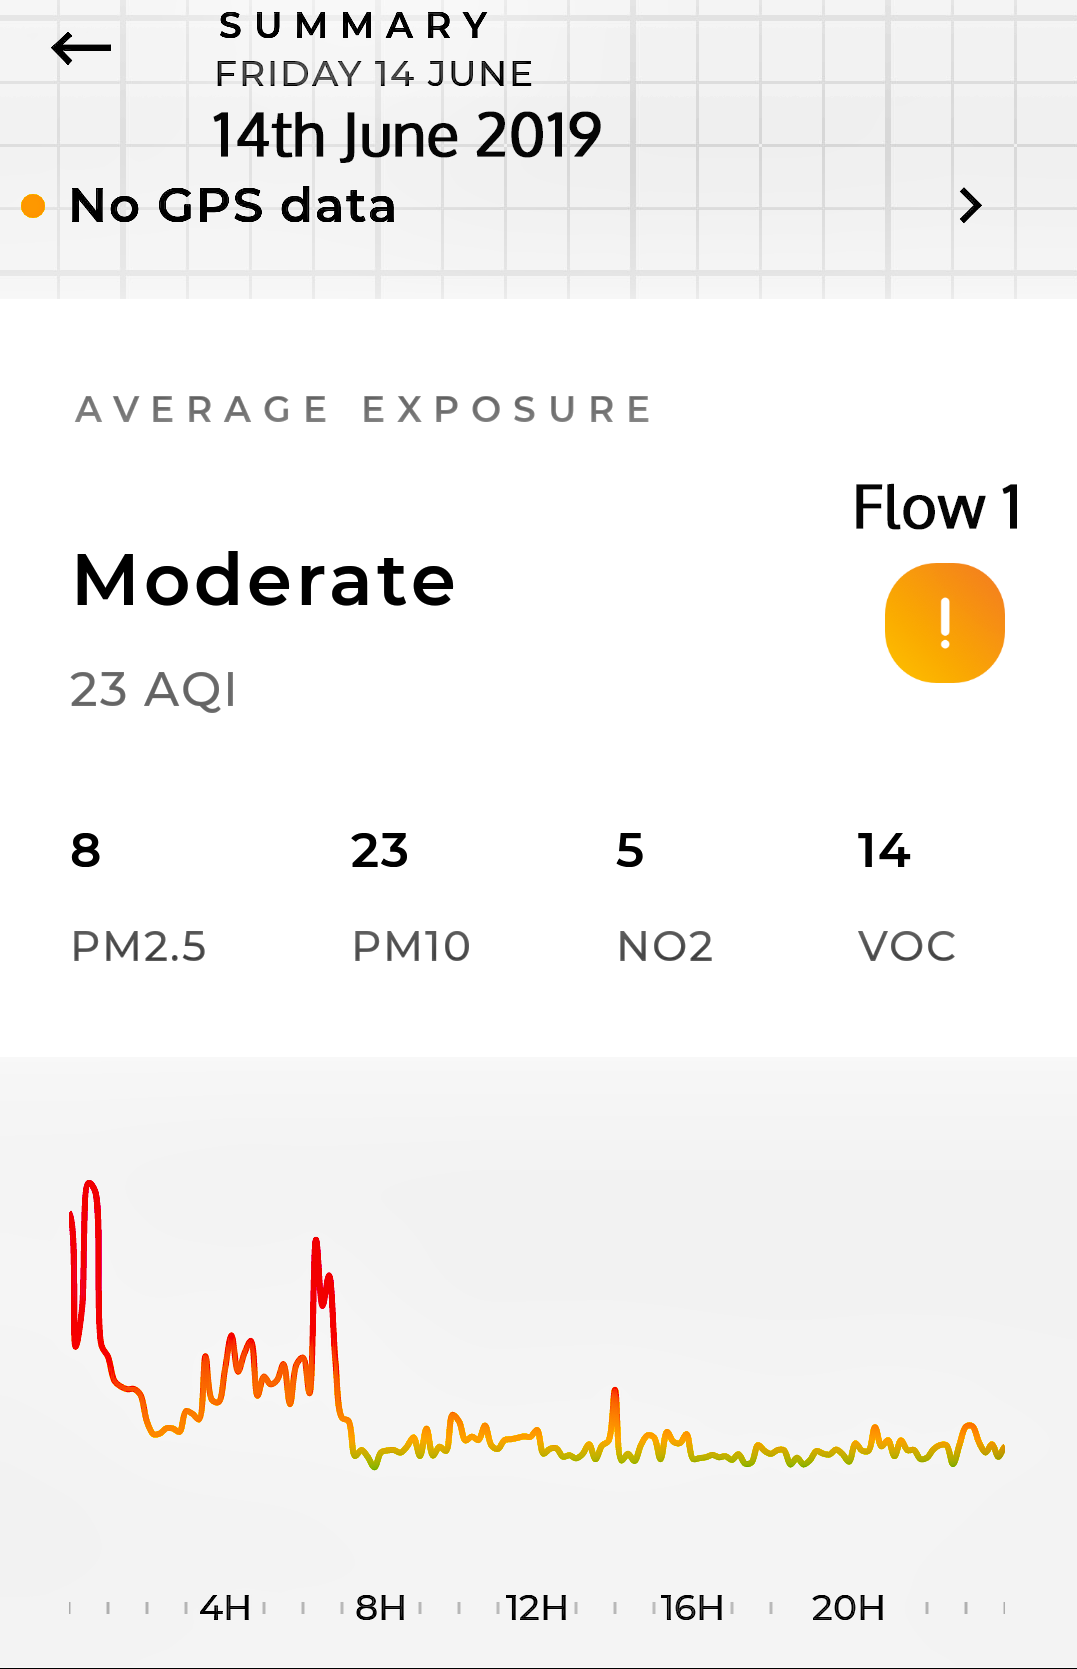
| 14th June Flow 1 |
8 |
23 |
5 |
14 |
MODERATE | Graph: Wind: SSW (21kph). Rain: 0.80mm. There appears to have been a problem on the M2/A249 overnight, magnifying the expected peaks. | ||
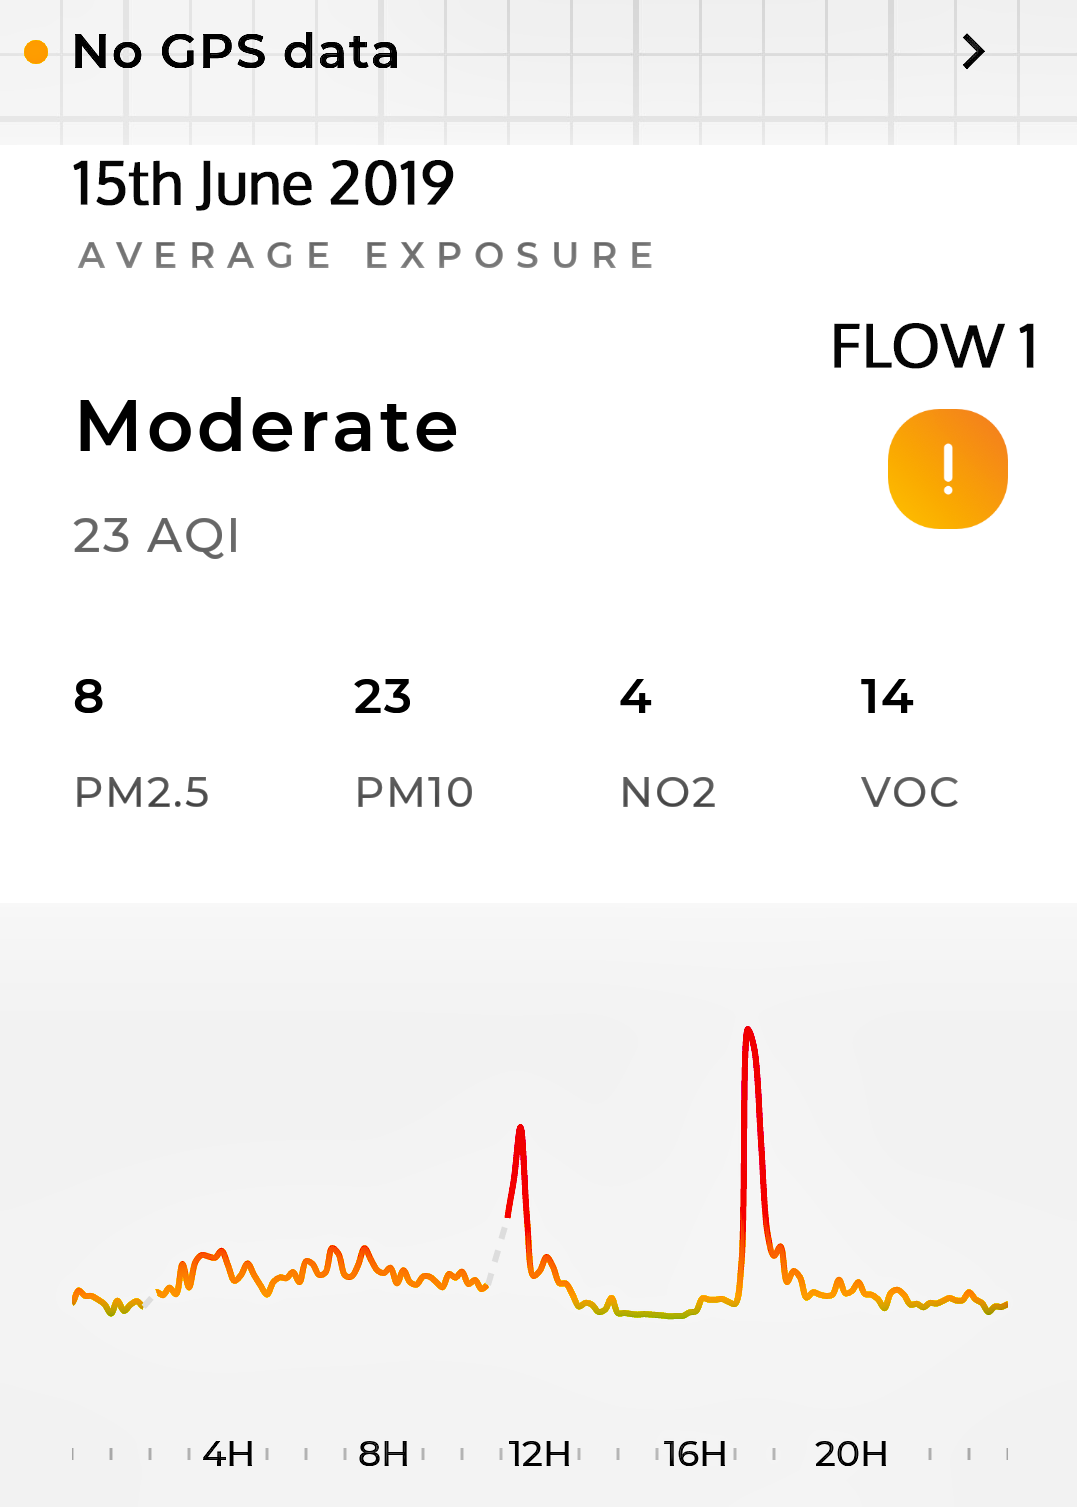
| 15th June Flow 1 |
8 |
23 |
4 |
14 |
MODERATE | Graph: Wind: SSW - S (17kph). Rain: 2.10mm | ||
| 16th June Flow 1 Greenstreet |
13 |
28 |
15 |
12 |
MODERATE | No image. Wind: SW - SSW - SW (23kph). Rain: 2.10mm | ||
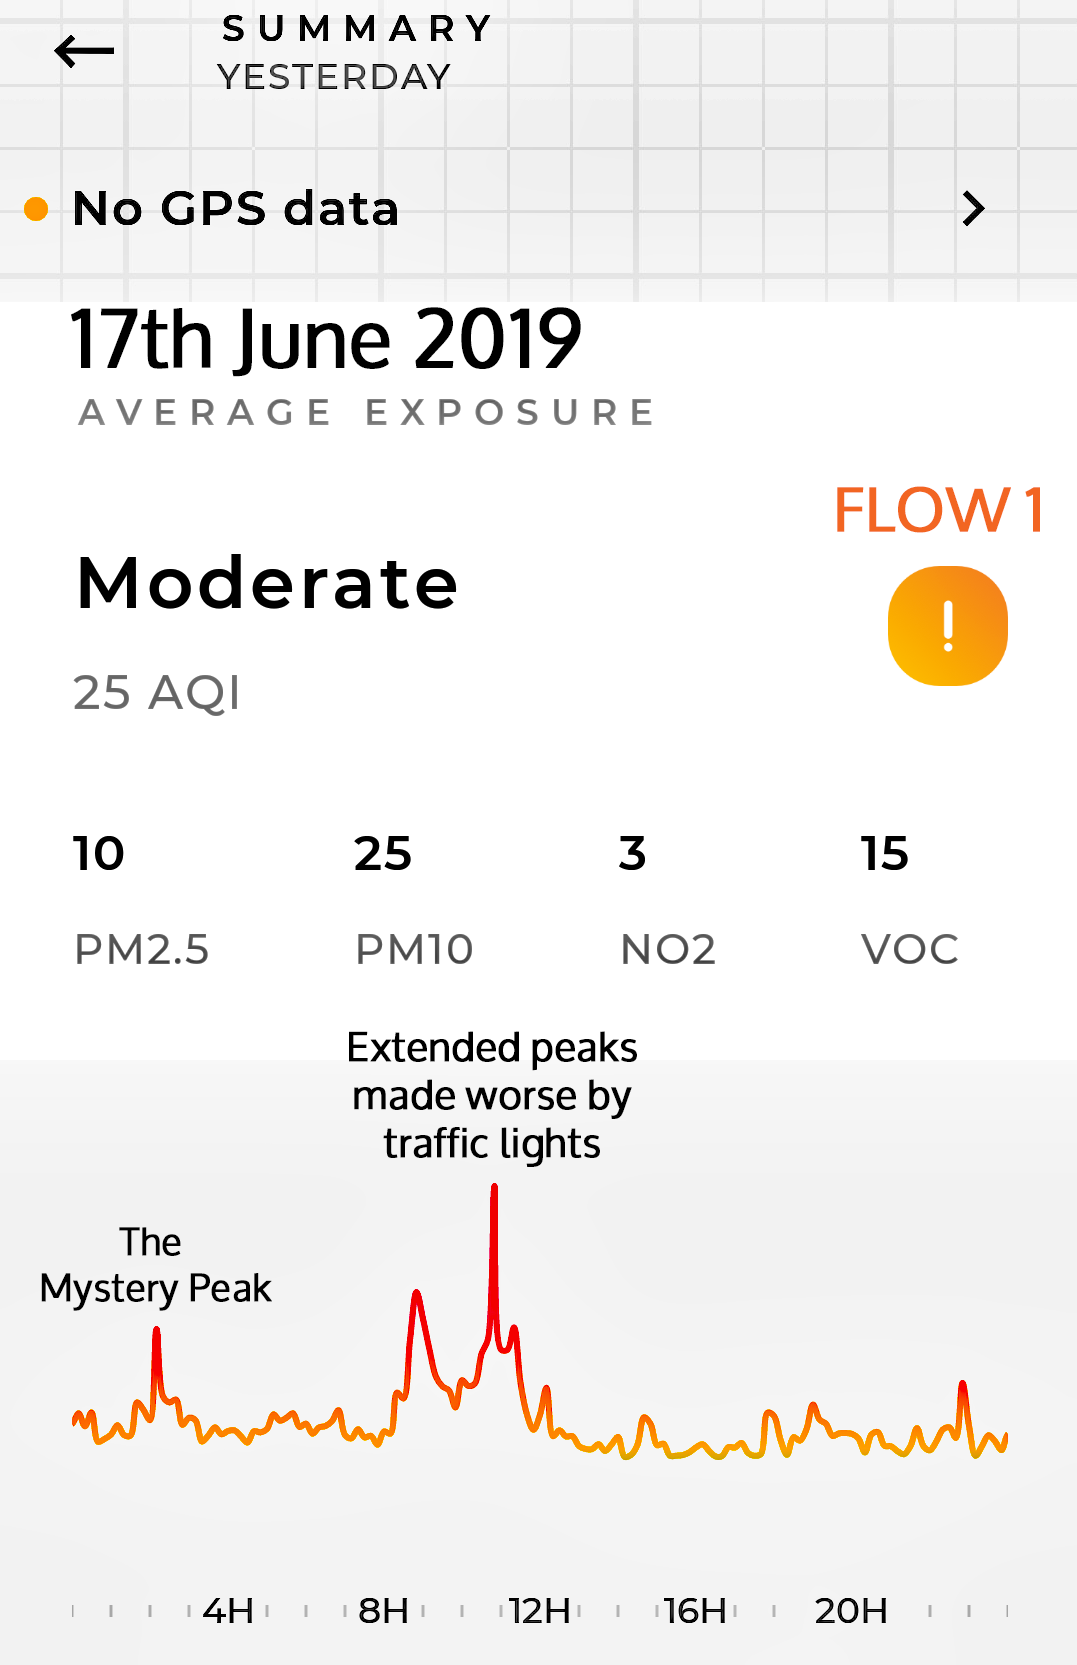
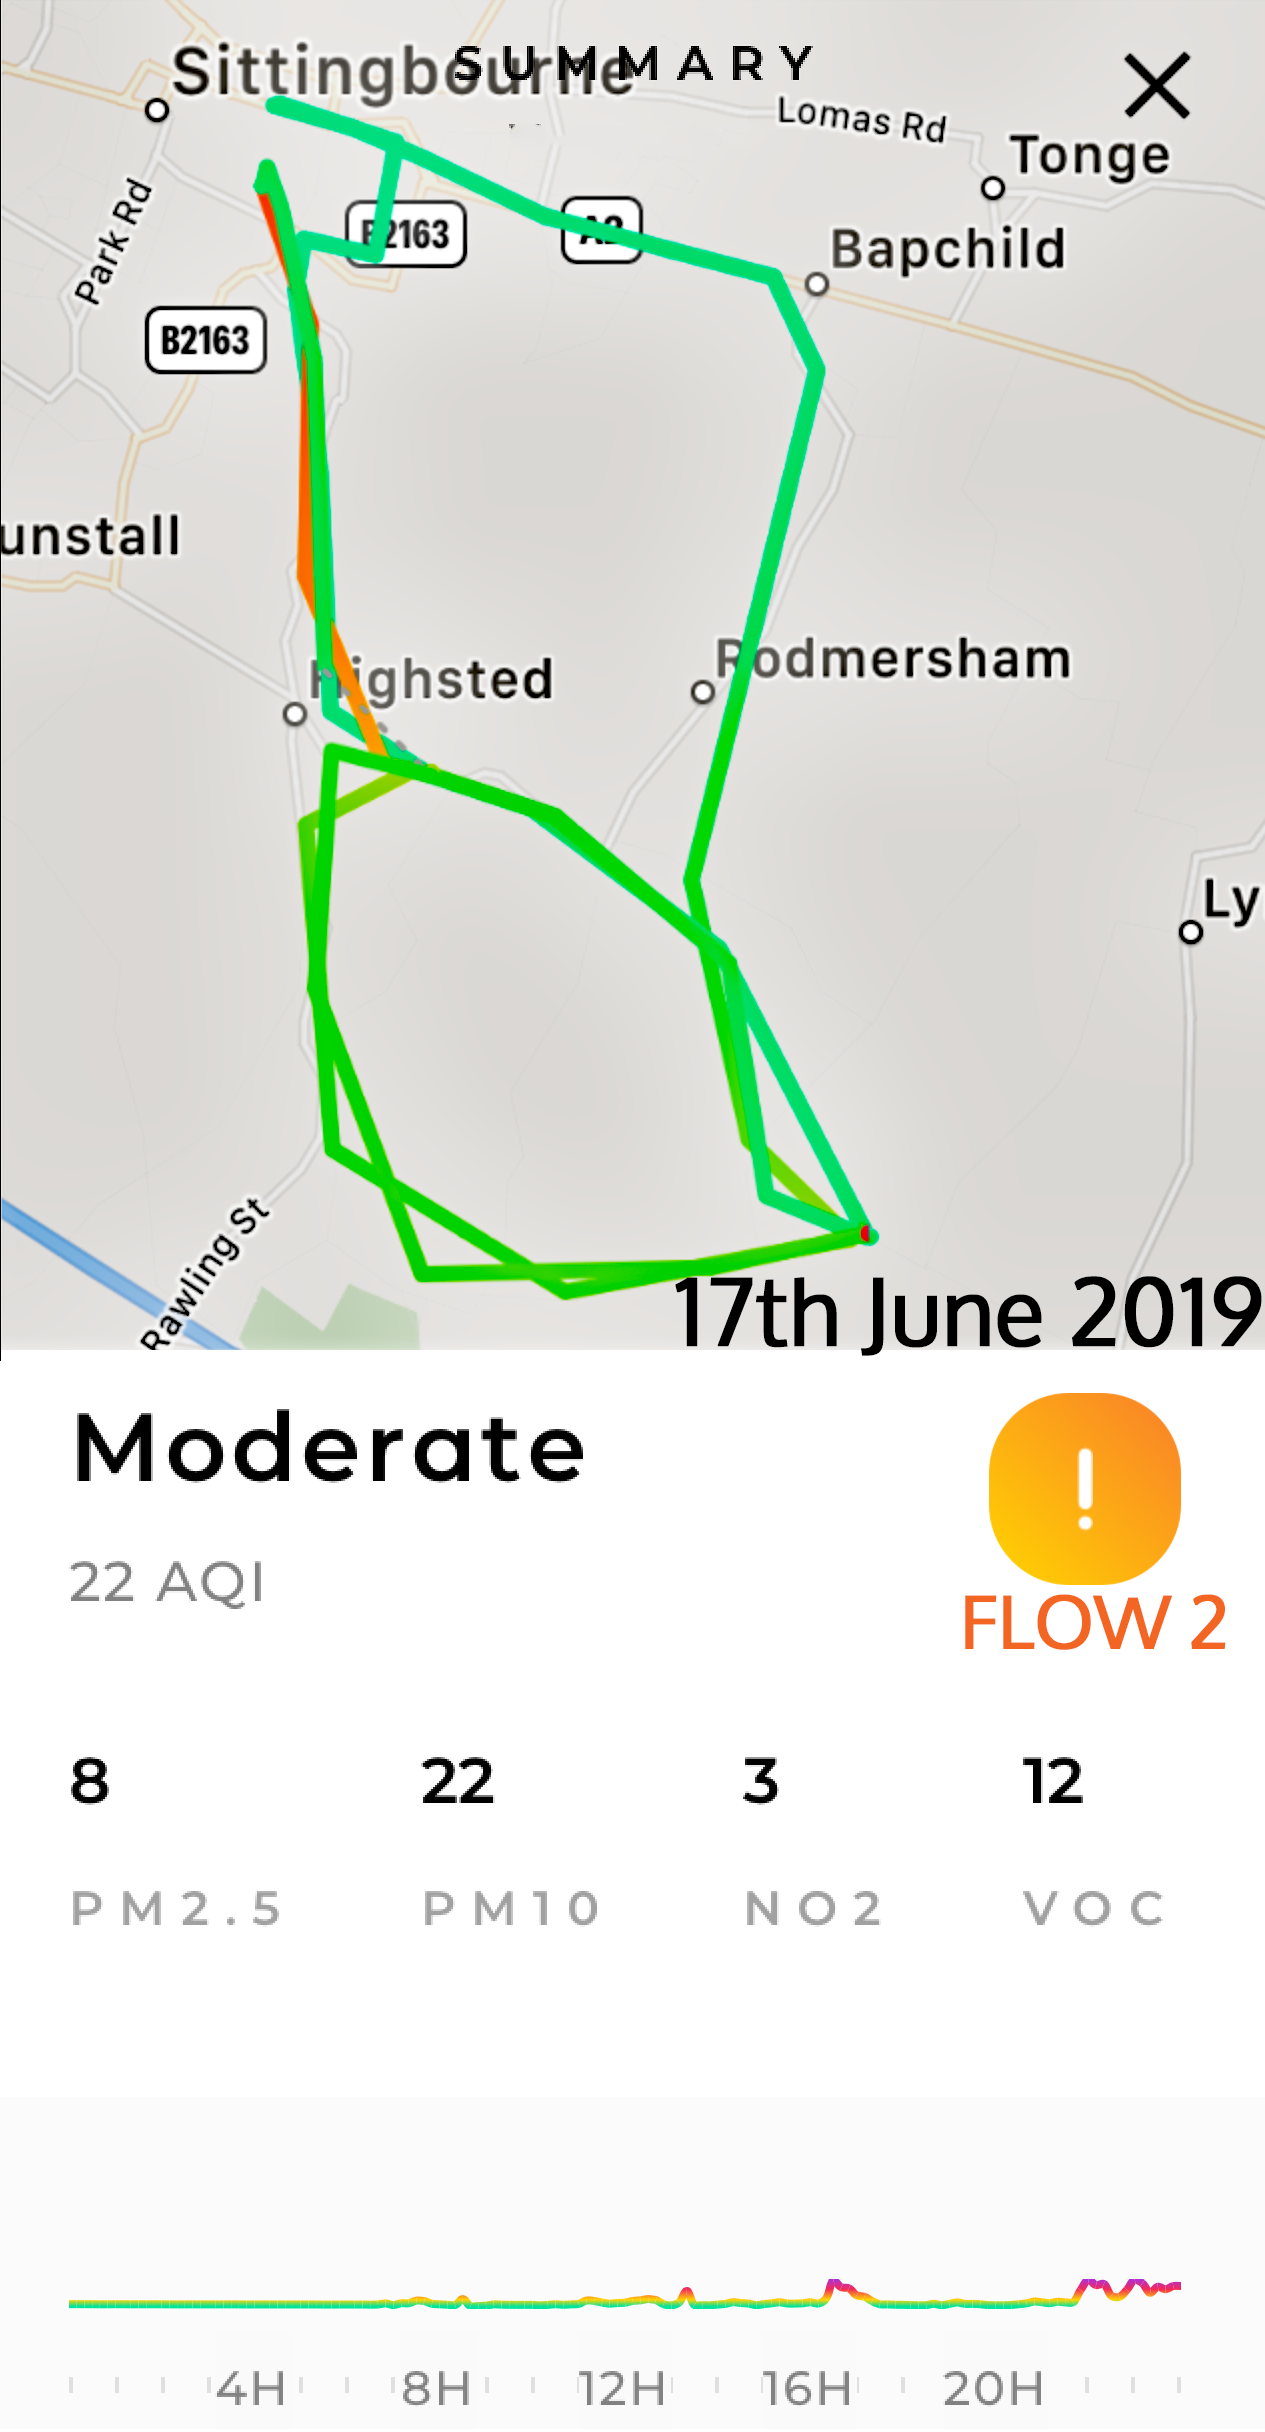
| 17th June Flow 1 Greenstreet Flow 2 Kingsdown |
10 |
26 |
3 |
15 |
MODERATE | Graph: Wind: SSW - SW - SSW (12kph). Rain: Dry. | ||
| 8 | 22 | 3 | 12 | MODERATE | Flow 2: Graph: Another good day in the countryside. "Moderate" measurements on the move but only nearer to Sittingbourne. | |||
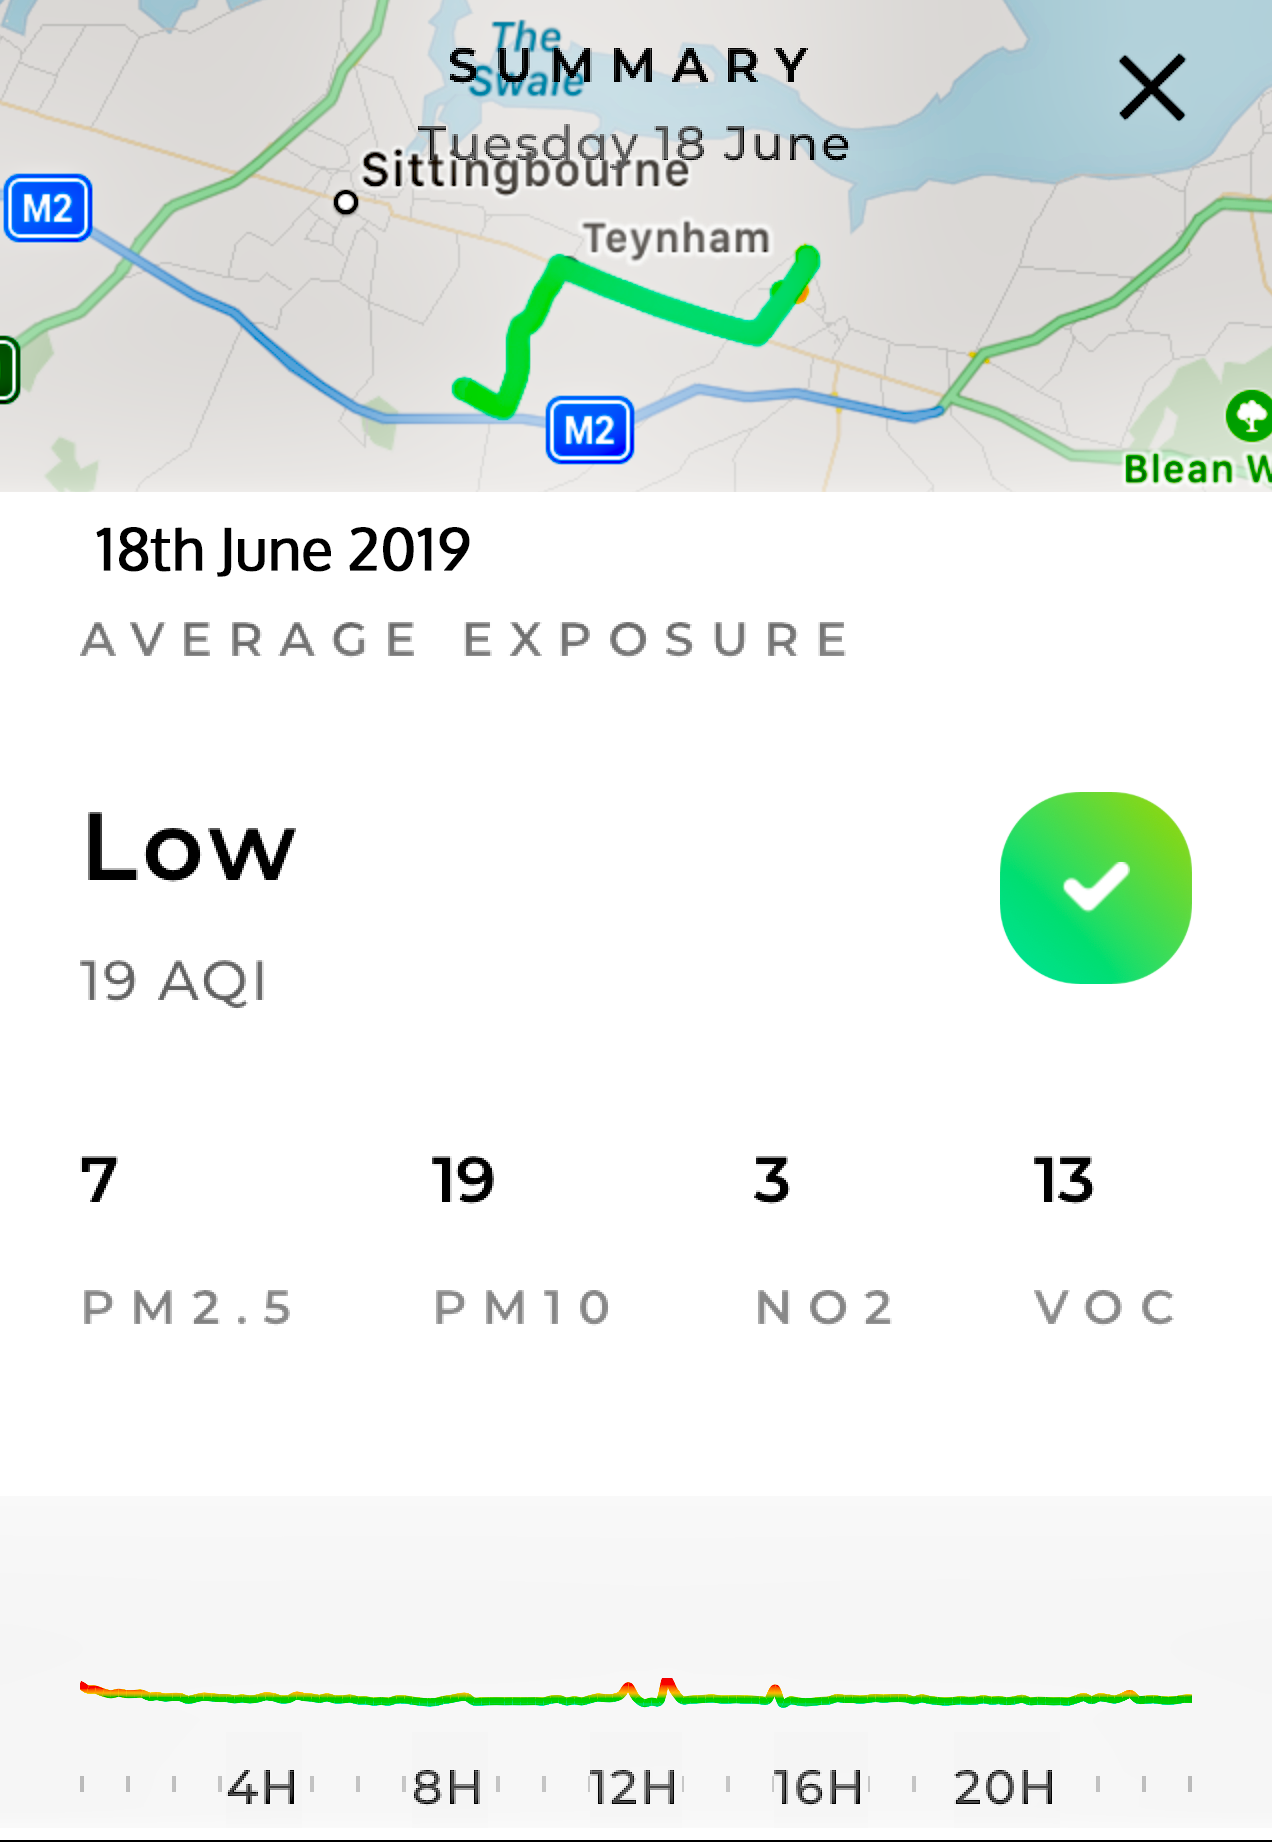
| 18th June Flow 1 Greenstreet Flow 2 Kingsdown |
11 |
23 |
6 |
13 |
MODERATE | Wind: SW - SSE - E (8kph). Rain: 1.90mm | ||
| 7 | 19 | 3 | 13 | LOW | Flow 2: Graph: Low pollution out and about to the south of Lynsted village | |||
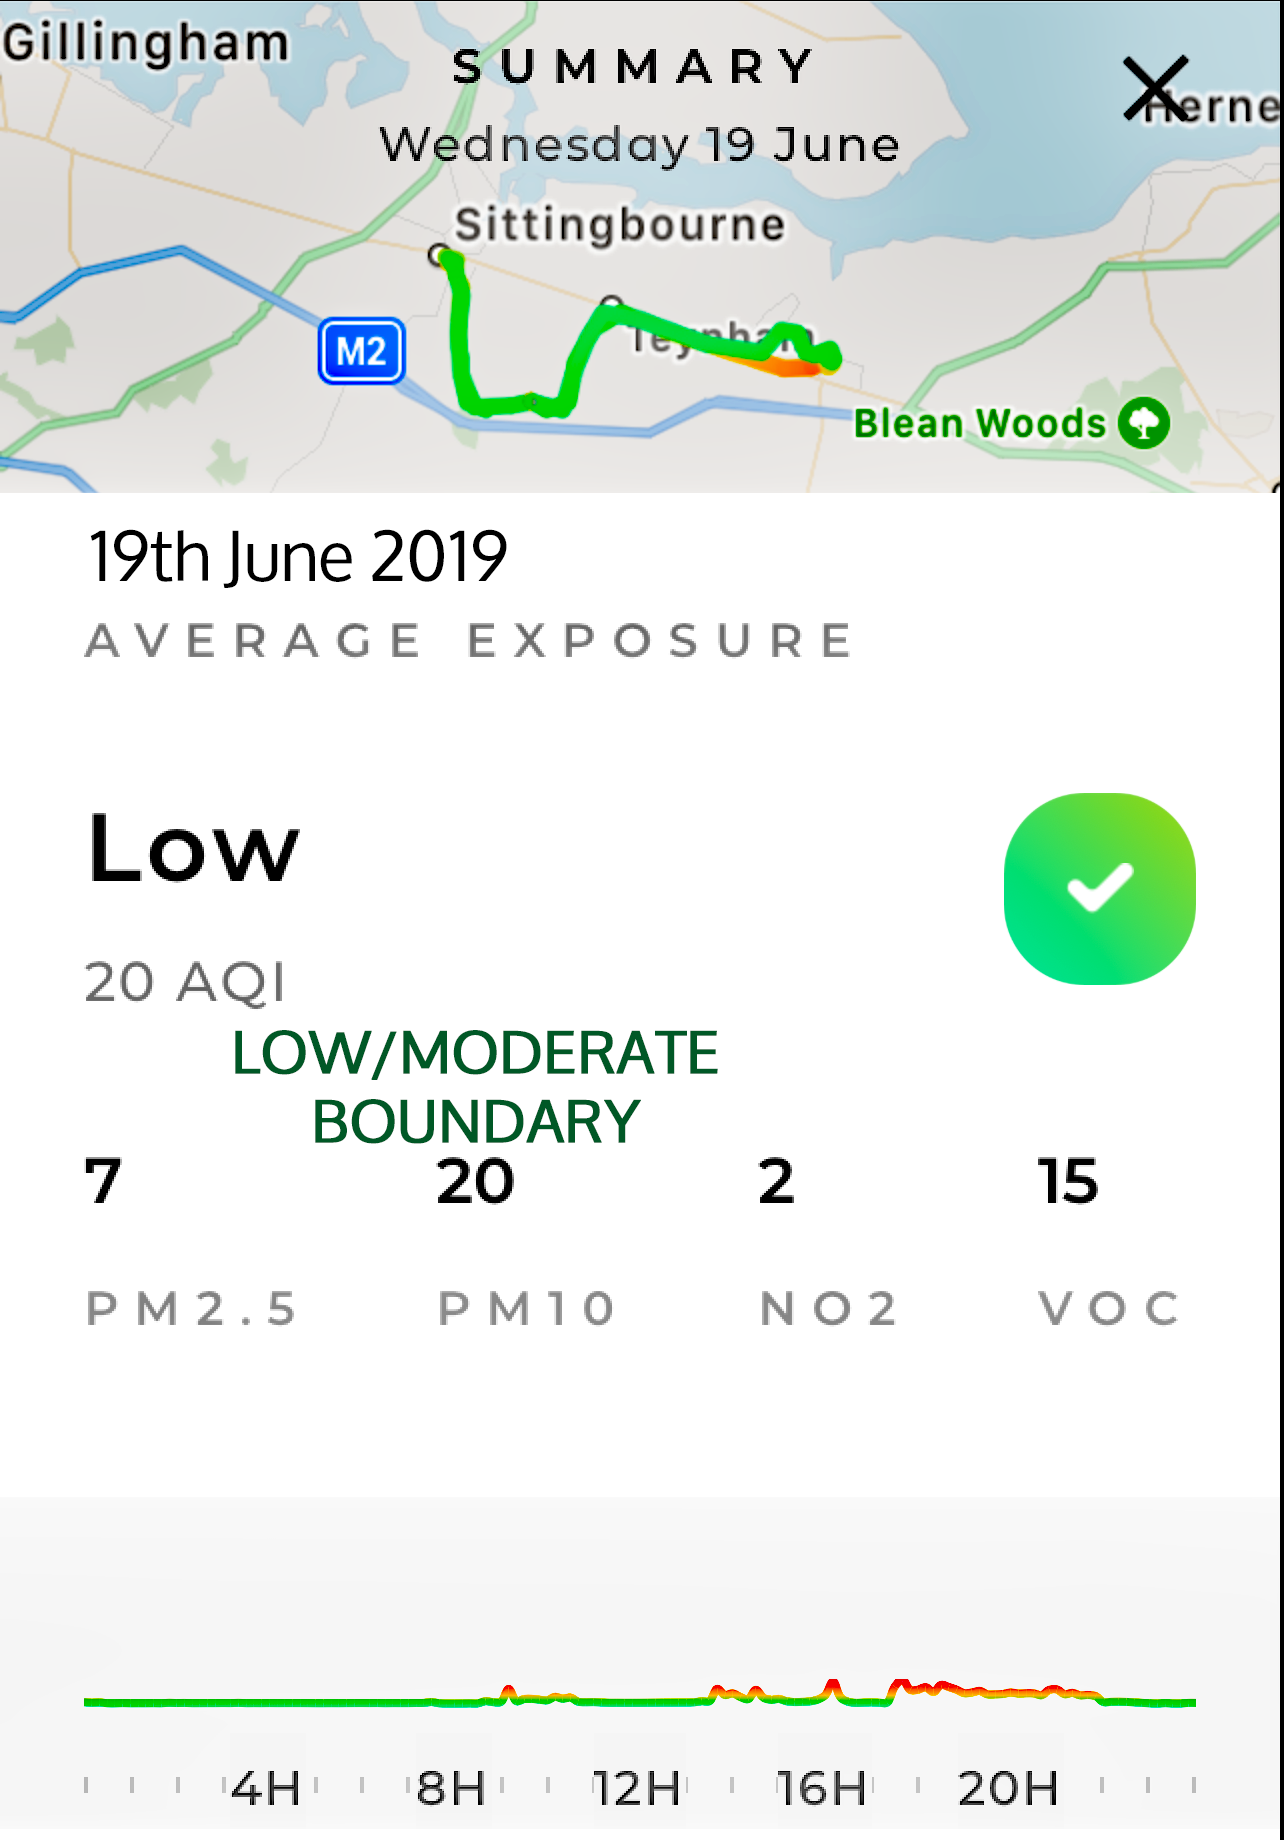
| 19th June Flow 1 Greenstreet Flow 2 Kingsdown |
13 |
28 |
2 |
14 |
MODERATE | Wind: E - NNW - N - WNW - W (10kph). Rain: 6.00mm | ||
| 7 | 20 | 2 | 15 | LOW | Flow 2: Graph: Low again out and about. | |||
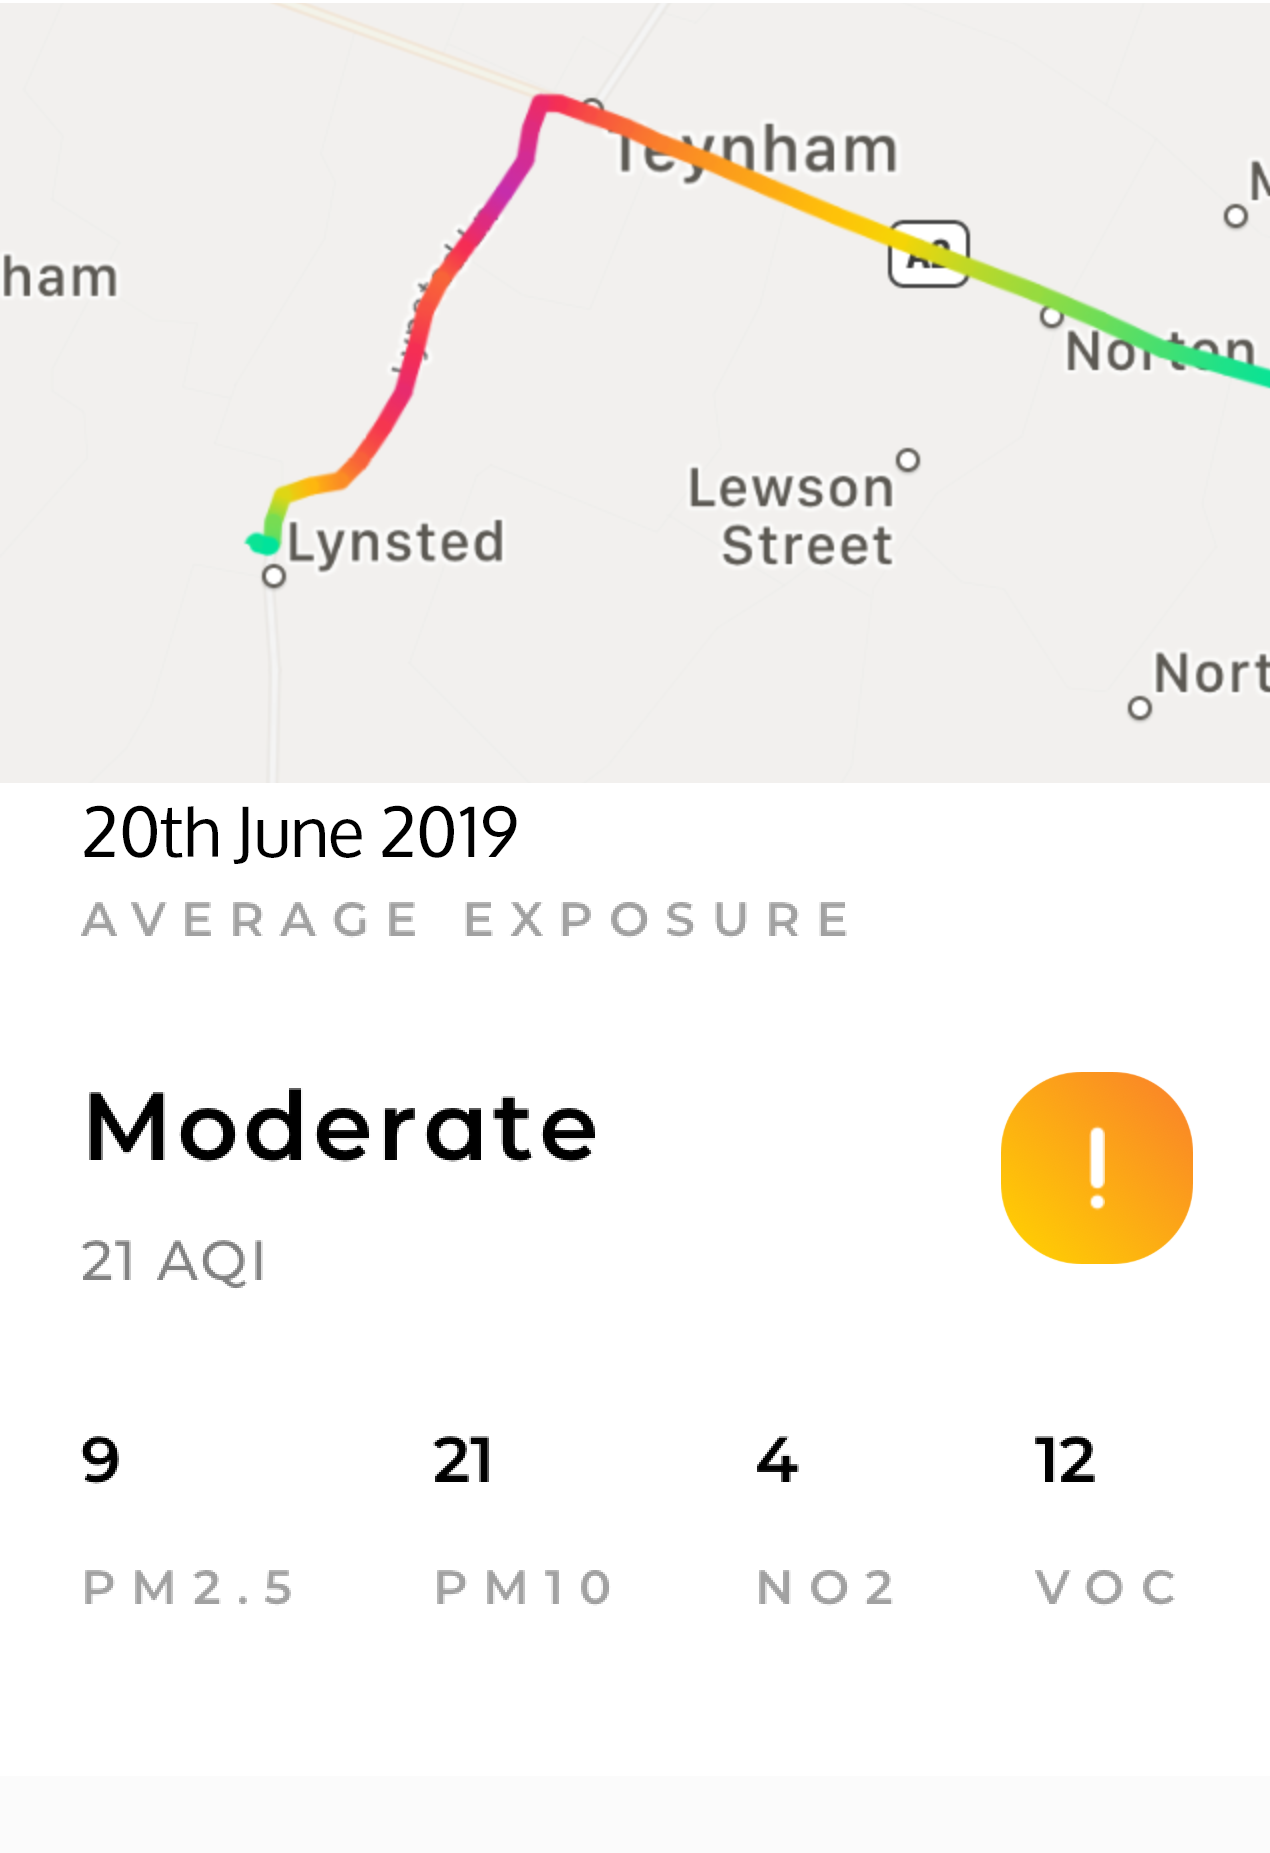
| 20th June Flow 1 Greenstreet Flow 2 Kingsdown |
7 |
19 |
6 |
14 |
LOW |
Wind: W - WSW (17kph). Rain: 0.7mm. The third "Low Pollution" day in the last four months! | ||
| 9 | 21 | 4 | 12 | MODERATE | Flow 2: Graph & Map: Moderate. AQMA5 saw pollution up Lynsted Lane. A 'hot spot' in a marginal LOW/MODERATE. | |||
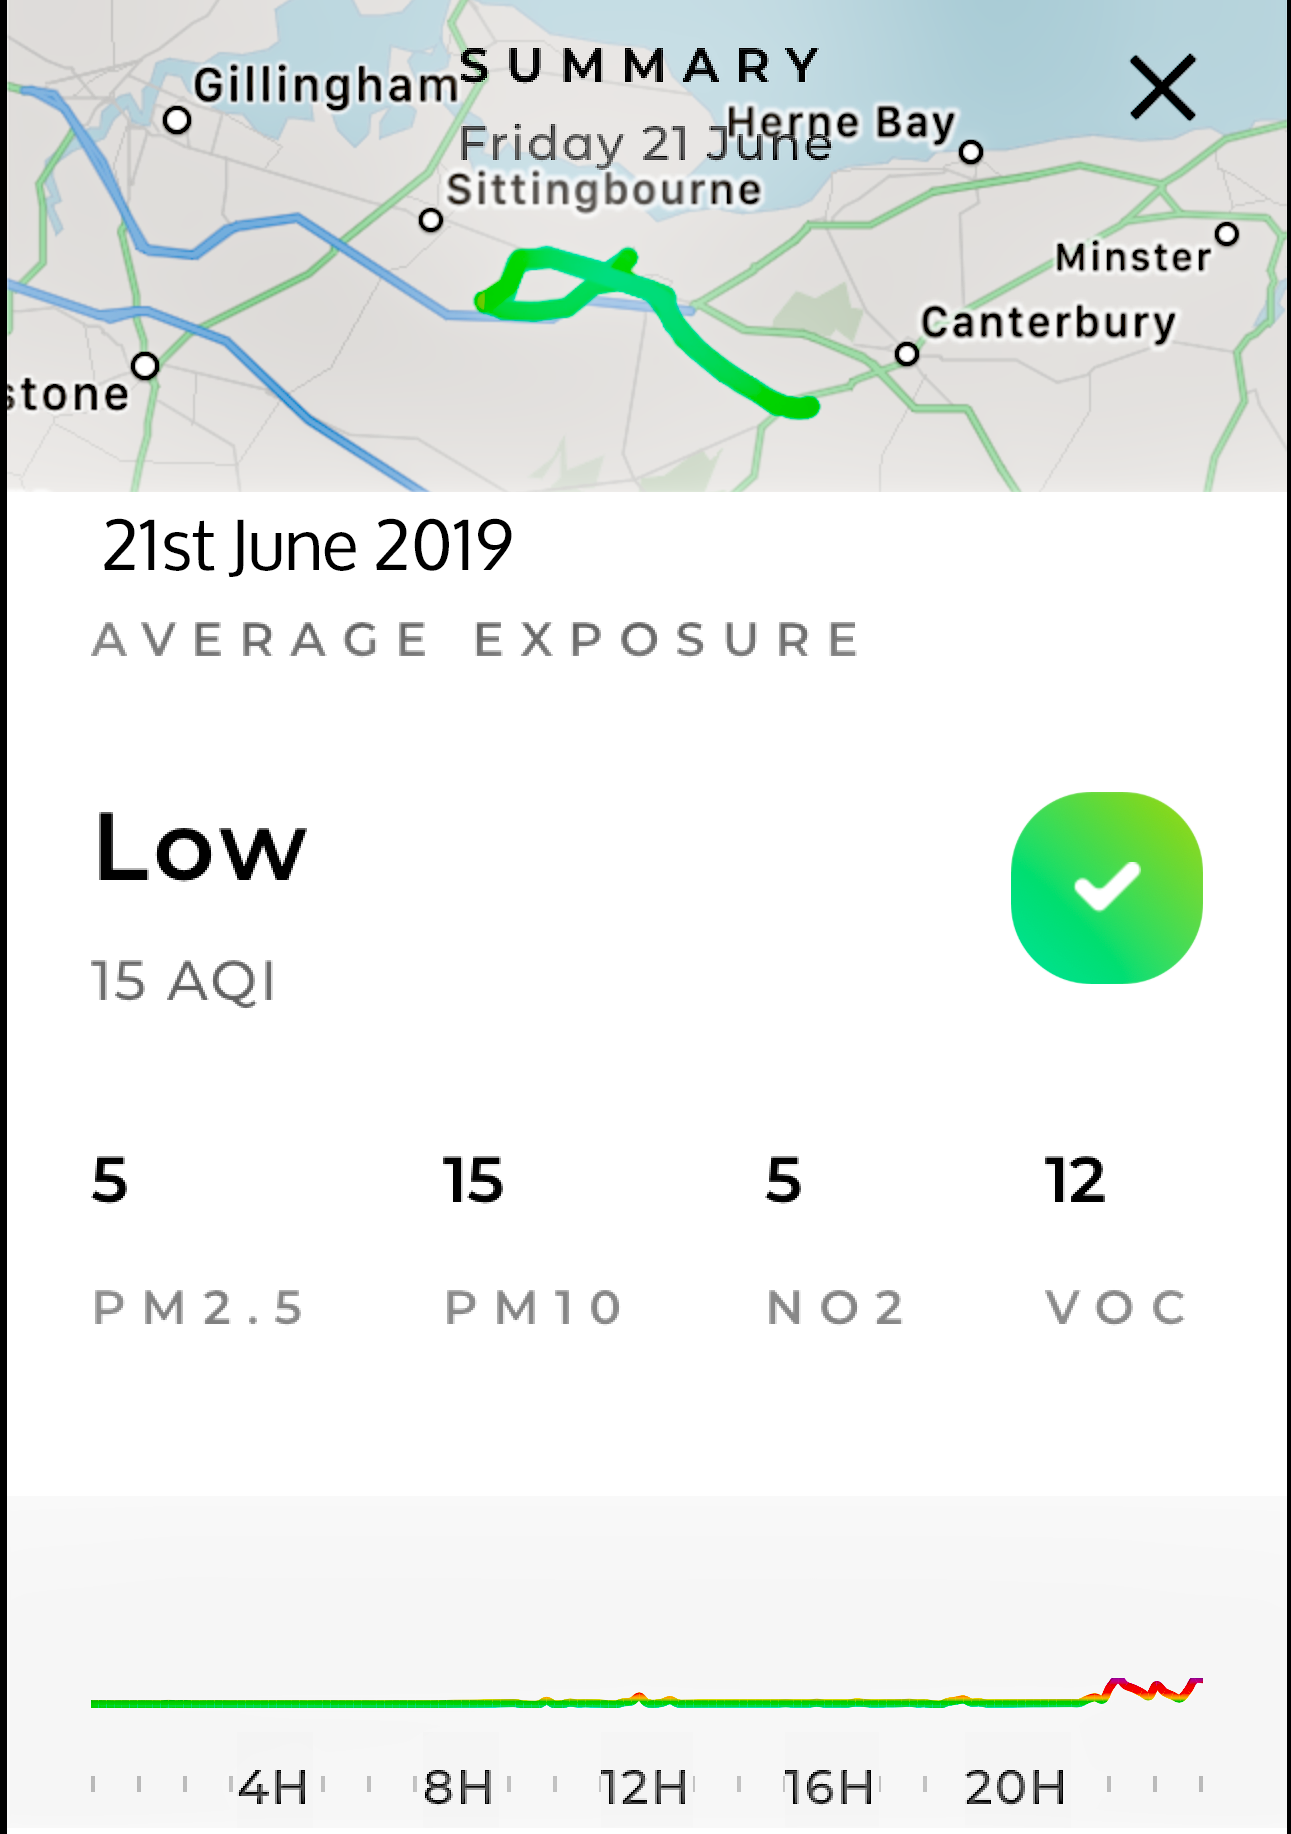
| 21st June Flow 1 Greenstreet Flow 2 Kingsdown |
NO LOCAL DATA | Fourth LOW pollution day of the year! Wind: W - SW - SSW (10kph). Rain: 0.60mm | ||||||
| 5 | 15 | 5 | 12 | LOW |
Flow 2: Graph: LOW Pollution across the A2. Very firmly "Low" pollution out and about | |||
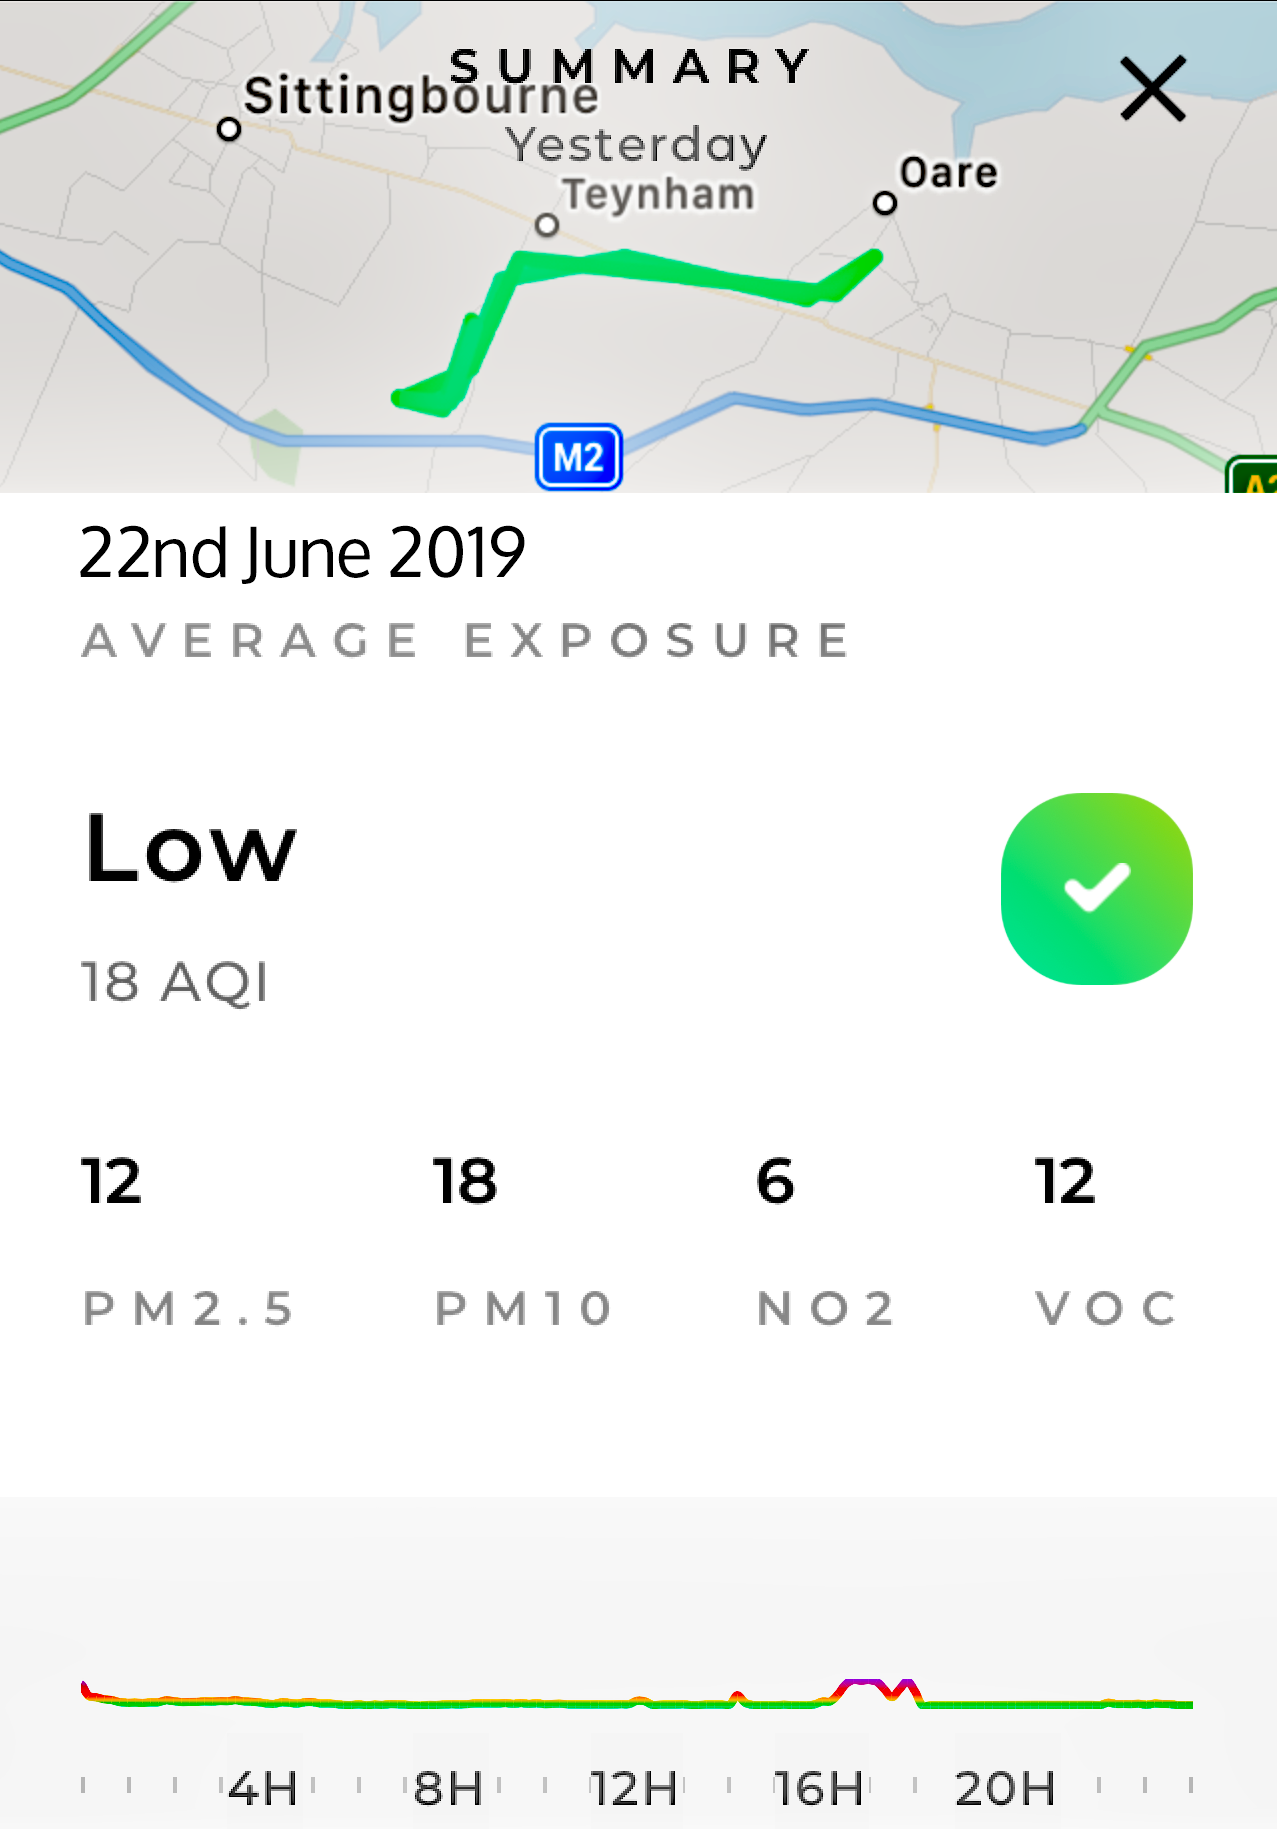
| 22nd June Flow 1 Greenstreet Flow 2 Kingsdown |
9 |
23 |
7 |
11 |
MODERATE | Wind: S - SE - E - ENE (11kph). Rain: 0.30mm | ||
| 12 | 18 | 6 | 12 | LOW | Flow 2: Graph: Good Air Quality in the countryside. Low with high patch in the early evening. | |||
| 23rd June Flow 1 |
16 |
28 |
5 |
13 |
MODERATE | Wind: ENE - E - ESE (15kph). Rain: 0.60mm | ||
| 24th June Flow 1 |
14 |
23 |
5 |
12 |
MODERATE | Wind: SSE - S - W - WSW - S - NW (20kph). Rain: 3.10mm | ||
| 25th June Flow 1 |
11 |
20 |
5 |
17 |
MODERATE | Wind: NNE - NE - E (12kph). Rain: 5.6mm | ||
| 26th June Flow 1 |
- |
- |
- |
- |
NO DATA | Wind: NNE - E (12kph). Rain: 5.60mm | ||
| 27th June Flow 1 Car. |
8 |
22 |
2 |
12 |
MODERATE | Wind: NE - ENE (30kph). Rain: DRY. The air quality is still not ideal, even in the countryside. | ||
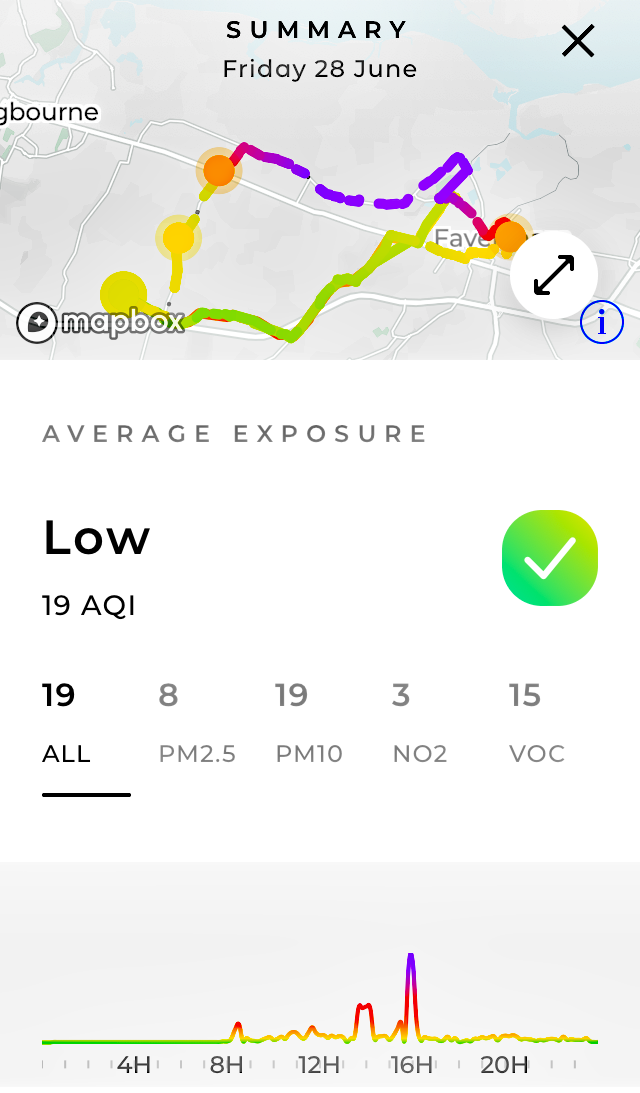
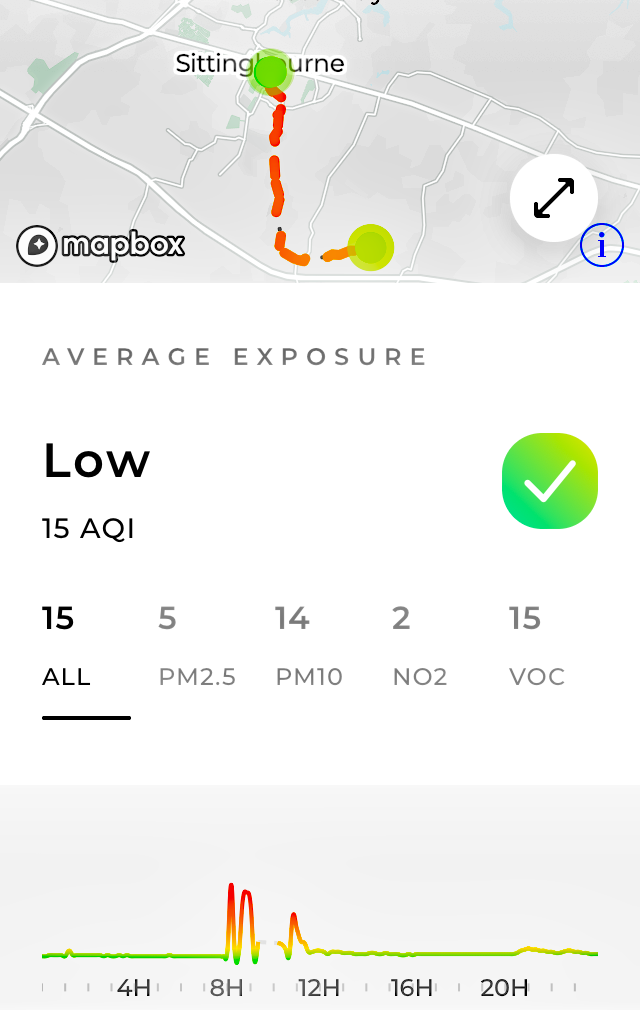
| 28th June Flow 1 |
13 |
32 |
5 |
12 |
NO LOCAL DATA | Flow 1: at the coast (sea spray made the Flow go Red/High.). Wind: ENE all day (24kph). Rain: Dry | ||
| 8 | 19 | 3 | 15 | LOW | Graph & Map: The Lower Road had a significant hike in pollution. The wind direction points to Sittingbourne industry, housebuilding in Bapchild, even Medway sources. | |||
| 29th June Flow 1 Travelling Flow 2 Kingsdown |
13 |
26 |
2 |
16 |
NORTH of the THAMES | Wind: E - SE - SSW (13kph). Rain: DRY. Not of much interest locally as I was north of the Thames. The balance of pollutants is close to Greenstreet pattern. | ||
| 5 | 14 | 2 | 15 | LOW | Graph: In the countryside - LOW. But when in and around Sittingbourne - MODERATE/HIGH | |||
| 30th June Flow 1 |
NO LOCAL DATA | Wind: W - WSW (18kph). Rain: 1.70mm FLOW CHANGED THE APP WITH SOME TEMPORARY DISRUPTION + ENHANCEMENTS TO GRAPH EACH POLLUTANT SEPARATELY IF WANTED. |
||||||
| JULY 2019 | ||||||||
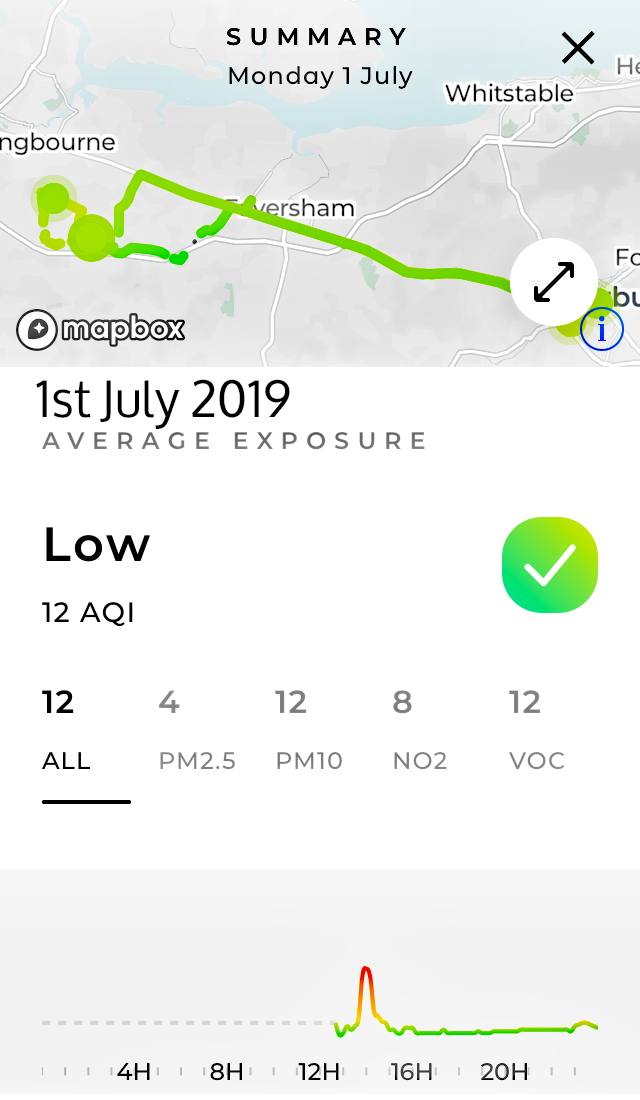
| 1st July Flow 1 Flow 2 |
6 |
17 |
5 |
14 |
NO LOCAL DATA | Wind: W - NNW. (17kph). Rain: 0.1mm. In the countryside | ||
4 |
12 |
28 |
12 |
MODERATE | Flow 2: Graph & Map: Notably NOx provides the peak | |||
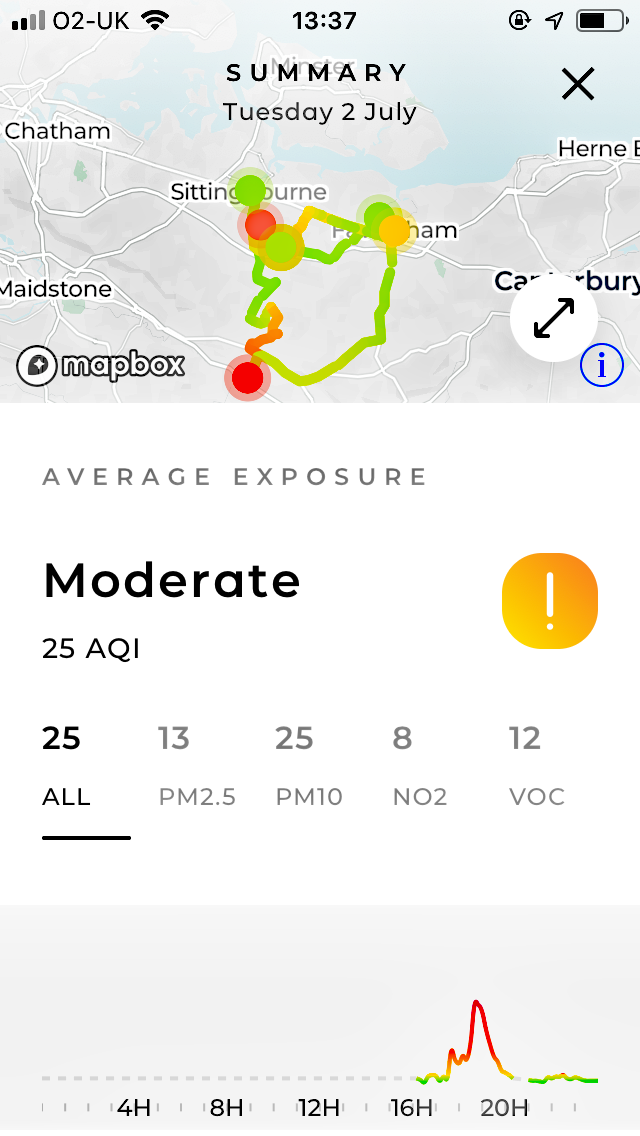
| 2nd July Flow 1 Flow 2 |
6 |
18 |
9 |
12 |
NO LOCAL DATA | Wind: NNW - N - NE - ENE (11kph). Rain: 0.3mm. Driving/walking in the countryside. | ||
| 13 | 25 | 8 | 12 | MODERATE | Flow 2: Graph & Map: Complex comparable hotspots around Sittingbourne and M20. | |||
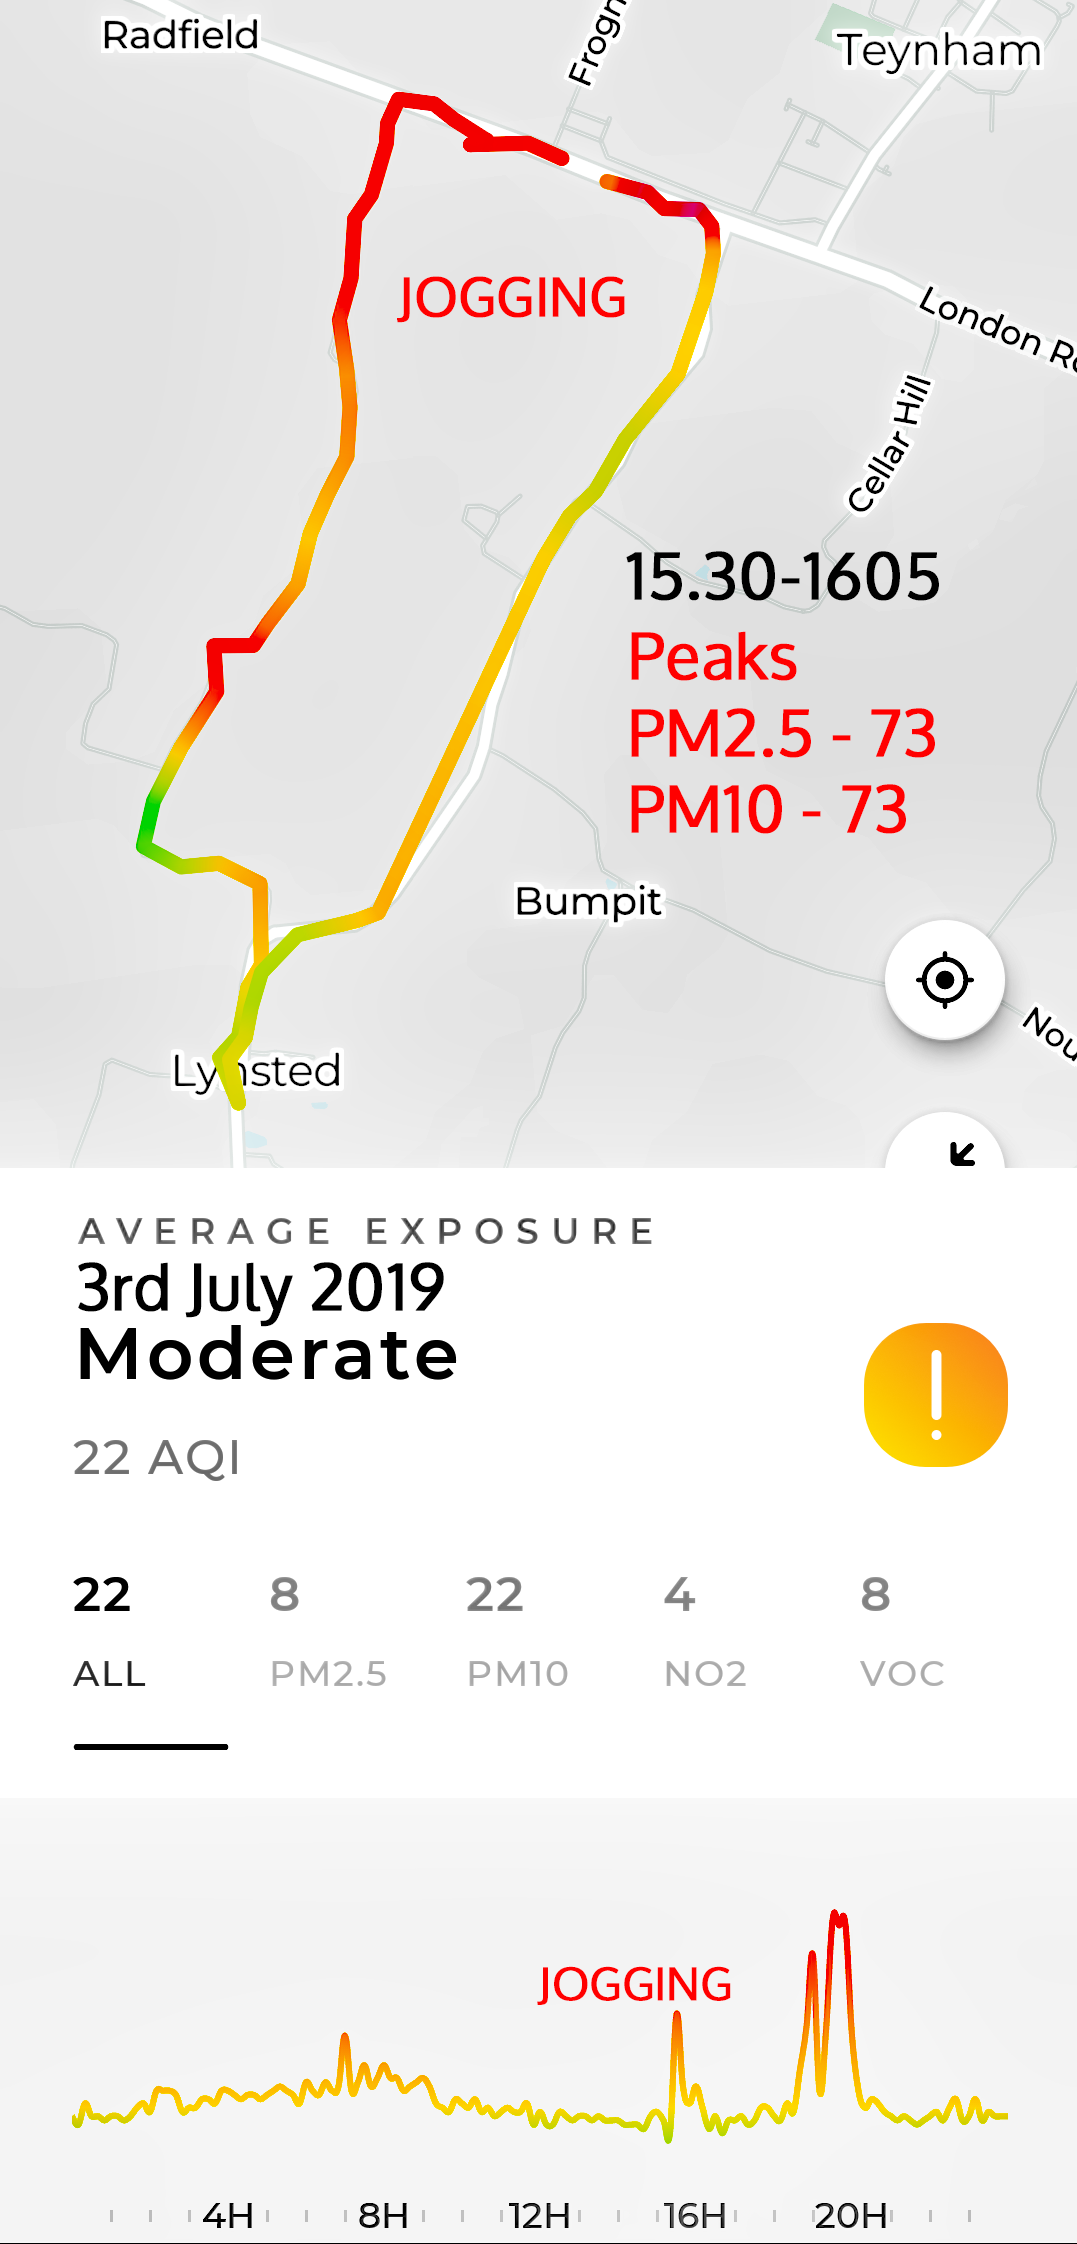
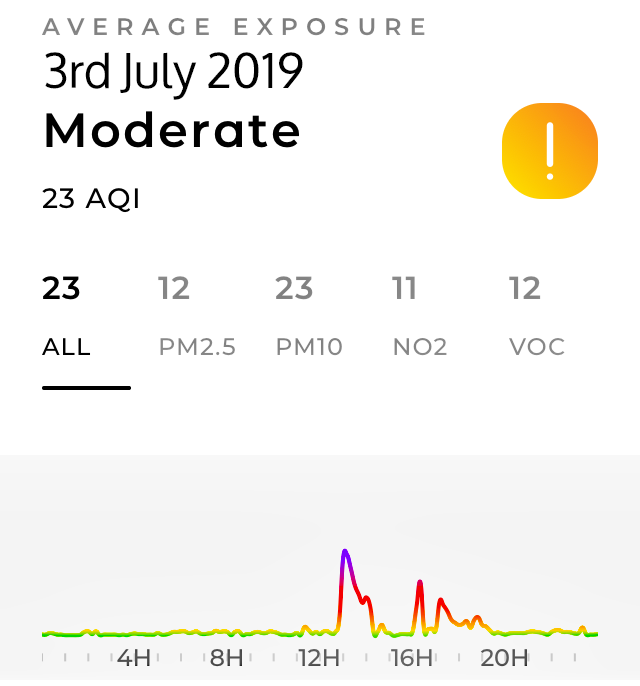
| 3rd July Flow 1 Greenstreet Flow 2 |
8 |
22 |
4 |
8 |
MODERATE | Graph & Jogging Map: Wind: ESE - NE - ENE (14kph). Rain: 0.10mm. HIGH peaks on jog towards Lynsted Village | ||
| 11 | 25 | 4 | 12 | MODERATE | Flow 2: Graph: LOW pollution until moving near the A2 hotspots in traffic conditions. | |||
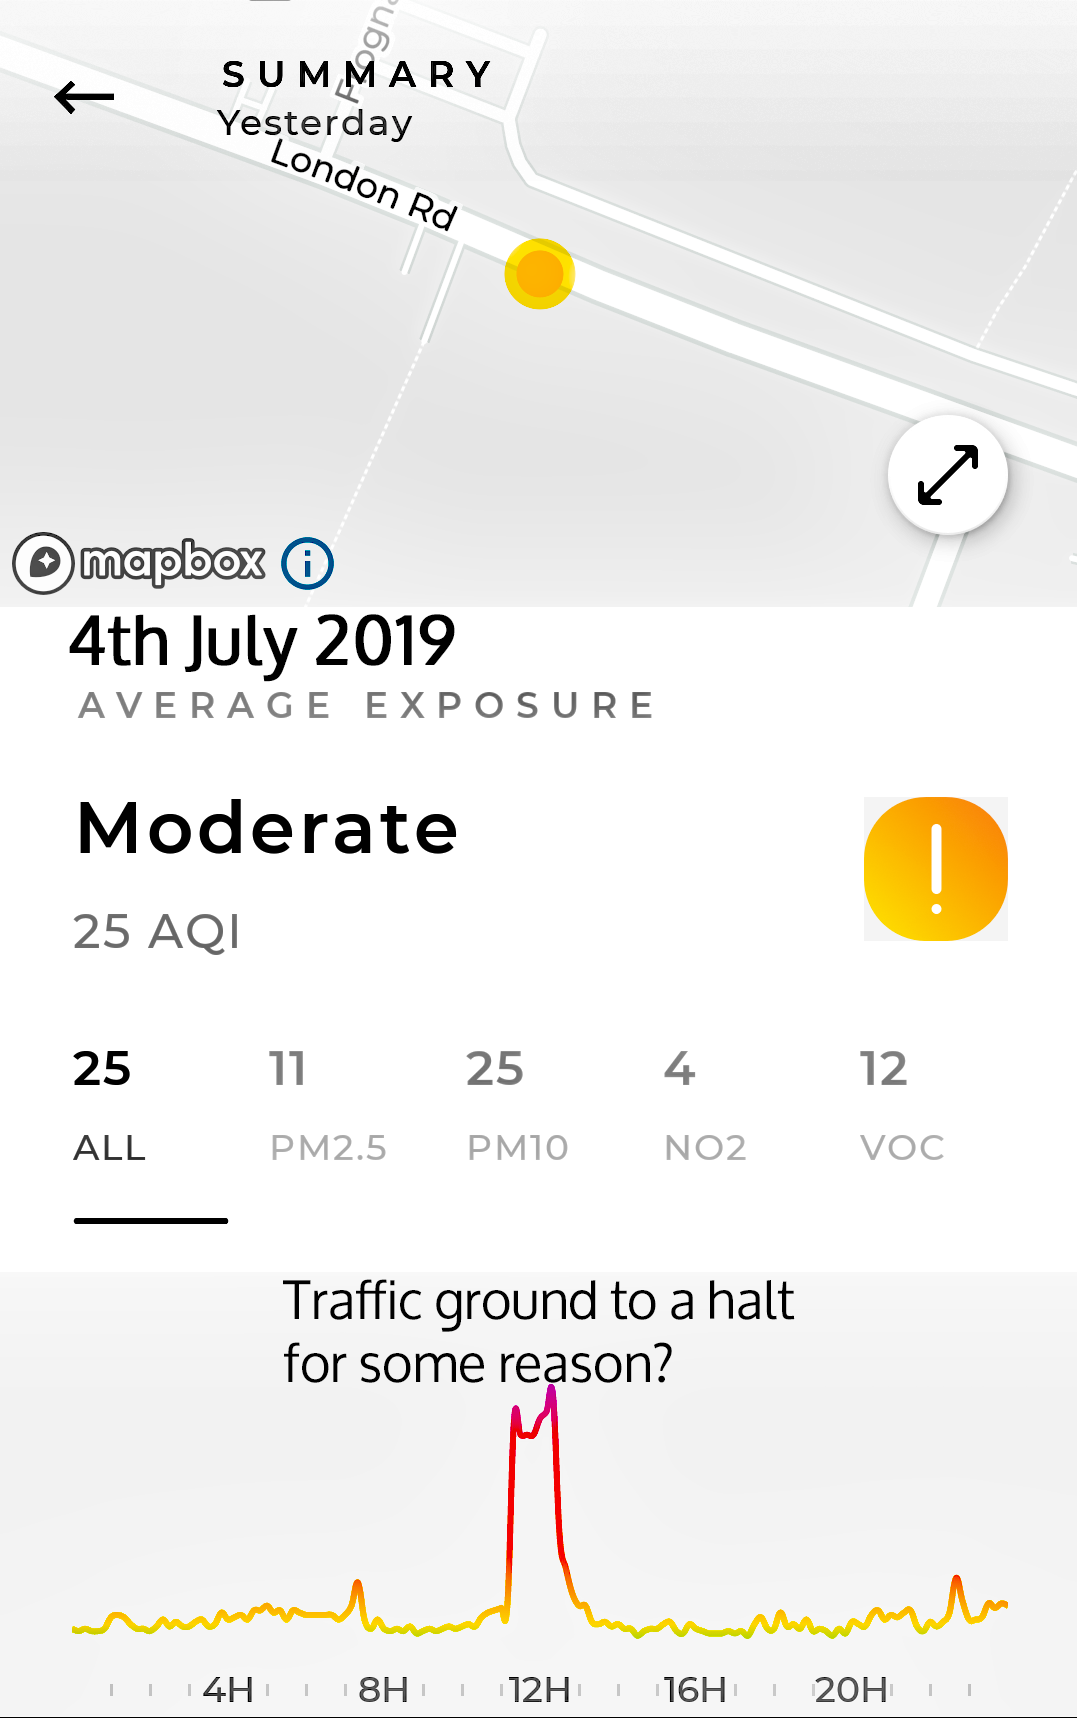
| 4th July Flow 1 Flow 2 |
11 |
25 |
4 |
12 |
MODERATE | Flow 1: Graph: Wind: ENE - NE - ENE - SW (13kph). Rain: DRY. A very serious extended peak at midday as traffic came to a halt for an unknown reason. | ||
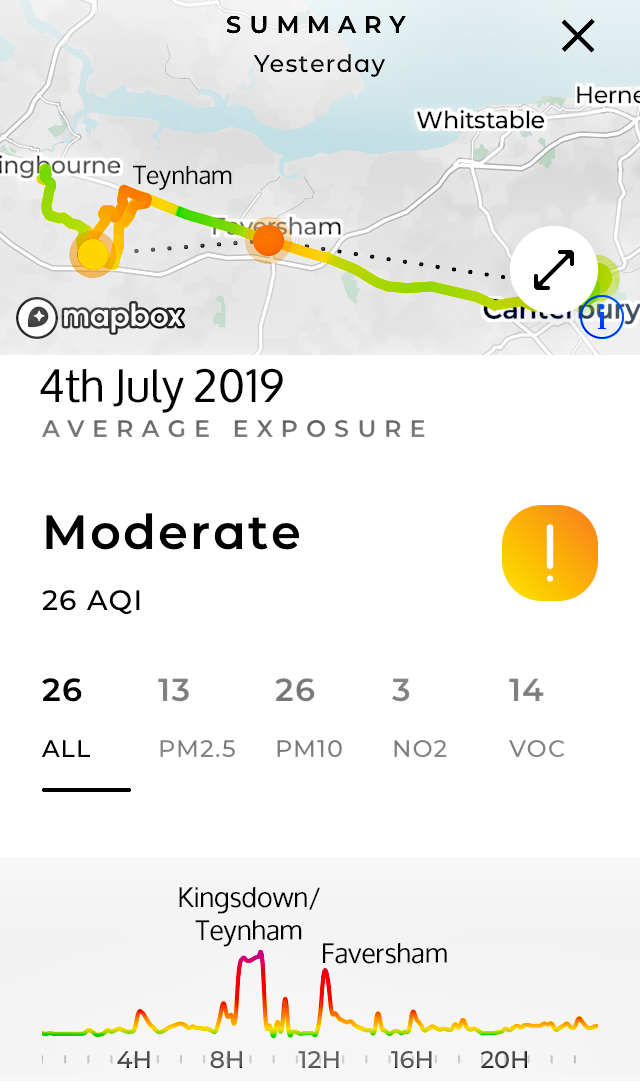
| 13 | 26 | 3 | 14 | MODERATE | Graph and Map: Hotspot areas - Sittingbourne, Teynham, Kingsdown & Faversham | |||
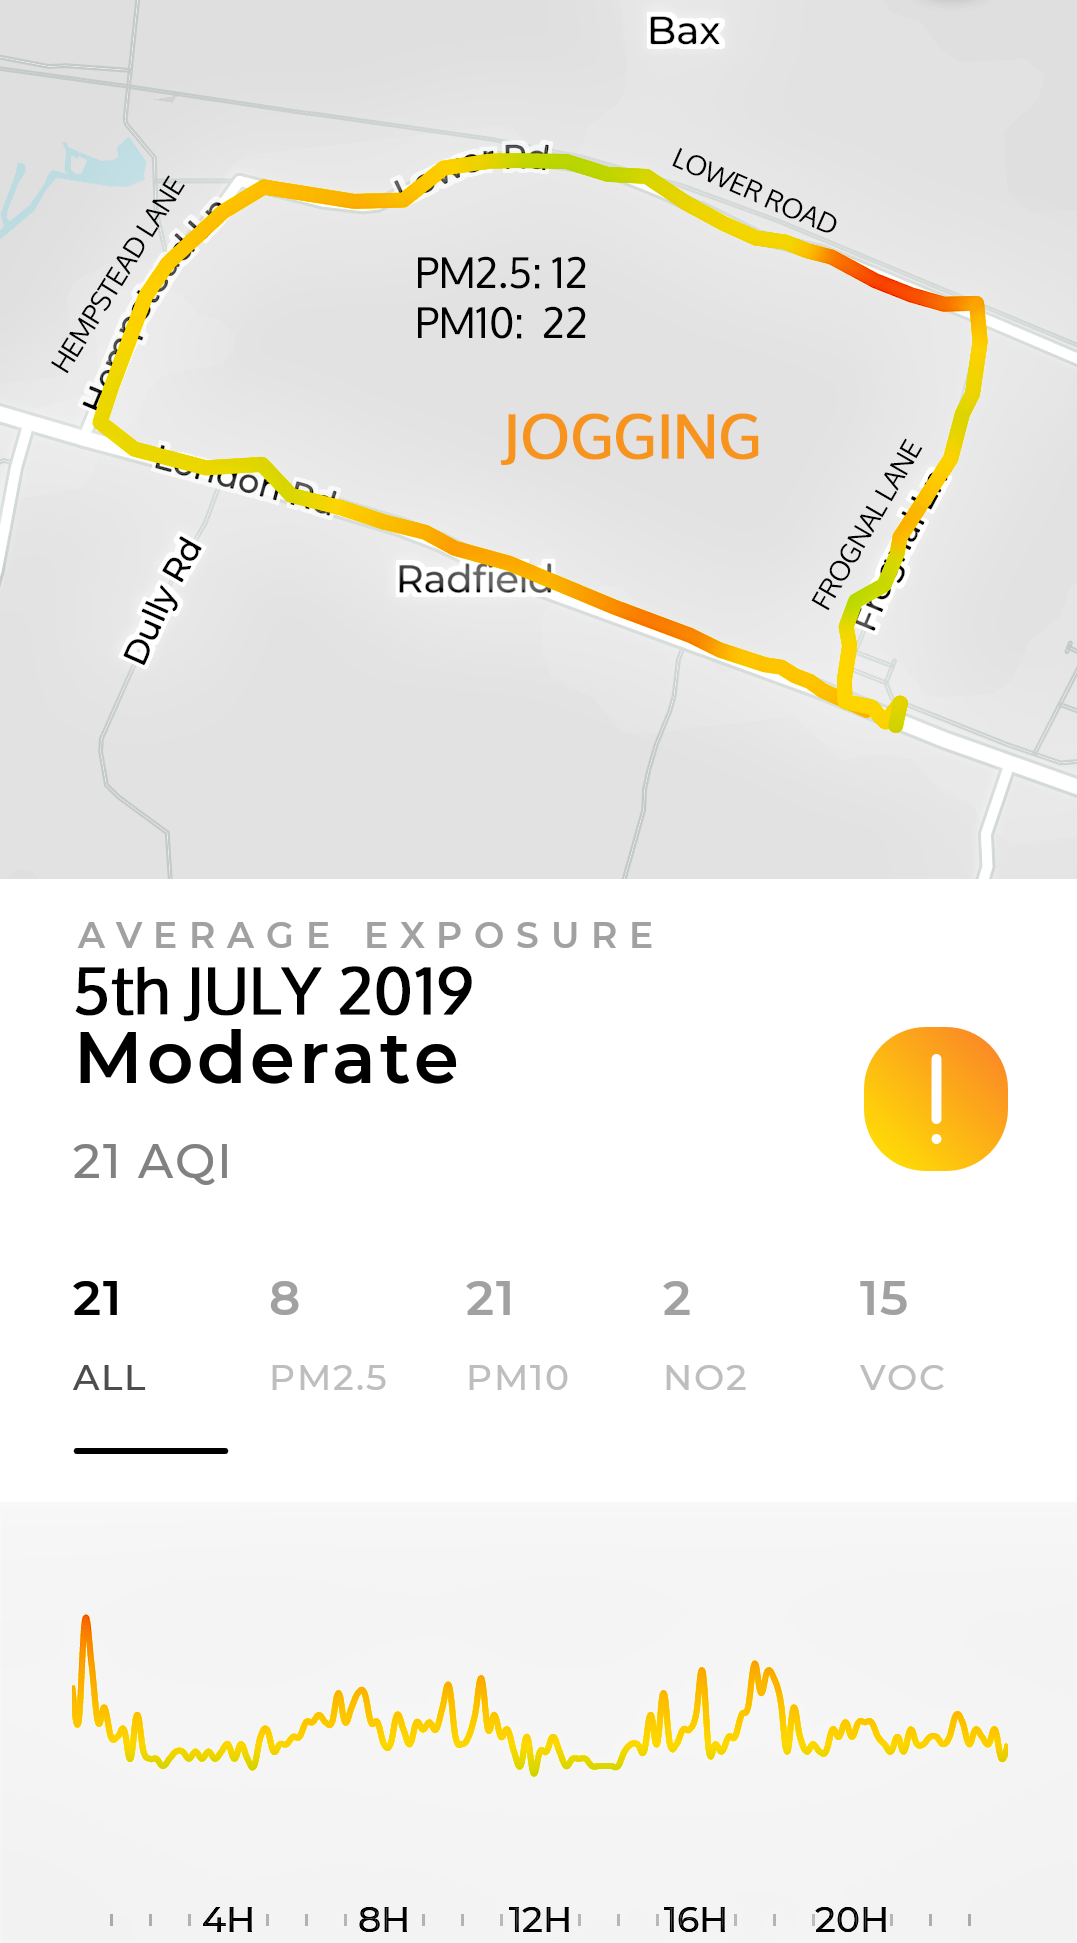
| 5th July Flow 1 Flow 2 |
8 |
21 |
2 |
15 |
MODERATE | Flow 1: Graph and Jogging Map: Wind: SW - NW - NNW - W (6kph). Rain: DRY. Peaks - A2, Tonge Lane, Lower Road. | ||
| FLOW 2: Has had problems since a driver update. Run from iOS tech. PLUME LABS ARE AWARE. |
||||||||
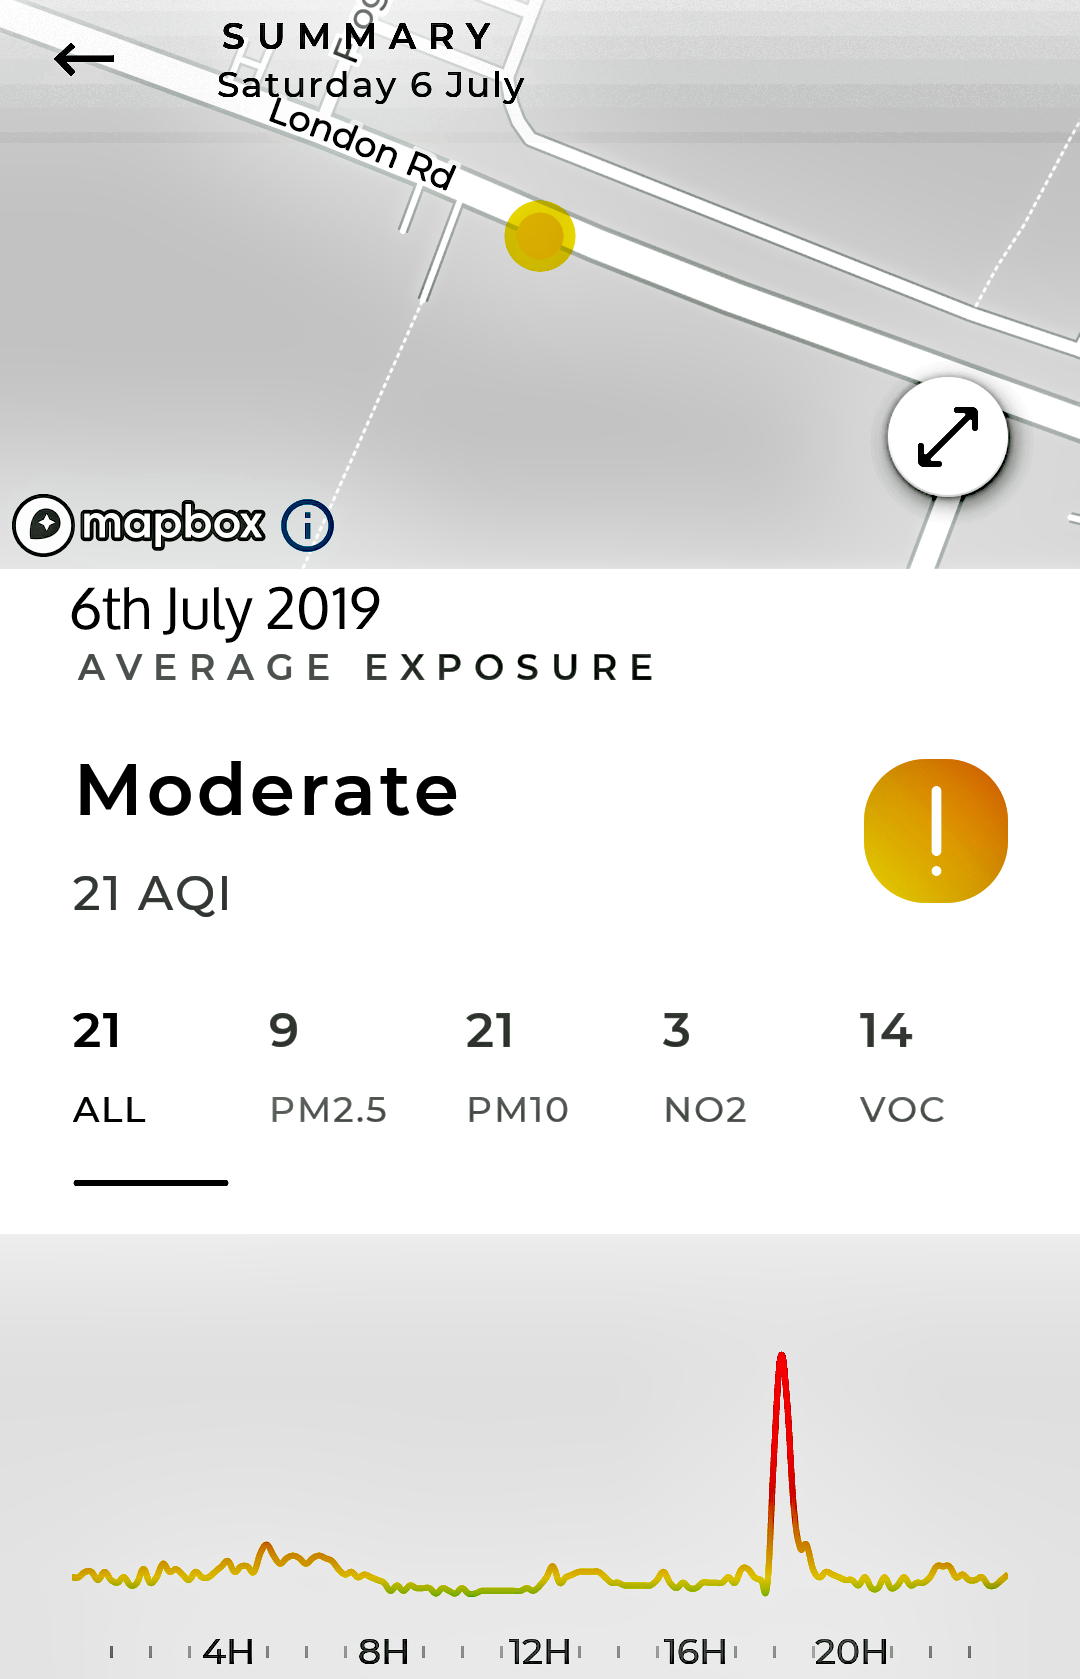
| 6th July Flow 1 |
9 |
21 |
3 |
14 |
MODERATE | Flow 1: Graph: High Peak at 6.15pm | ||
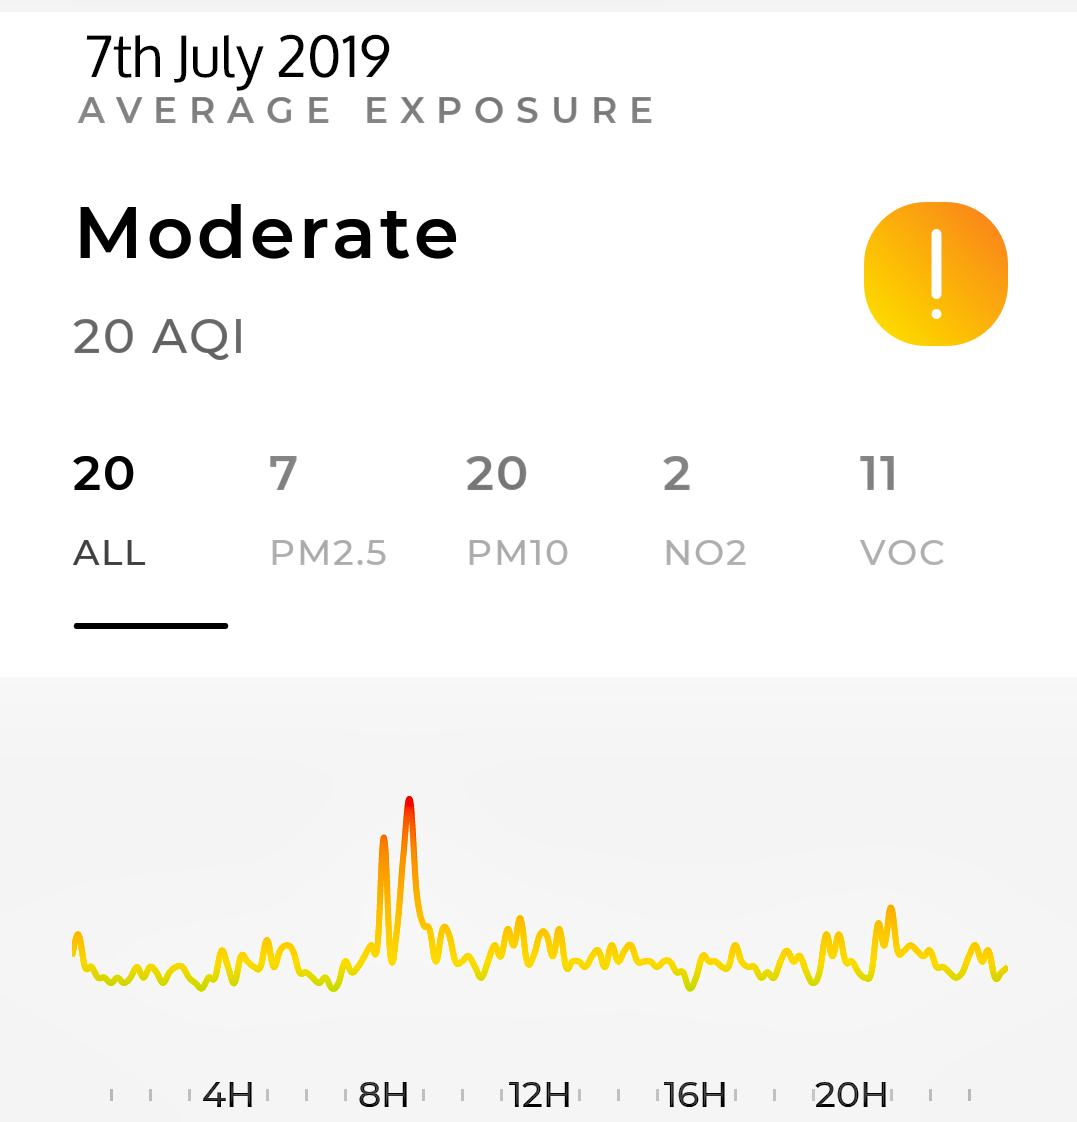
| 7th July Flow 1 |
7 |
20 |
2 |
11 |
MODERATE | Flow 1: Graph: Morning Peaks 8am-9am. | ||
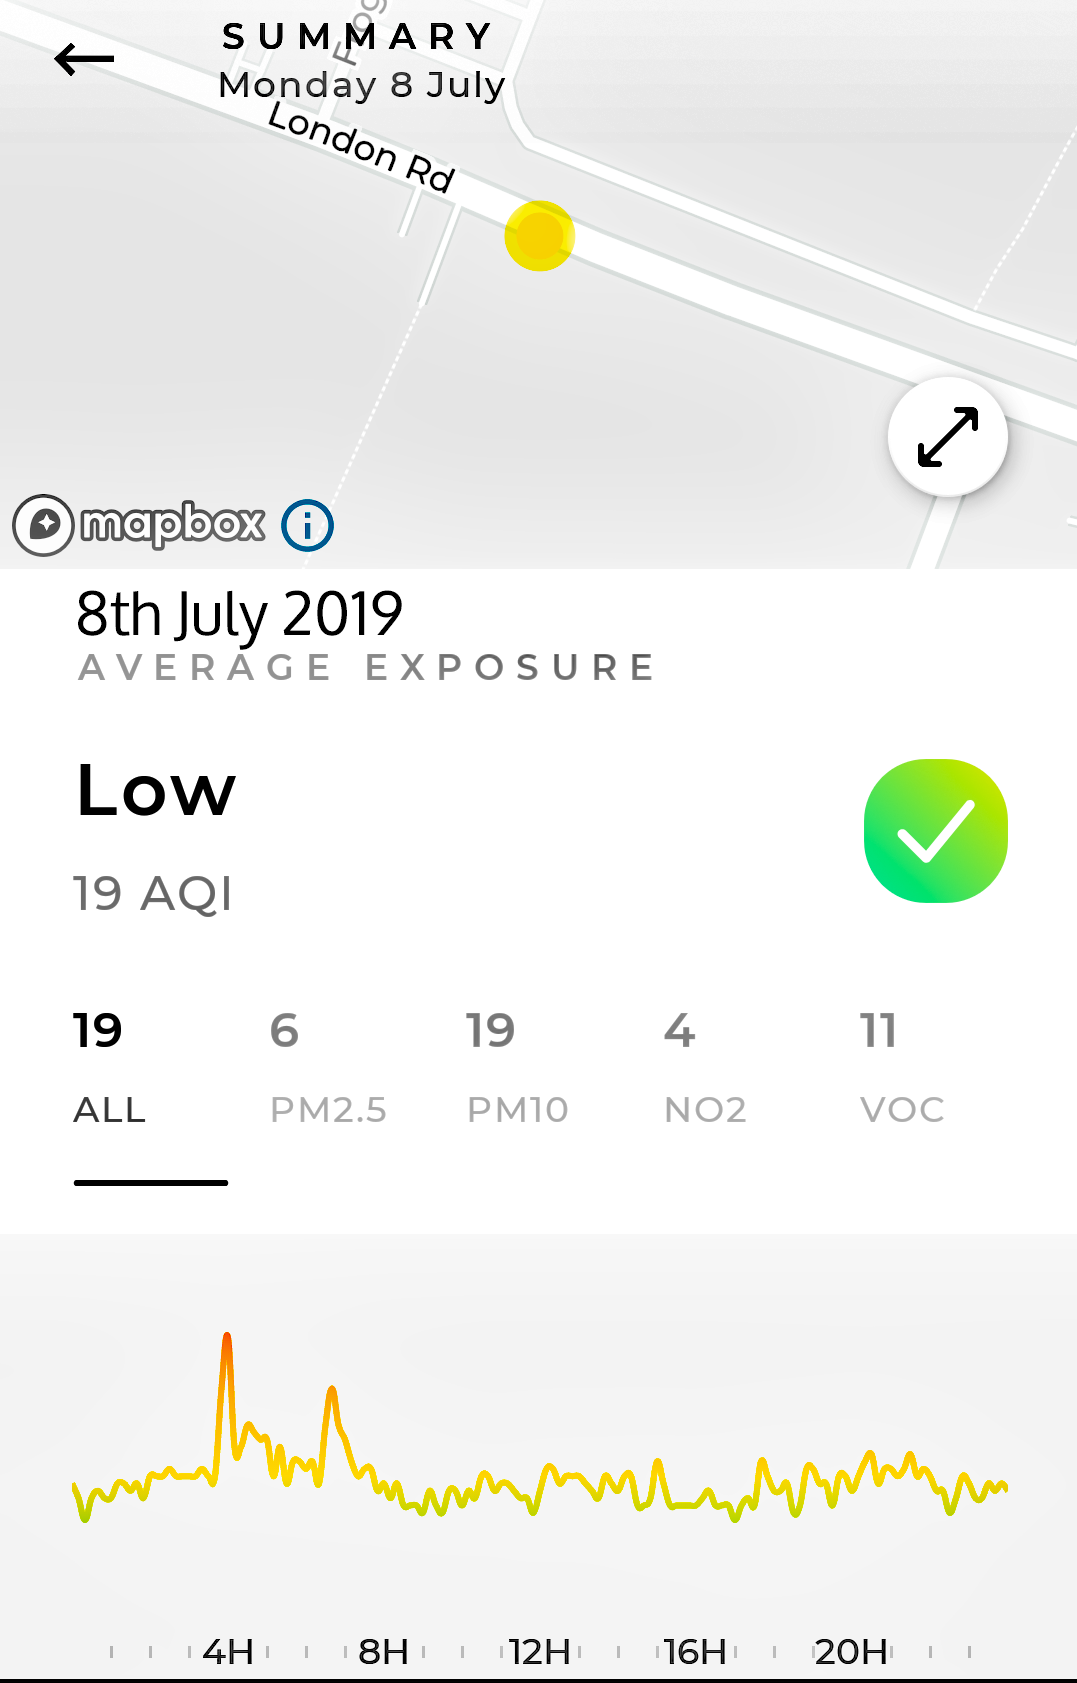
| 8th July Flow 1 |
6 |
19 |
4 |
11 |
LOW |
Flow 1: Graph: Early Morning mild peaks. | ||
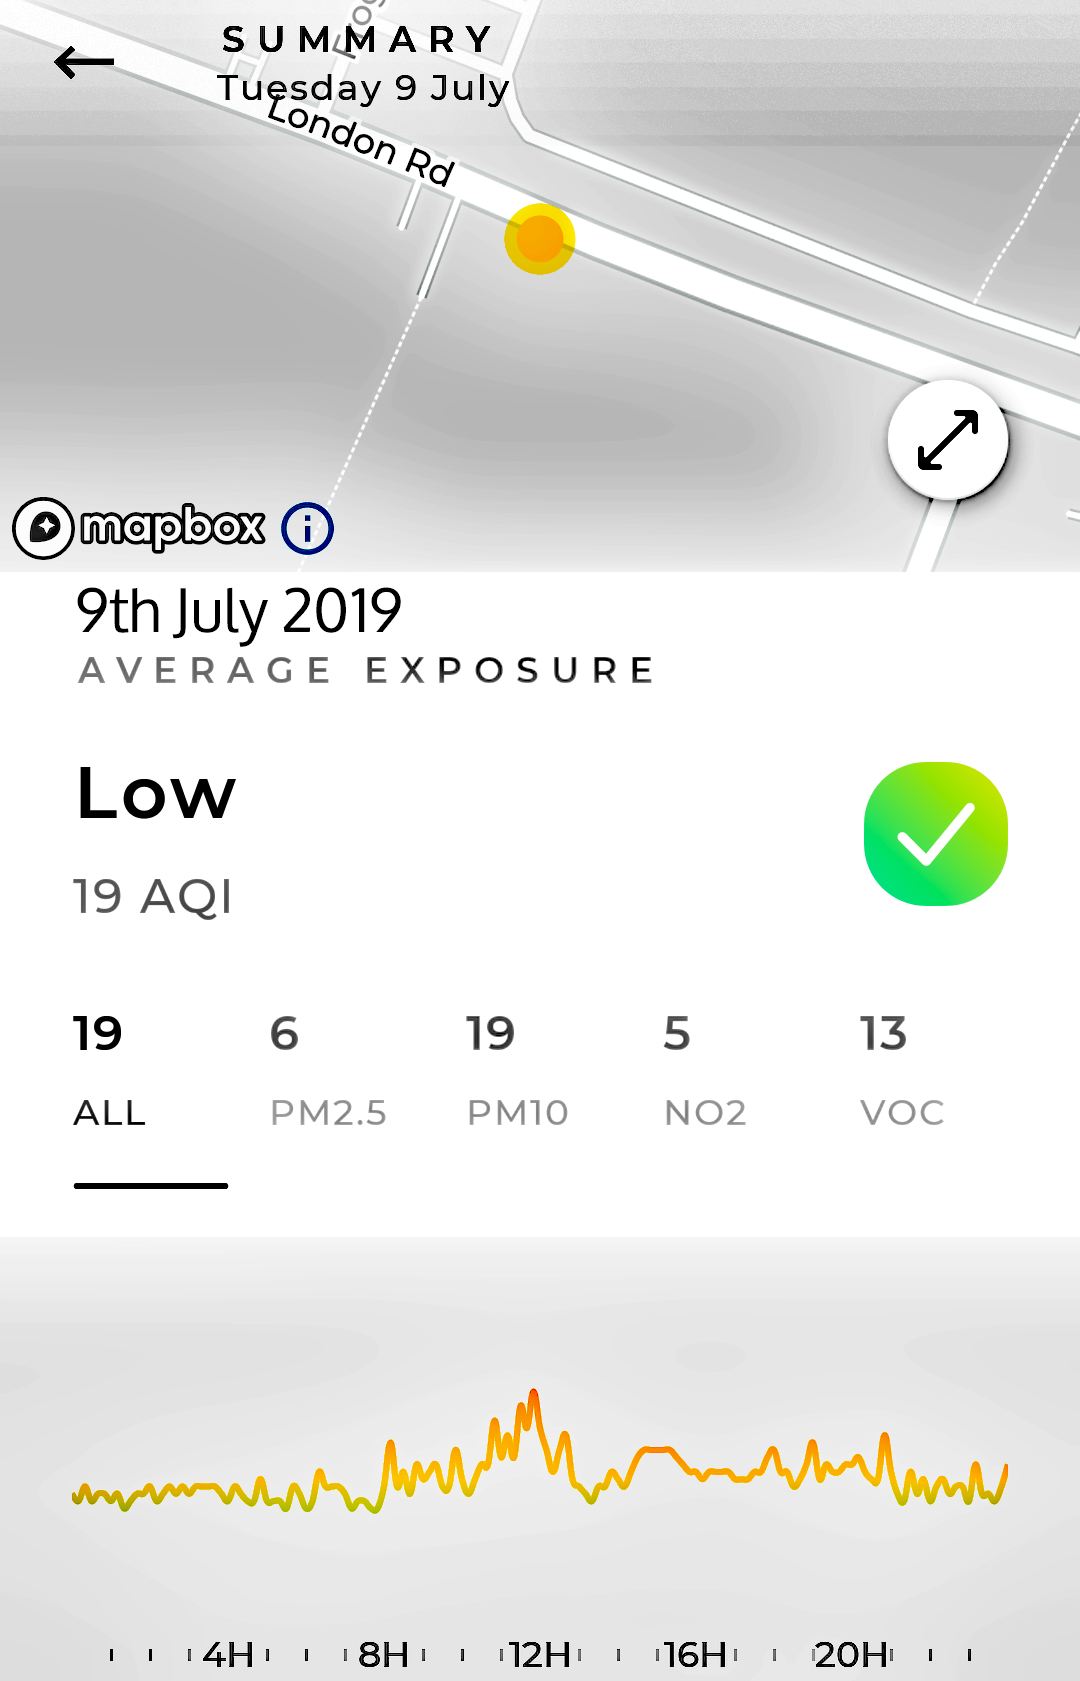
| 9th July Flow 1 |
6 |
19 |
5 |
13 |
LOW |
Flow 1: Graph: | ||
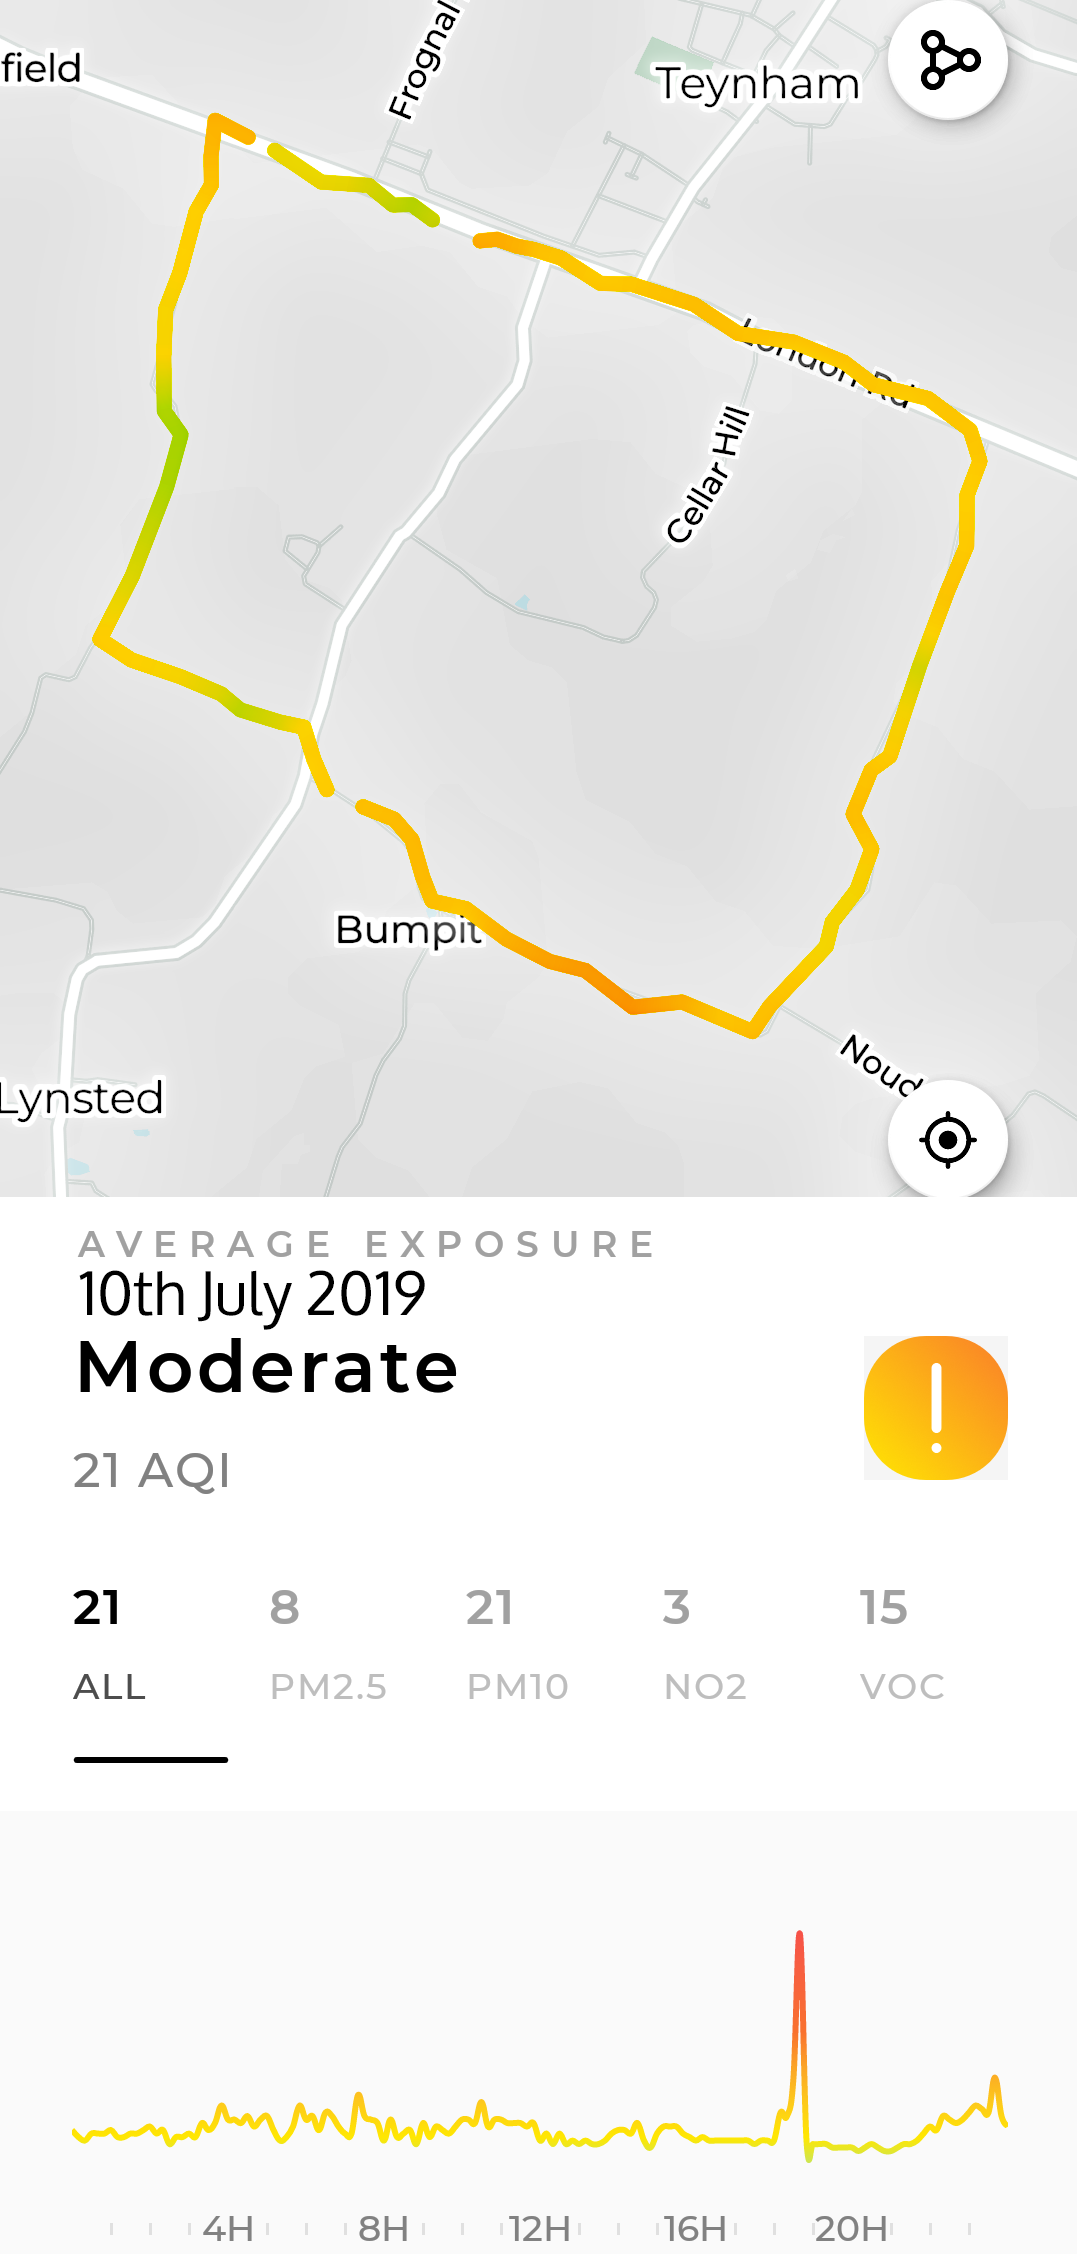
| 10th July Flow 1 |
8 |
21 |
3 |
15 |
MODERATE | Flow 1: Graph: | ||
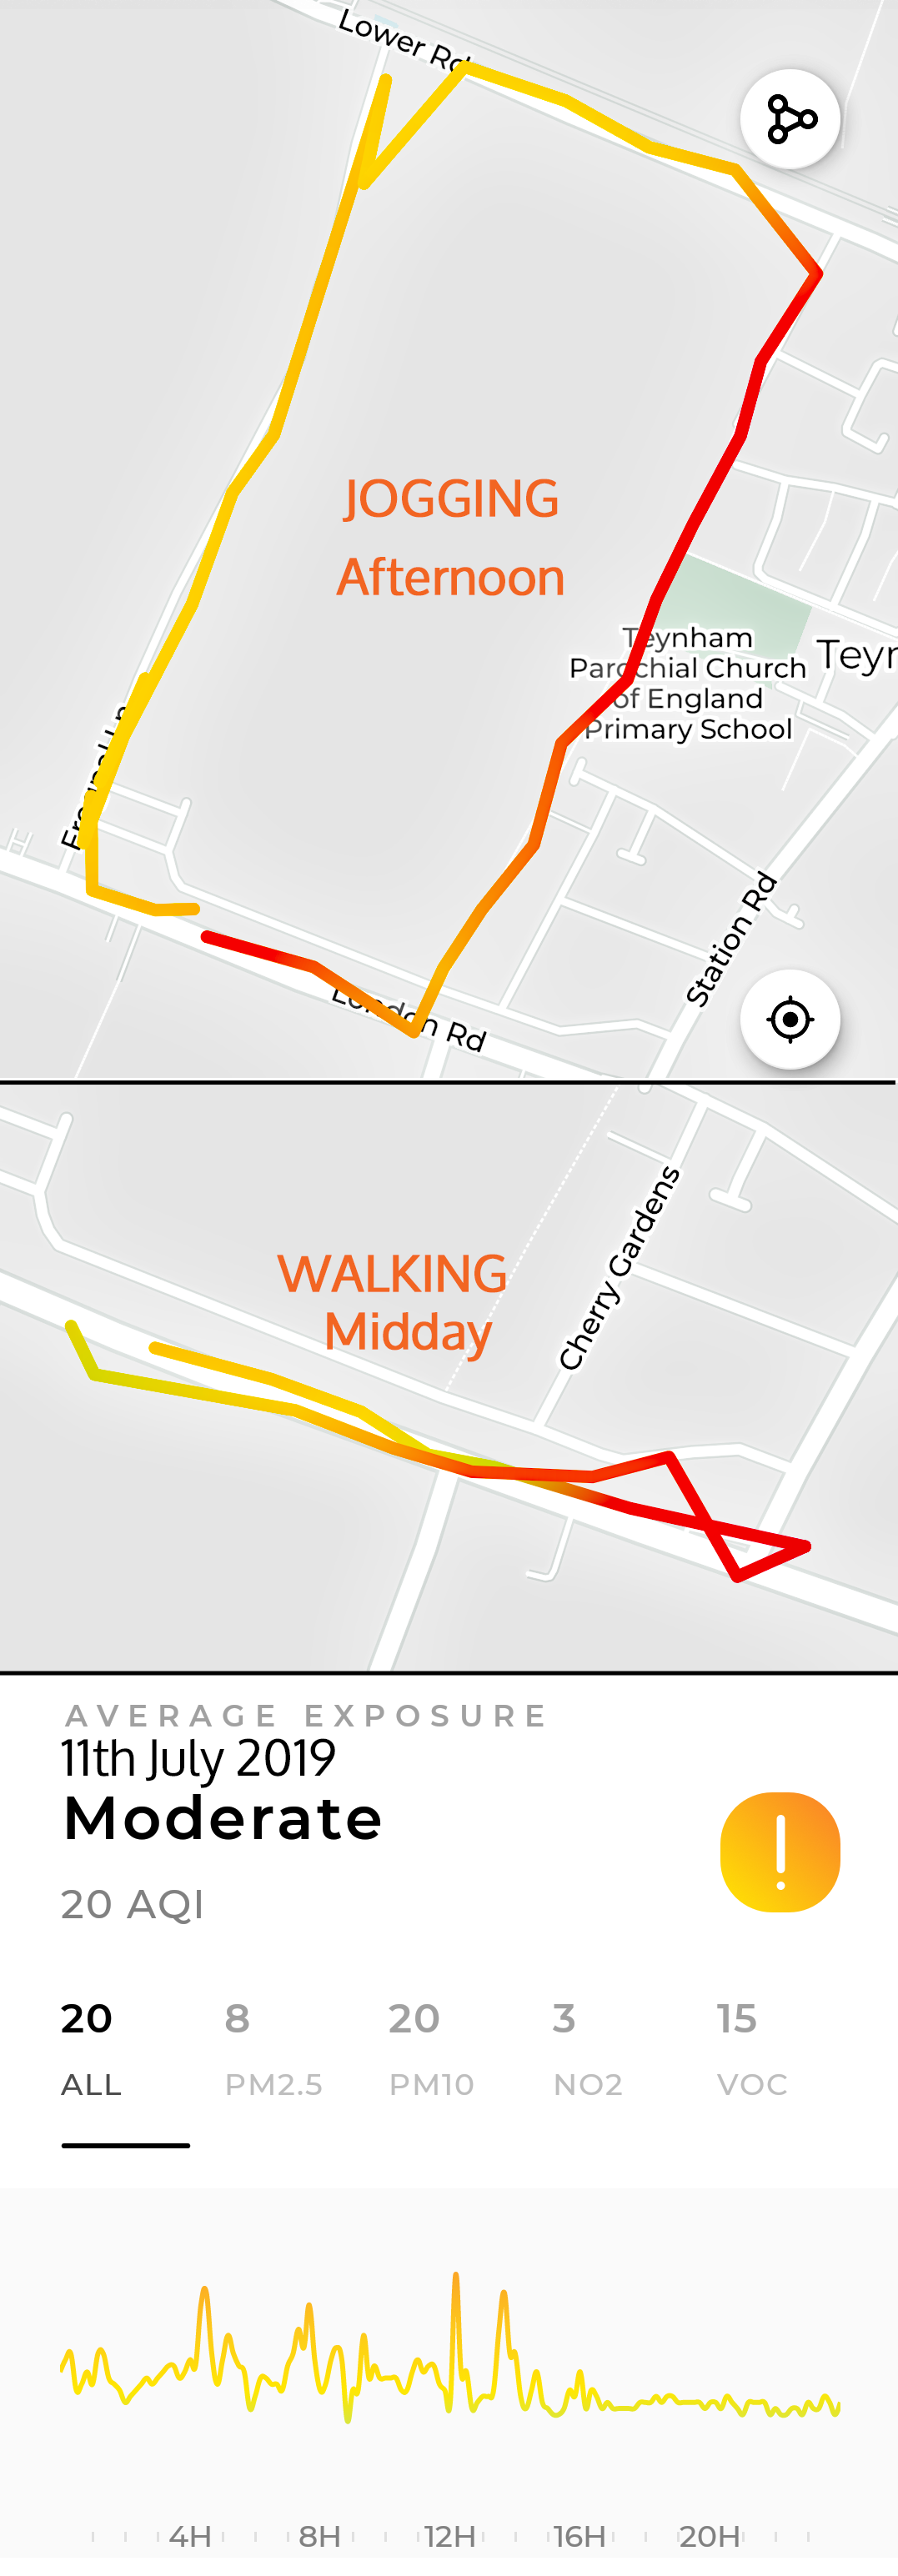
| 11th July Flow 1 |
8 |
20 |
3 |
15 |
MODERATE | Flow 1: Graph: 2 maps - Short Walk & Jogging. Higher readings in AQMA area and down Station Road. | ||
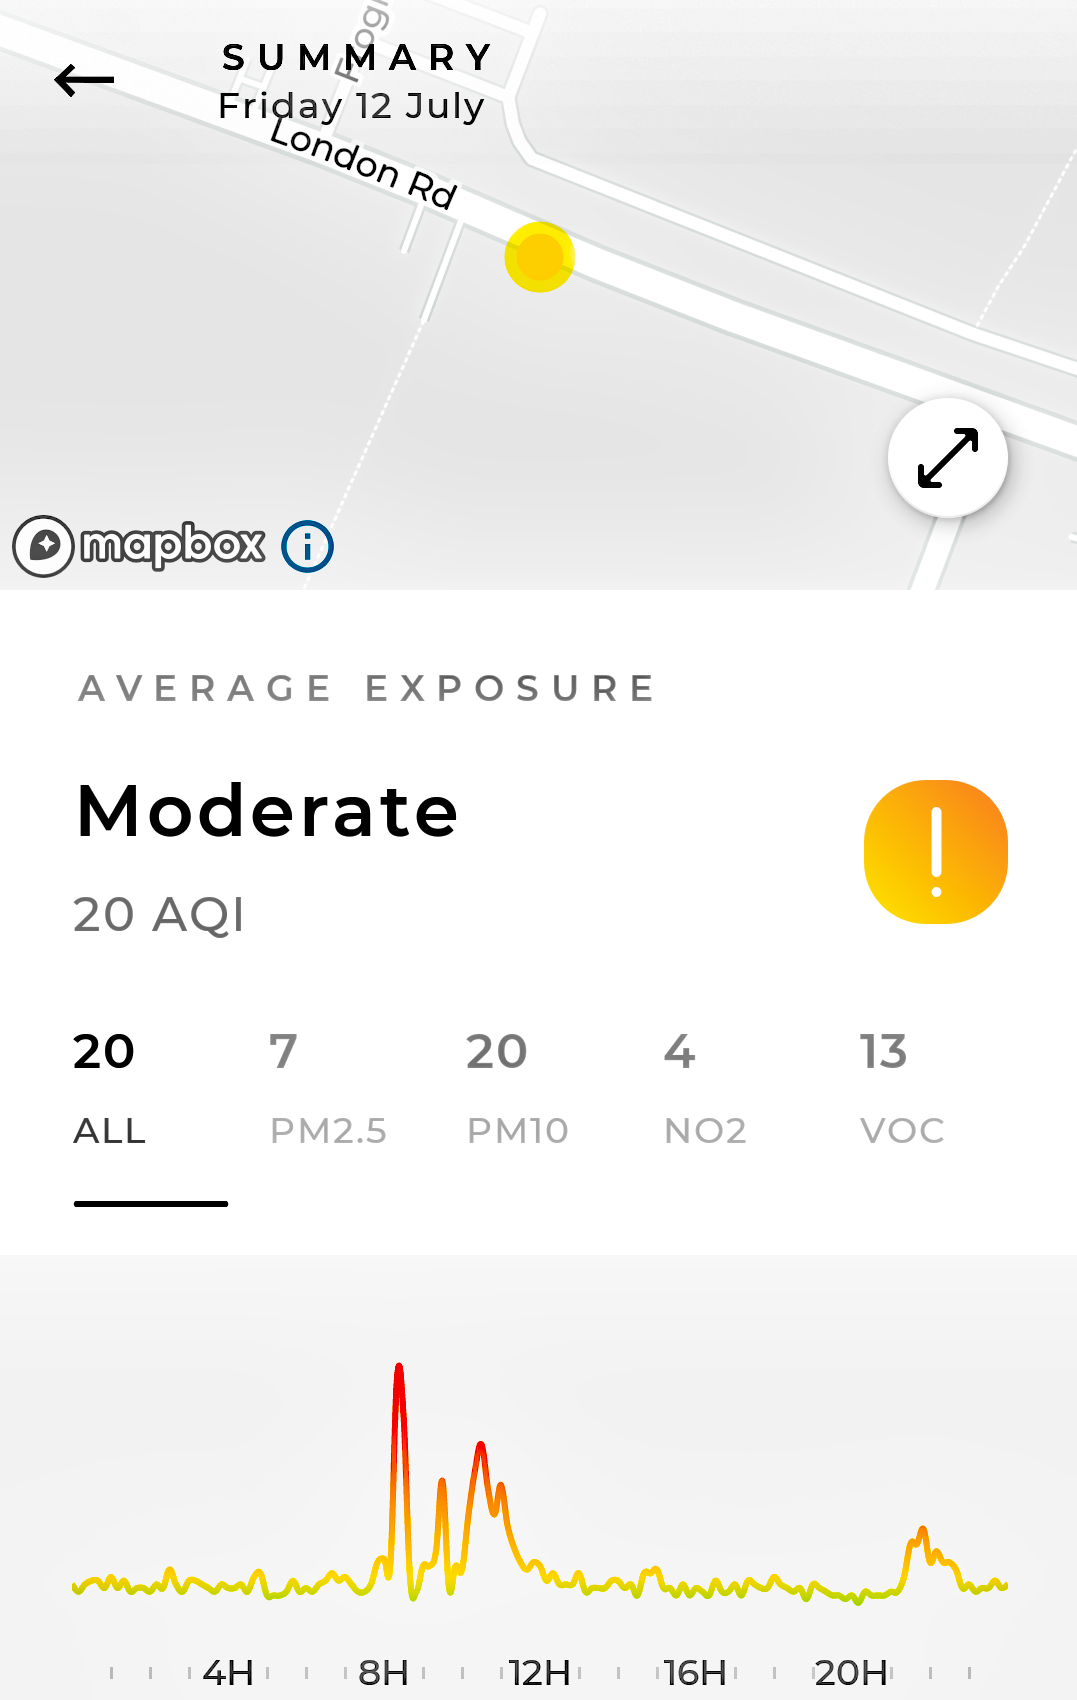
| 12th July | 7 | 20 | 4 | 13 | MODERATE | Flow 1: Graph: Congested all morning. | ||
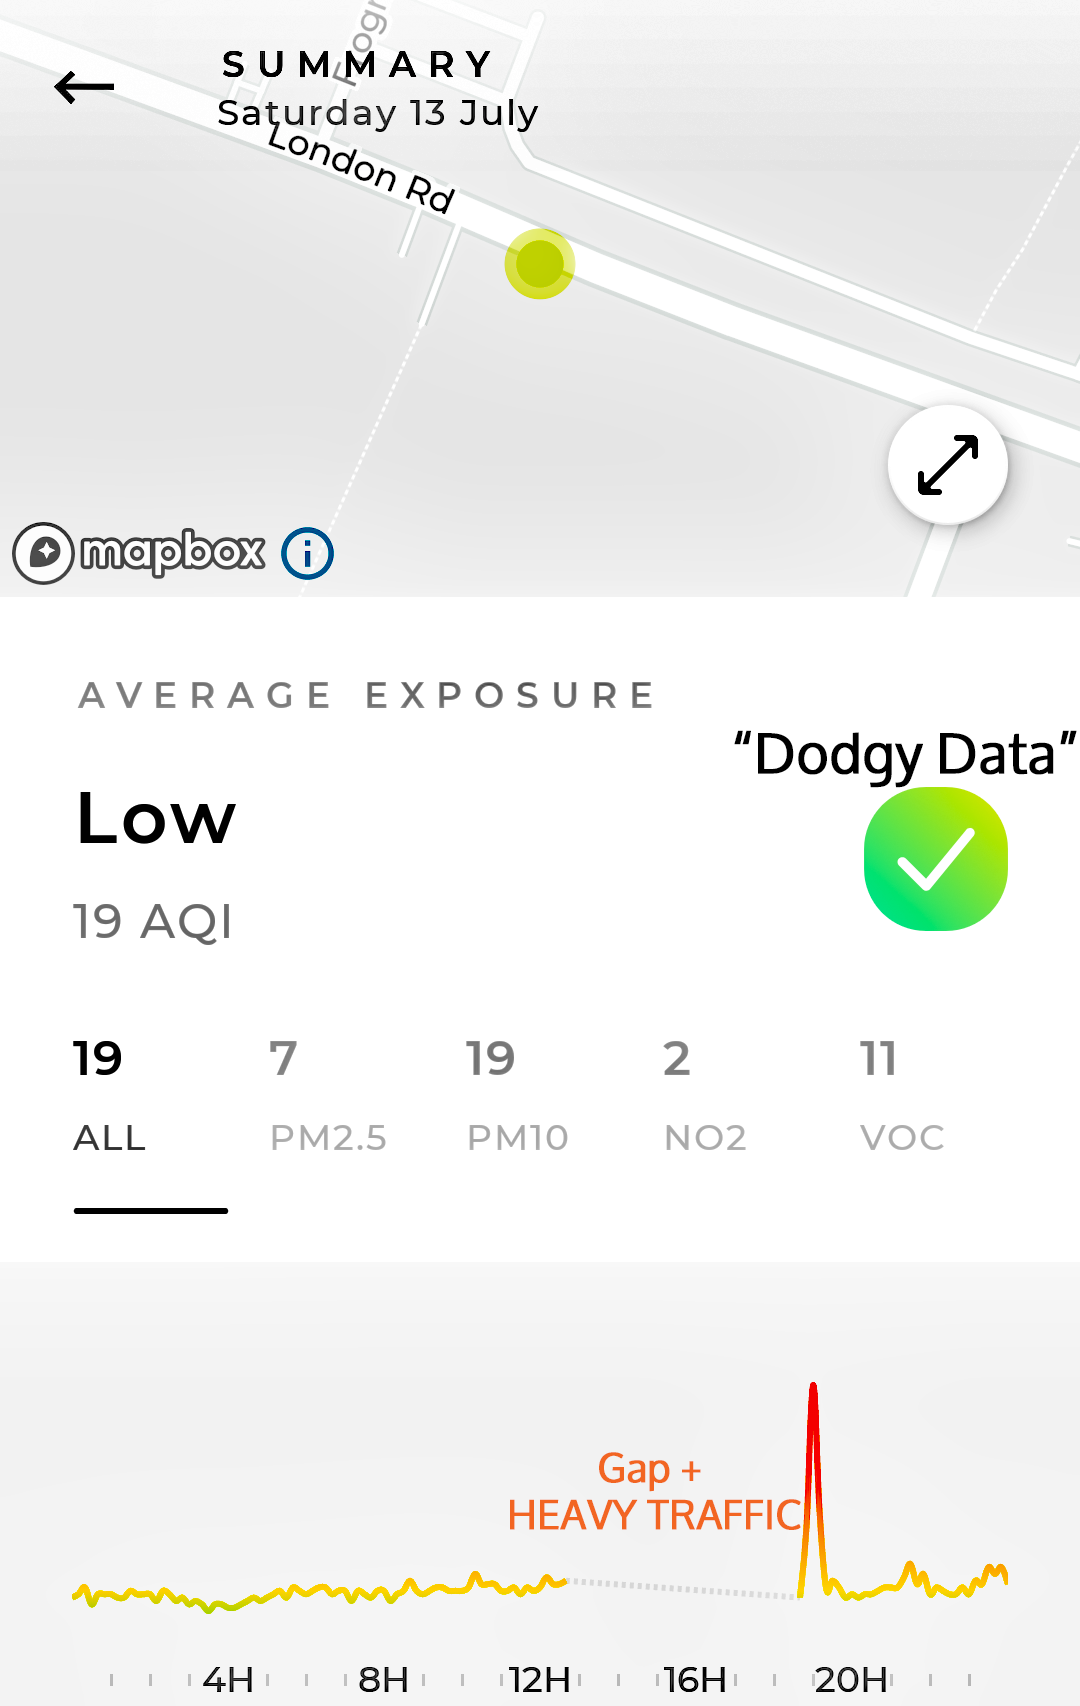
| 13th July Saturday |
7 | 19 | 2 | 11 | LOW Dodgy Data |
Flow 1: Graph: Gap because I forgot to charge the device before going out. Probably under reported pollution as traffic was very heavy during that period. | ||
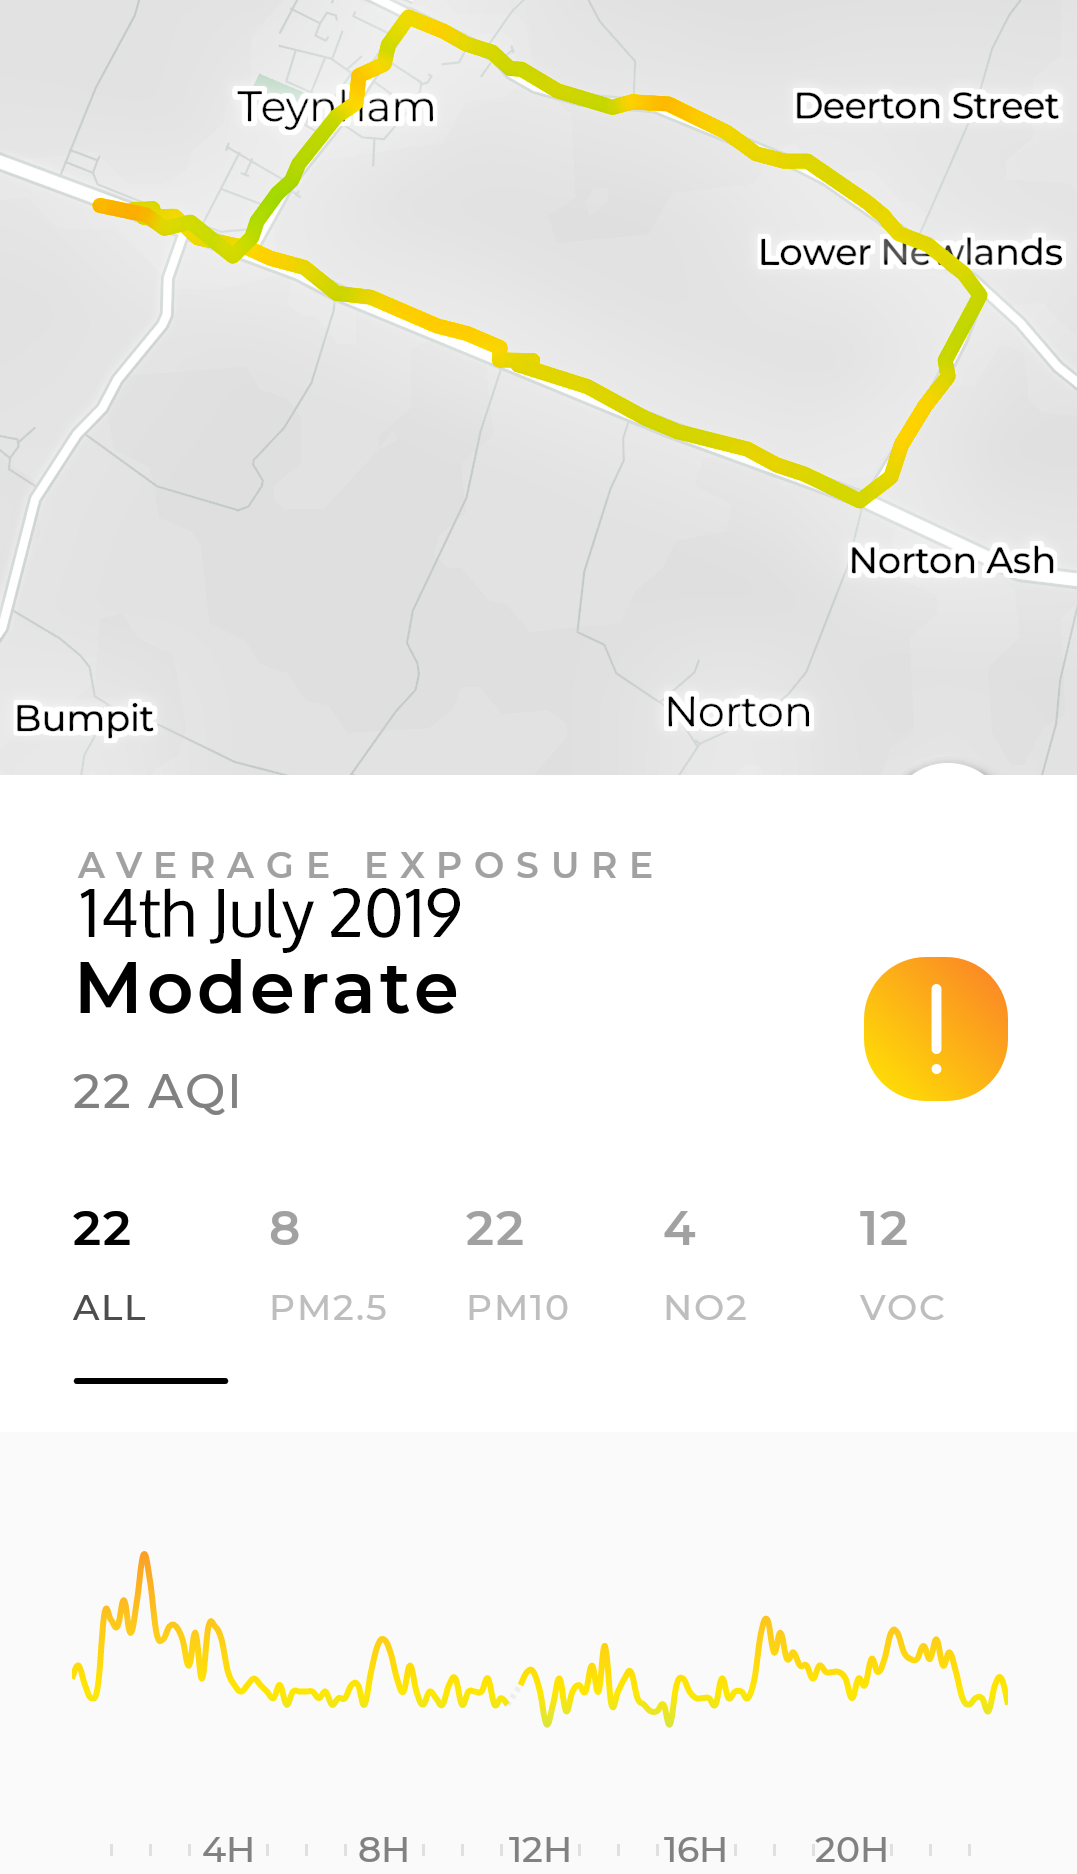
| 14th July | 8 | 22 | 4 | 12 | MODERATE | Flow 1: Graph & Map (LOW) | ||
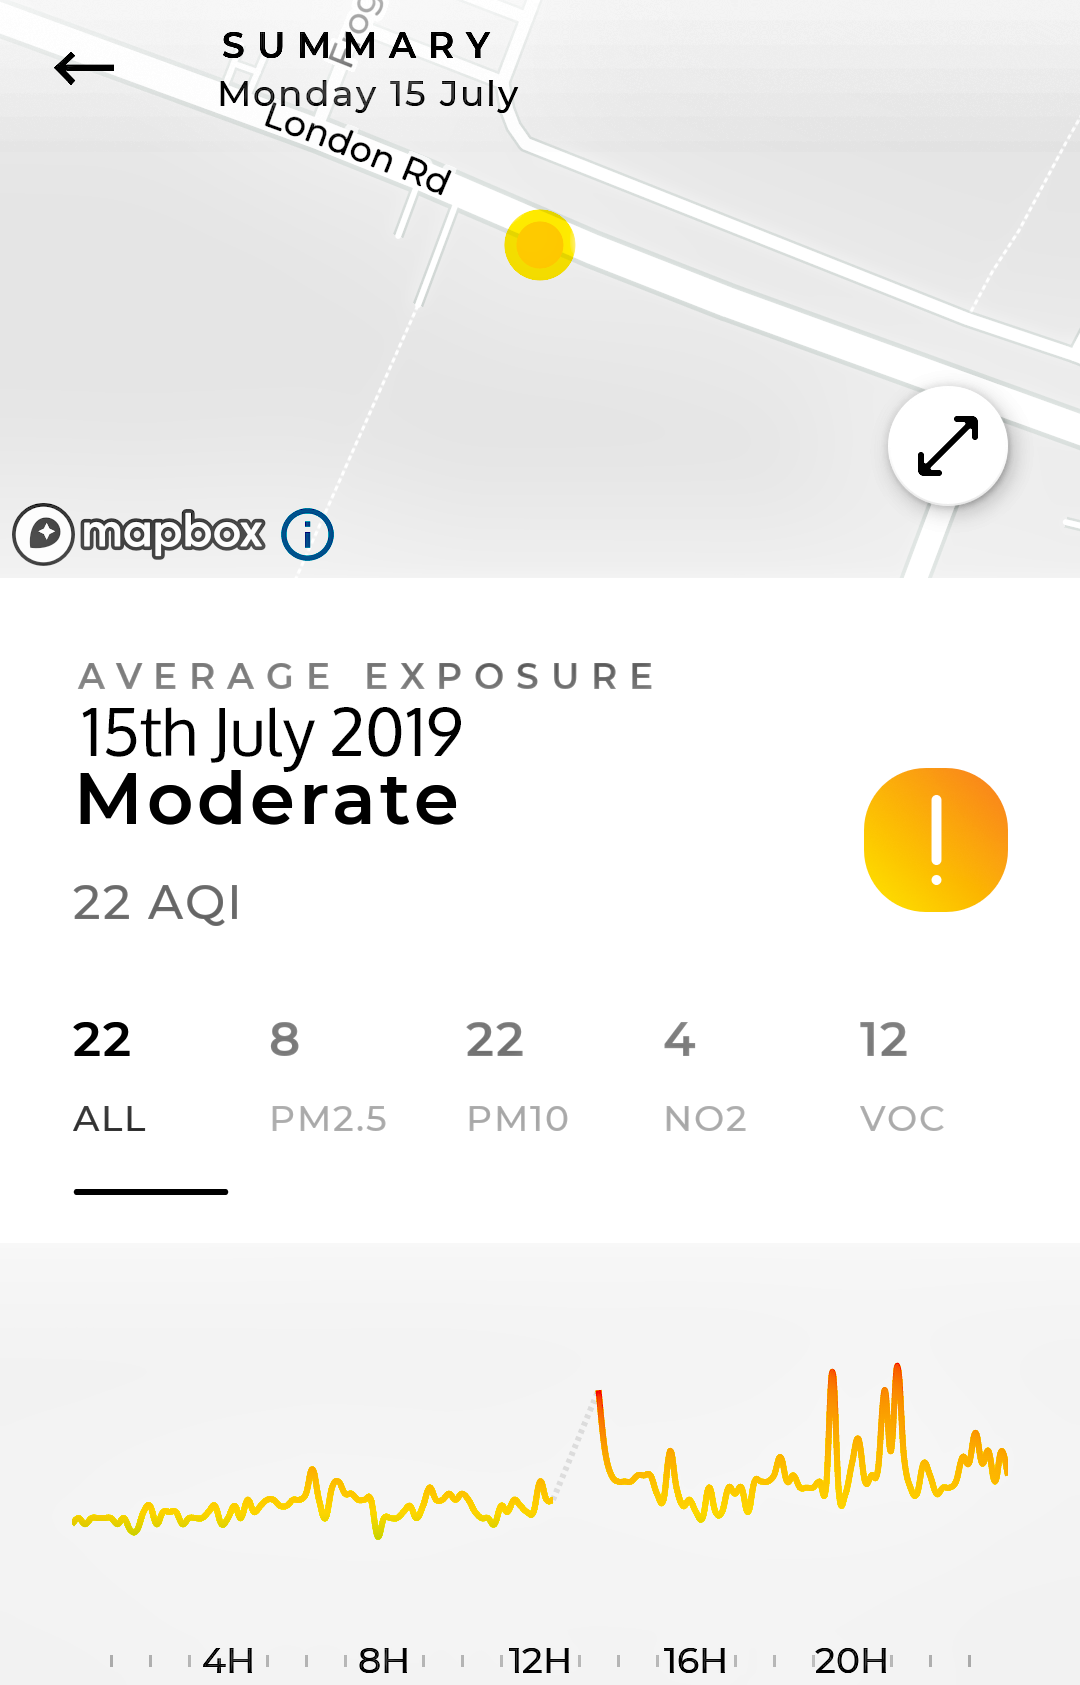
| 15th July | 8 | 22 | 4 | 12 | MODERATE | Flow 1: Graph: | ||
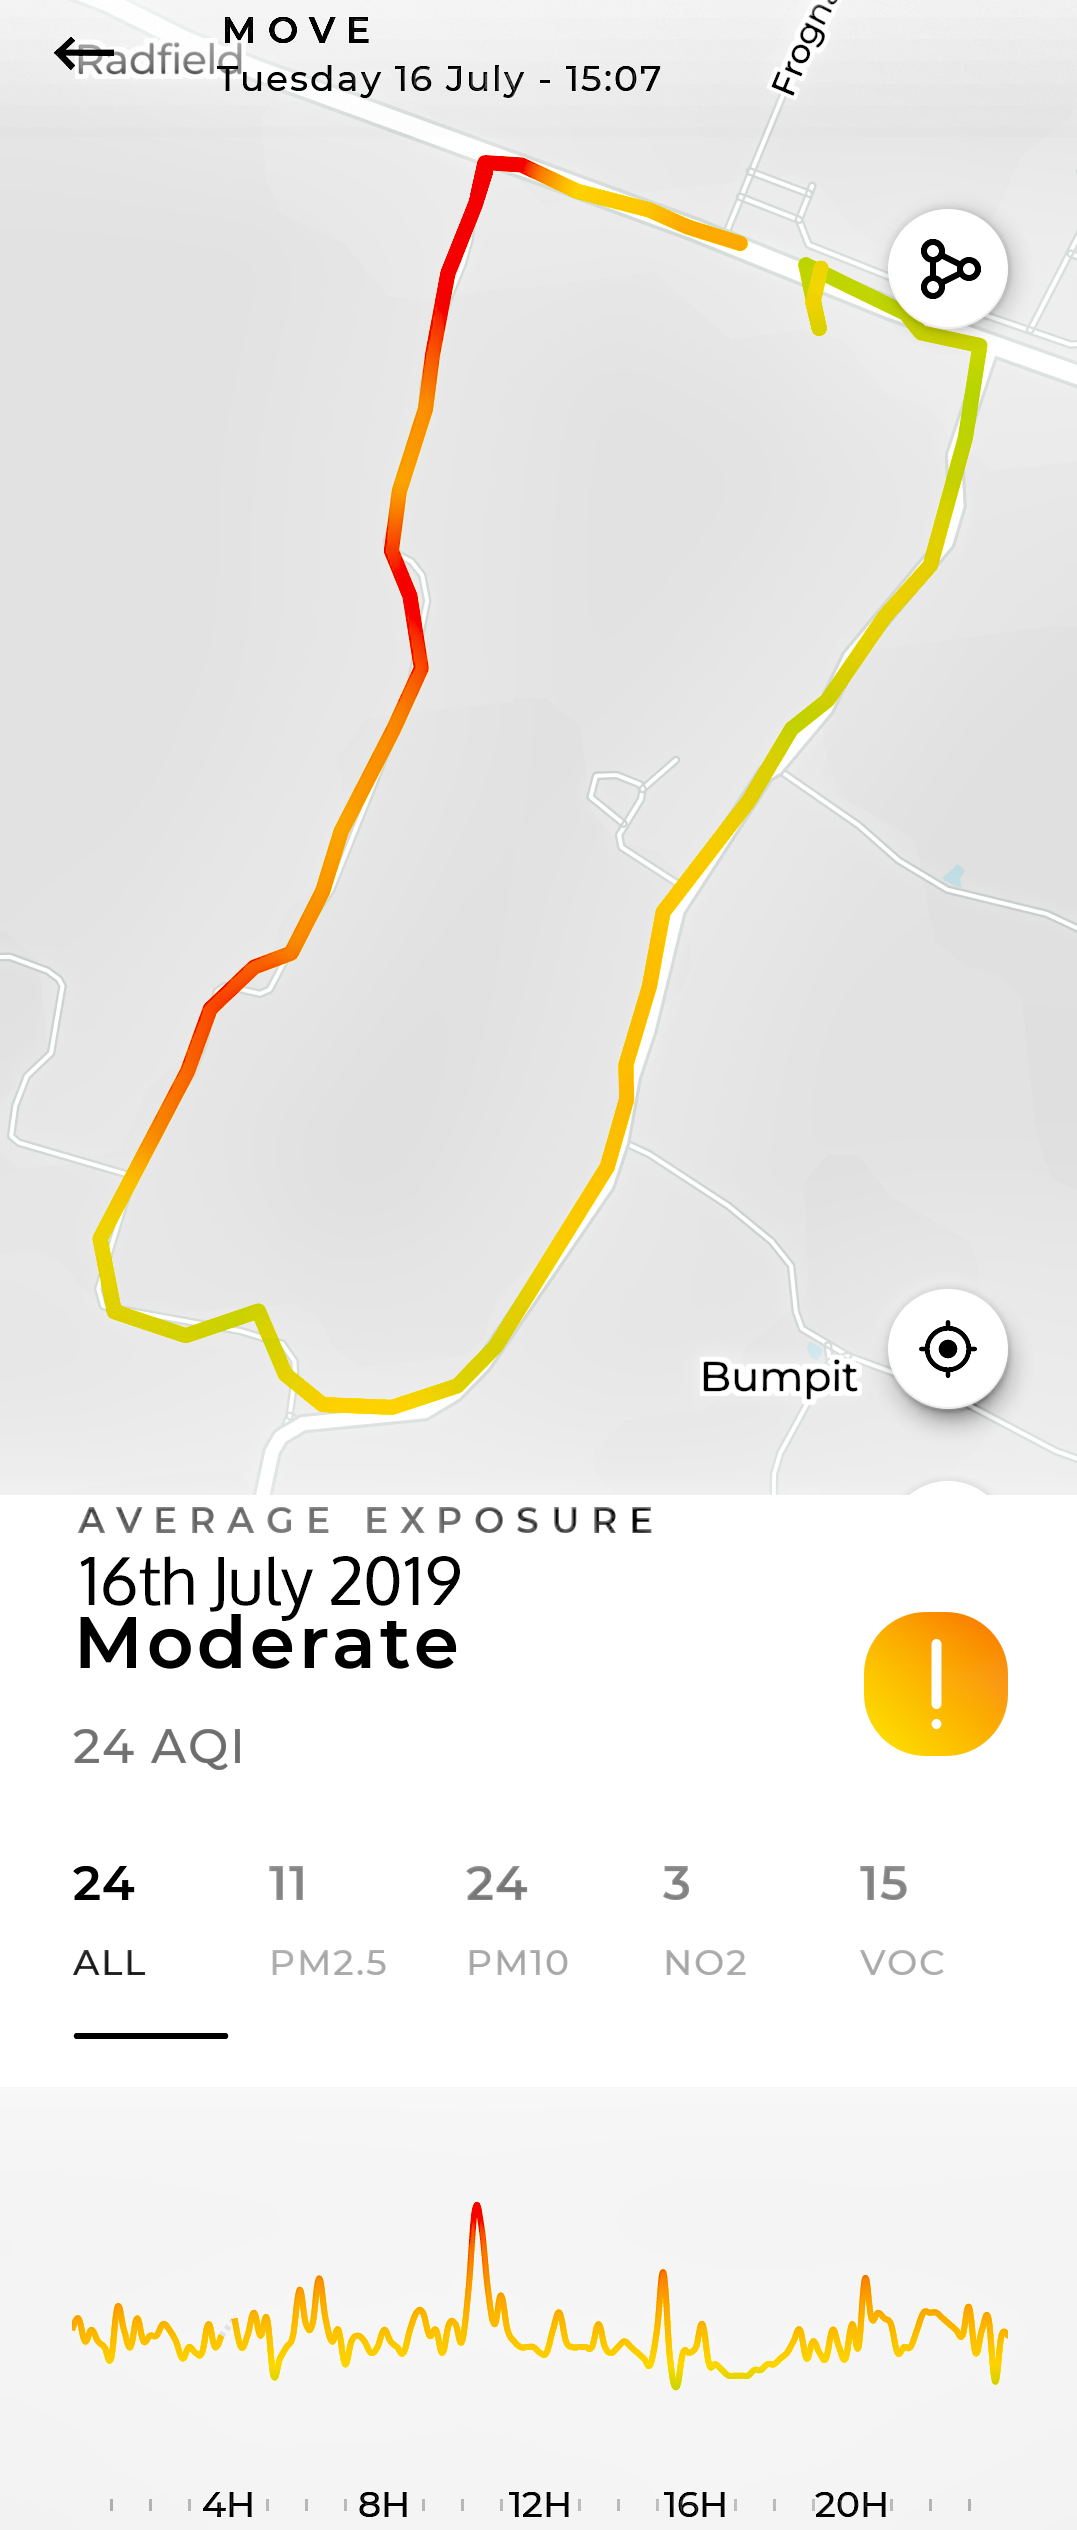
| 16th July | 11 | 24 | 3 | 15 | MODERATE | Flow 1: Graph & Map (Higher down Claxfield Lane) | ||
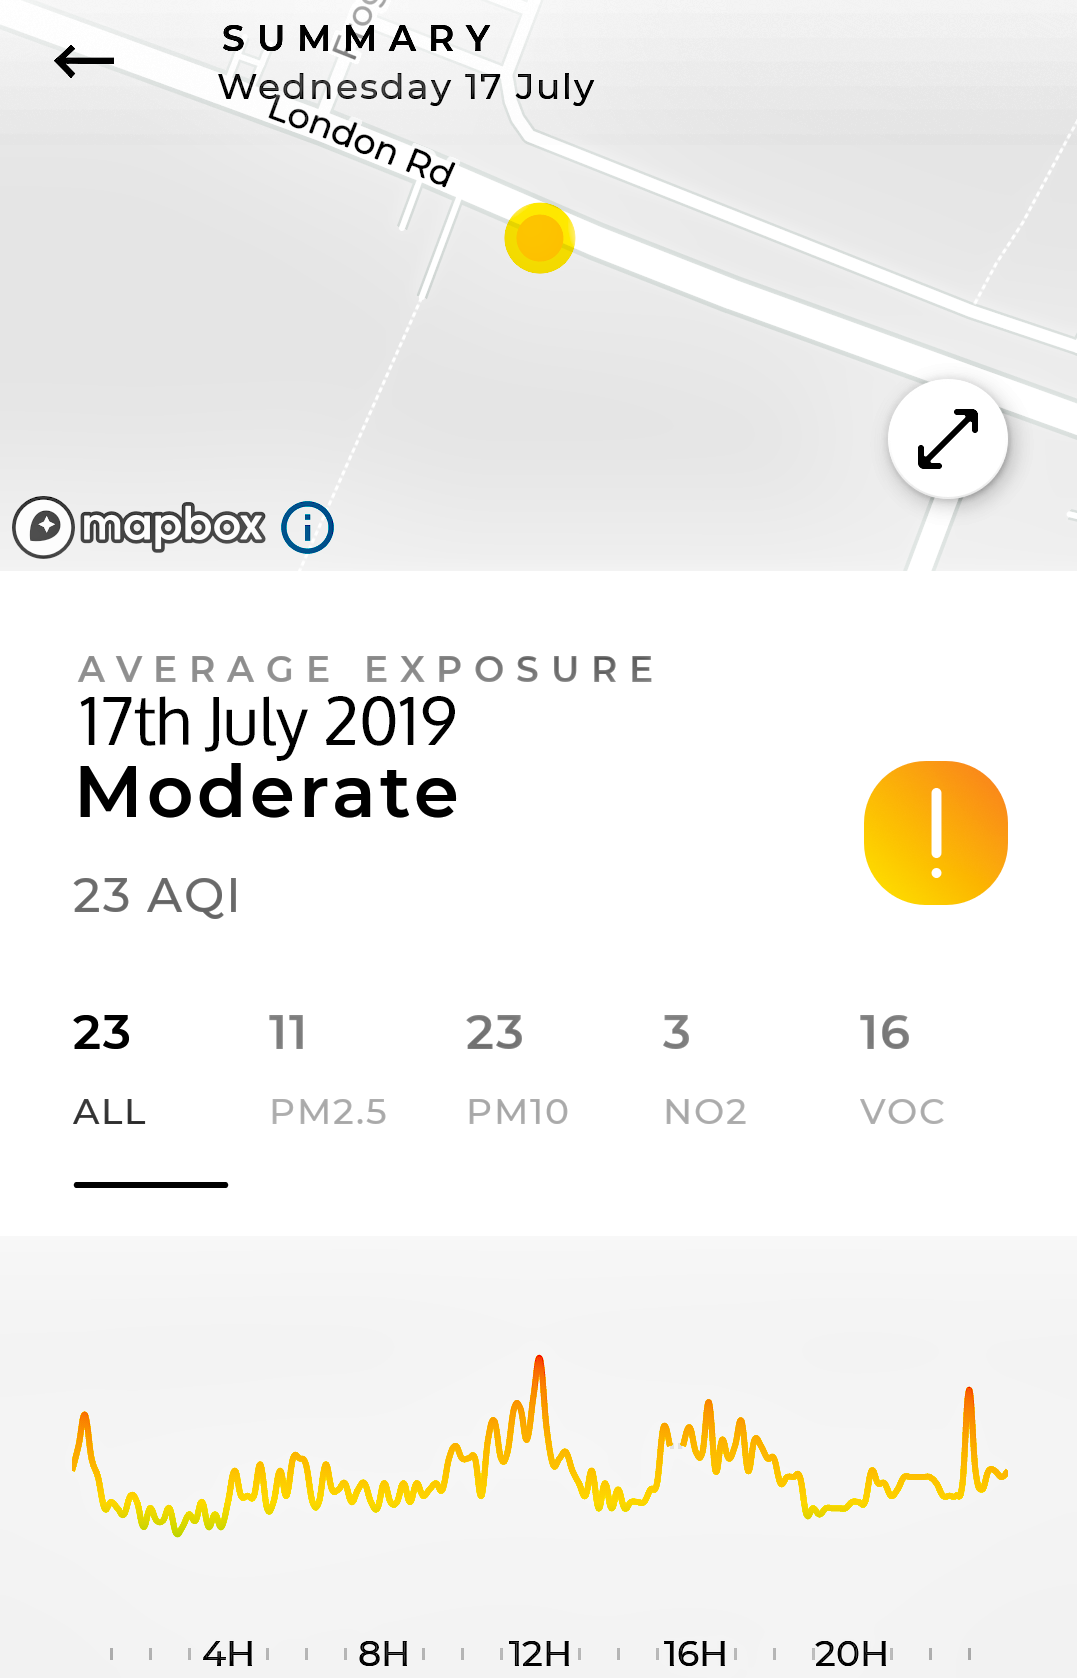
| 17th July | 11 | 23 | 3 | 16 | MODERATE | Flow 1: Graph: Busy traffic all day. | ||
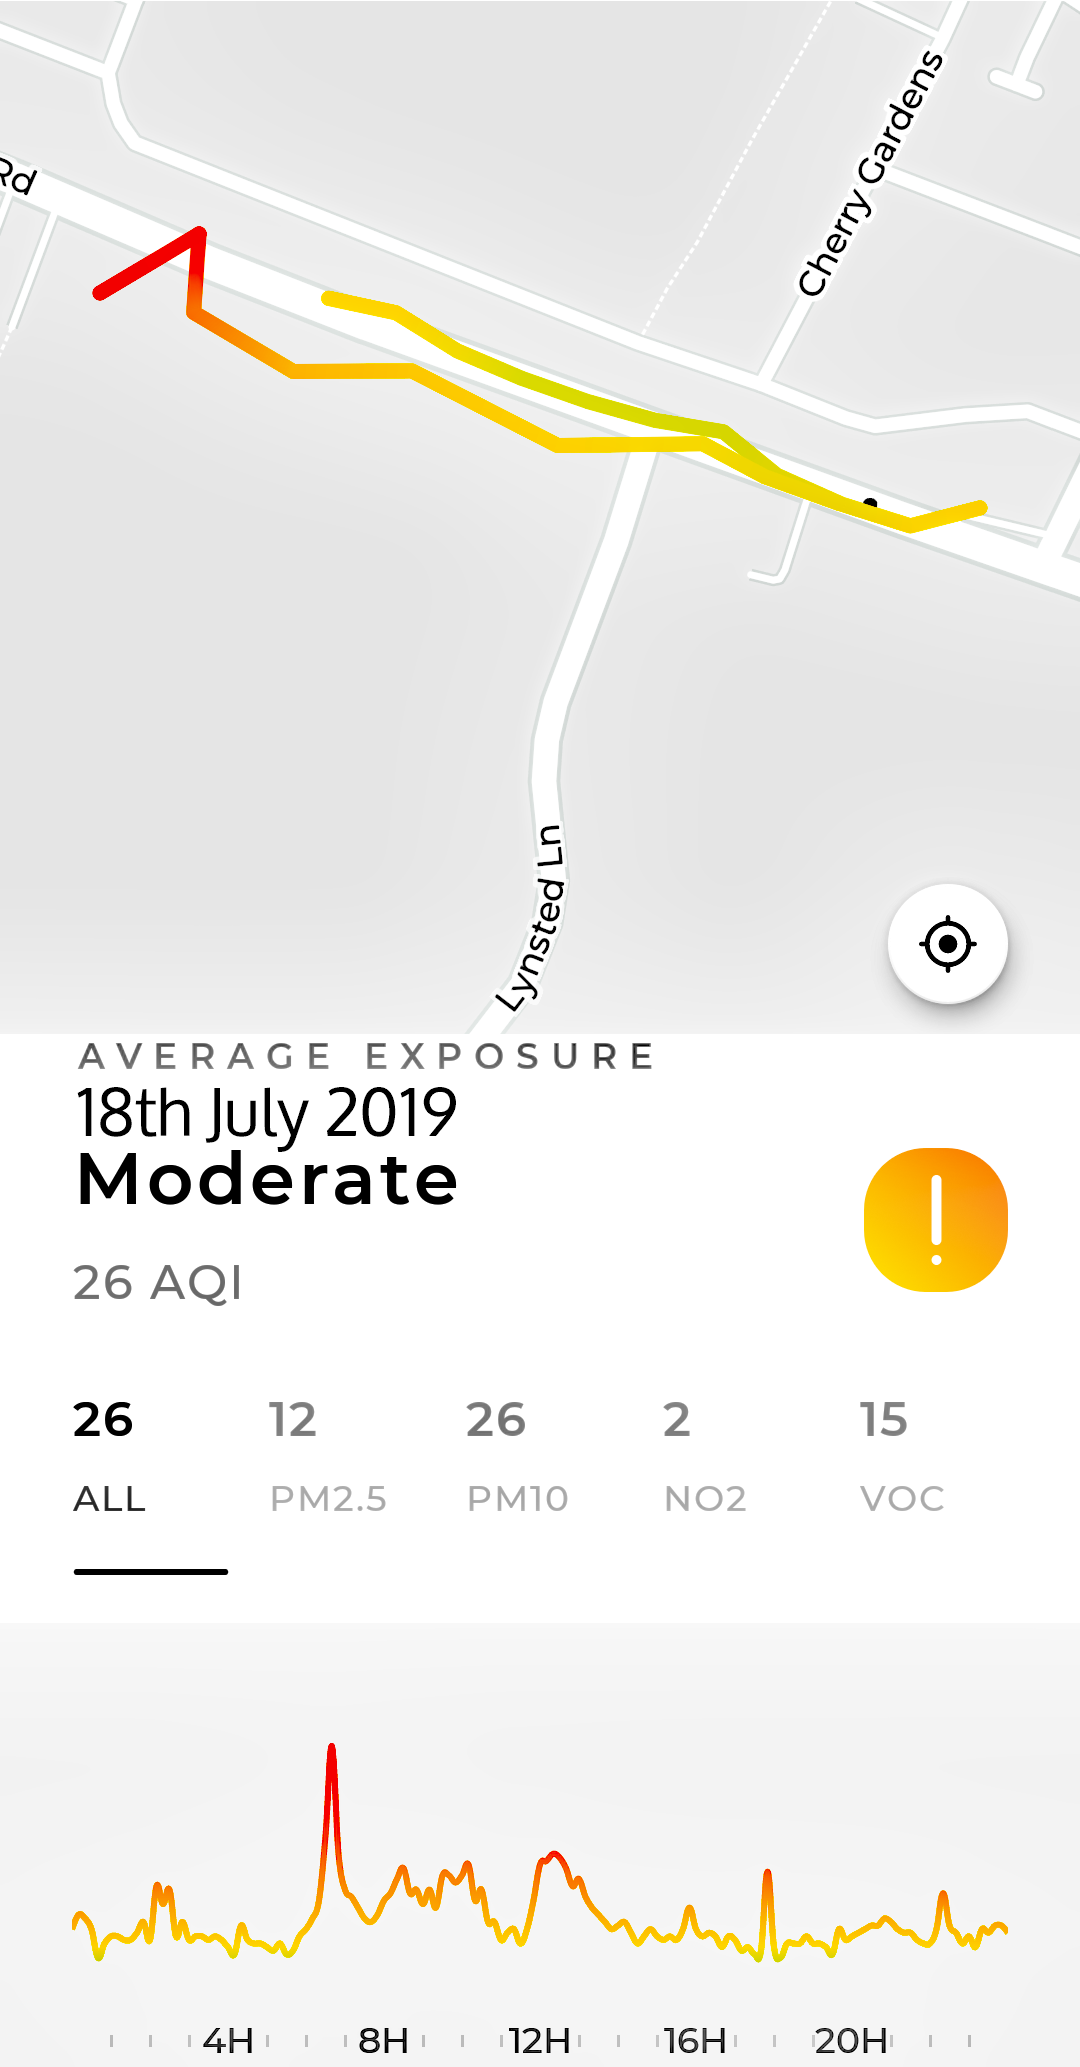
| 18th July | 12 | 26 | 2 | 15 | MODERATE | Flow 1: Graph & Map (Greenstreet - higher at West end) | ||
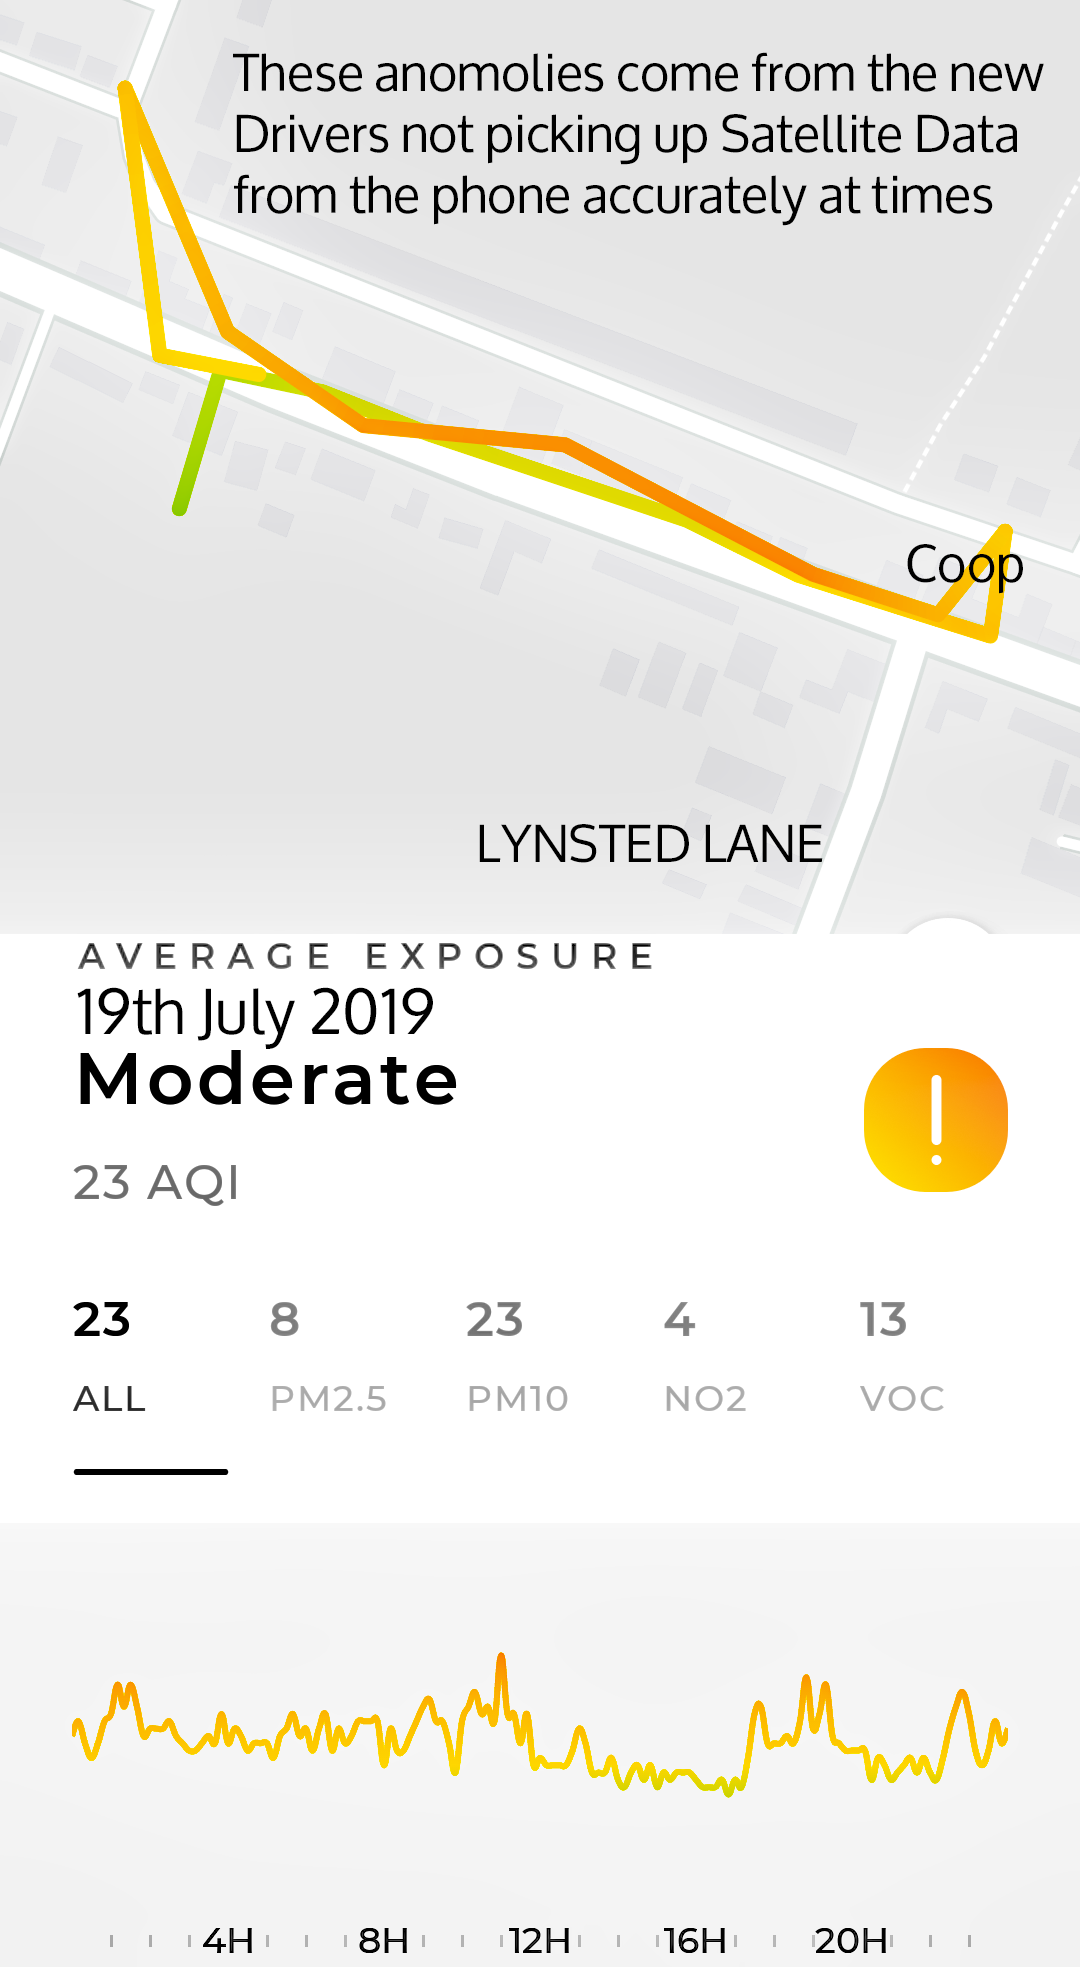
| 19th July | 8 | 23 | 4 | 13 | MODERATE | Flow 1: Graph & Map (Greenstreet - slightly higher at East end, Coop) | ||
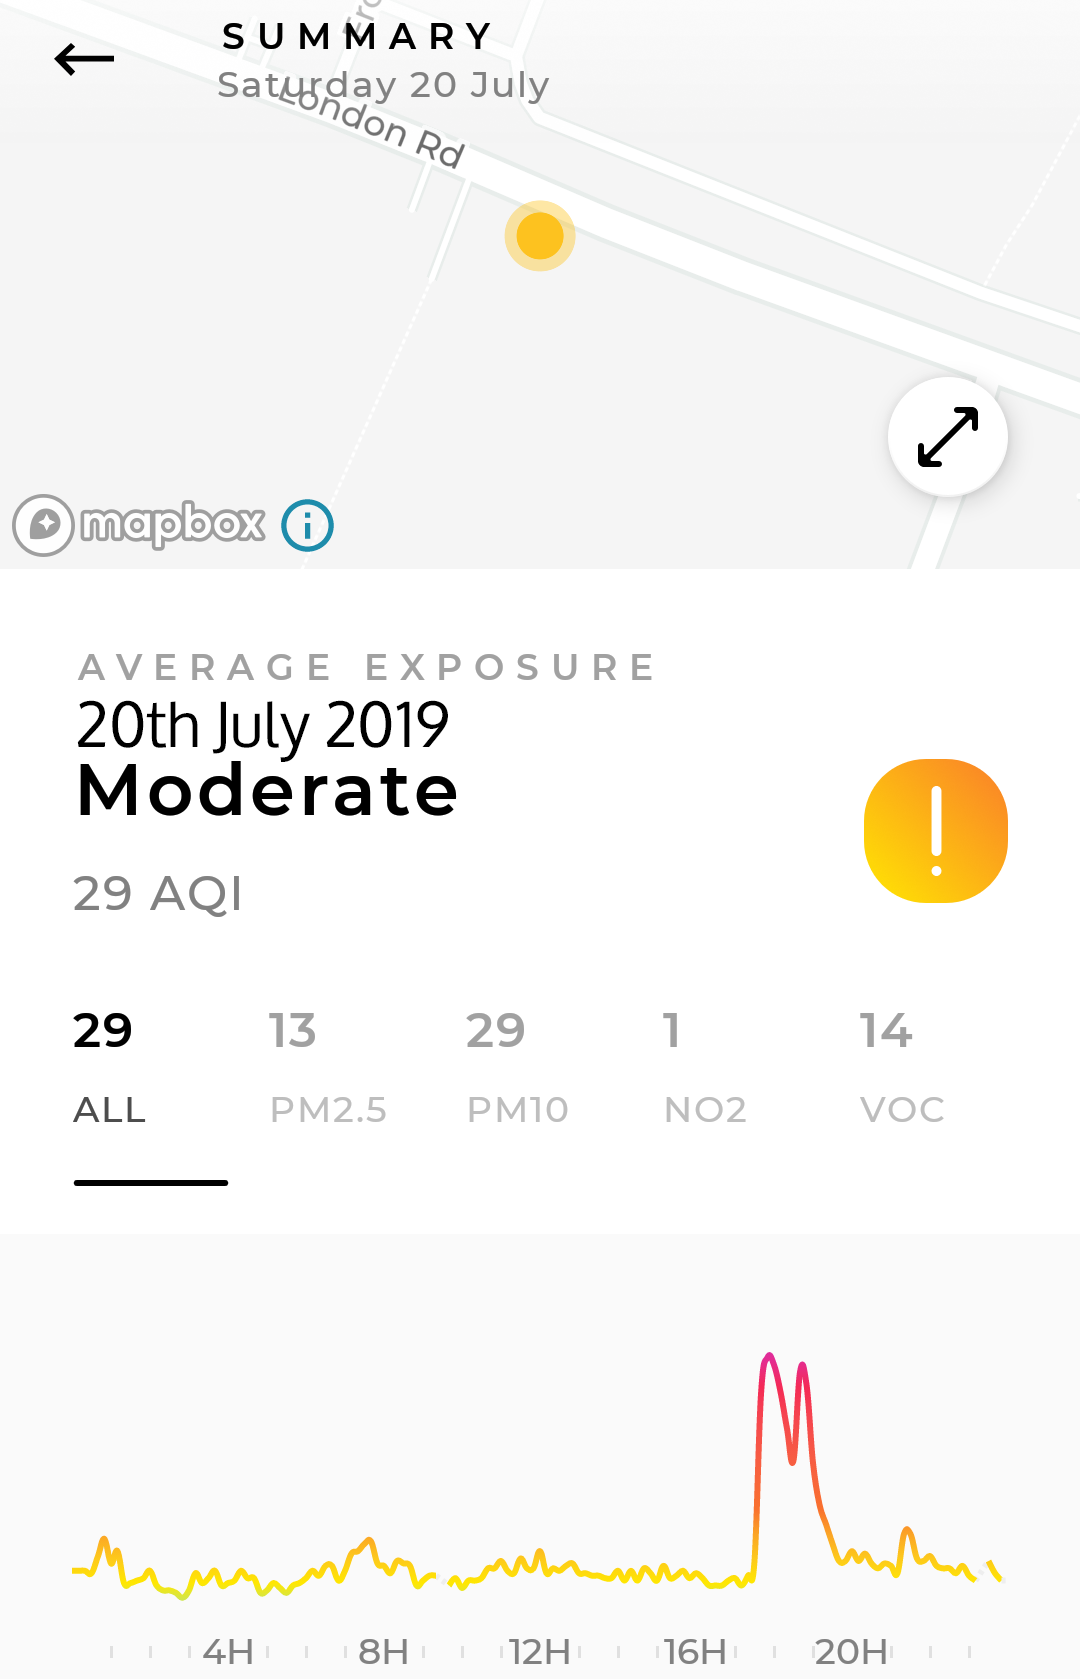
| 20th July | 13 | 29 | 1 | 14 | MODERATE | Flow 1: Graph: Saturday road issues. | ||
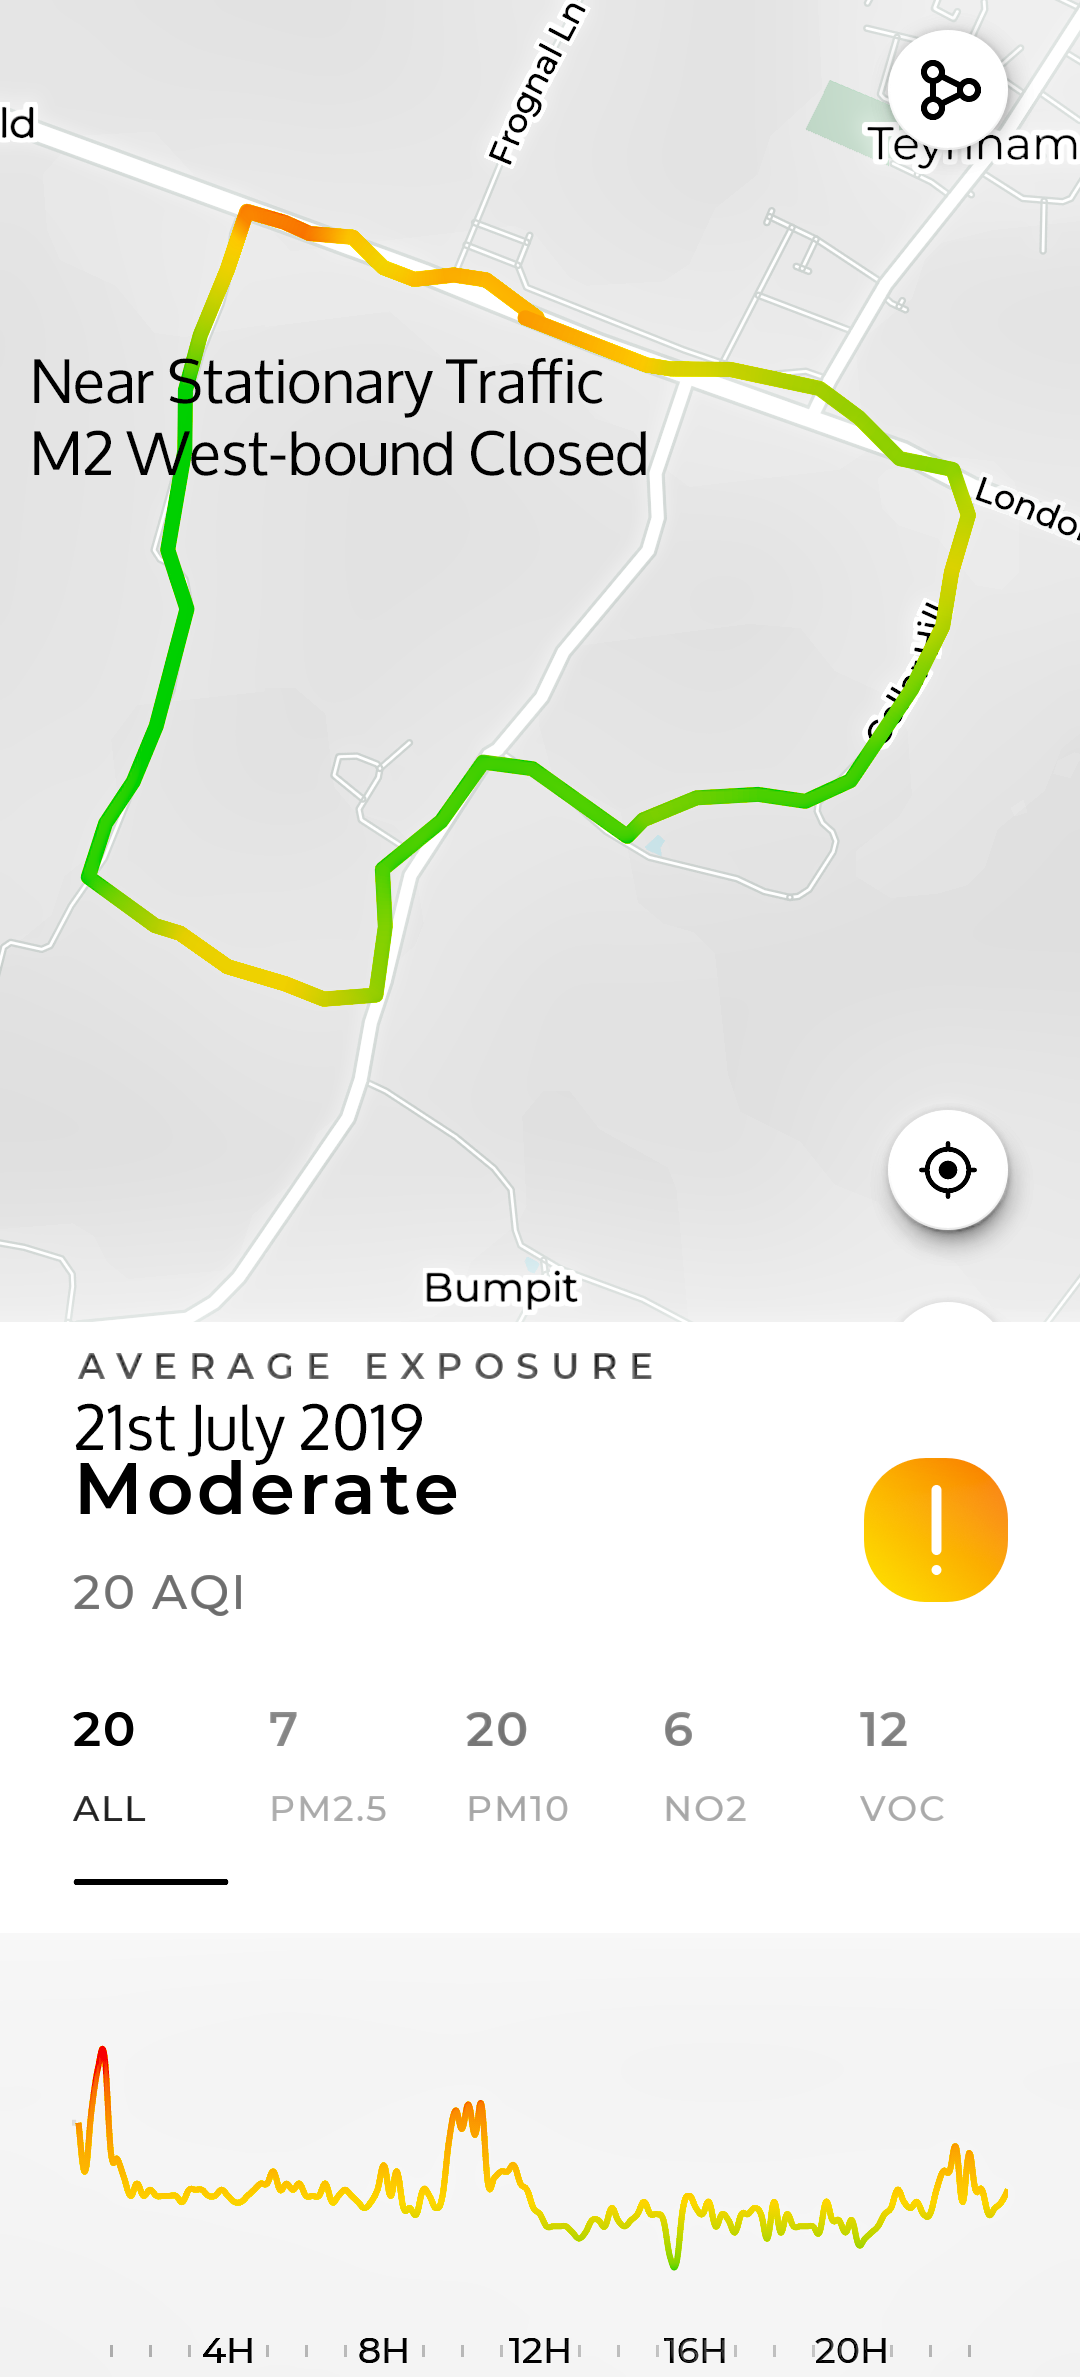
| 21st July Flow 1 Flow 2 |
7 | 20 | 6 | 12 | MODERATE | Flow 1: Graph & Map (M2 Westbound Shut traffic tailing back from Sittingbourne) | ||
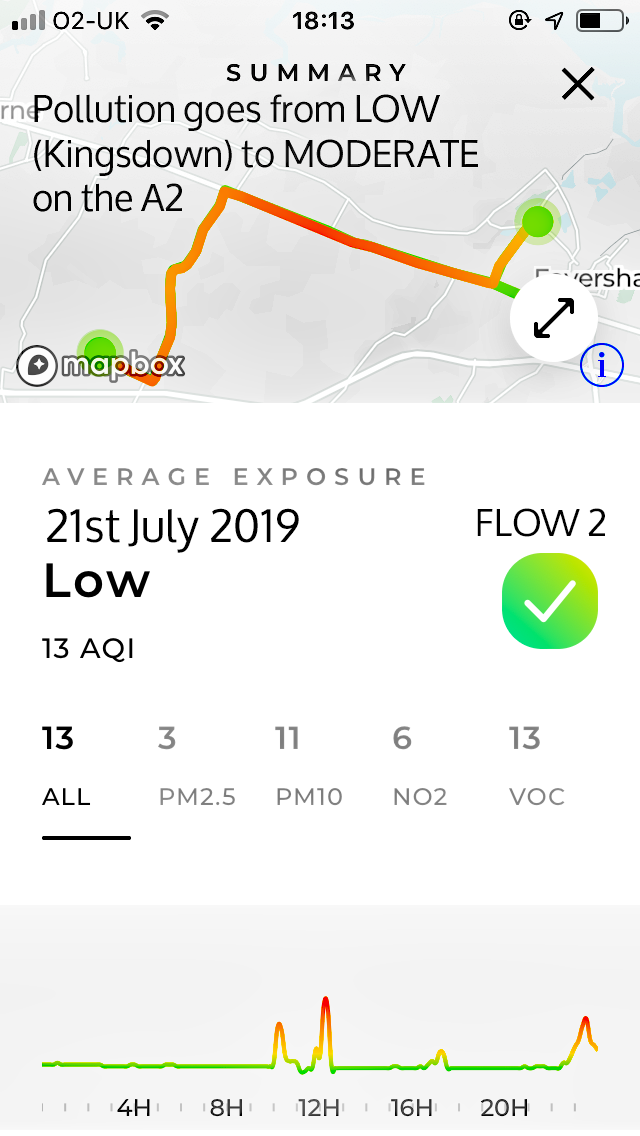
| 3 | 11 | 6 | 13 | LOW | Flow 2: Graph & Map: Coming back on stream | |||
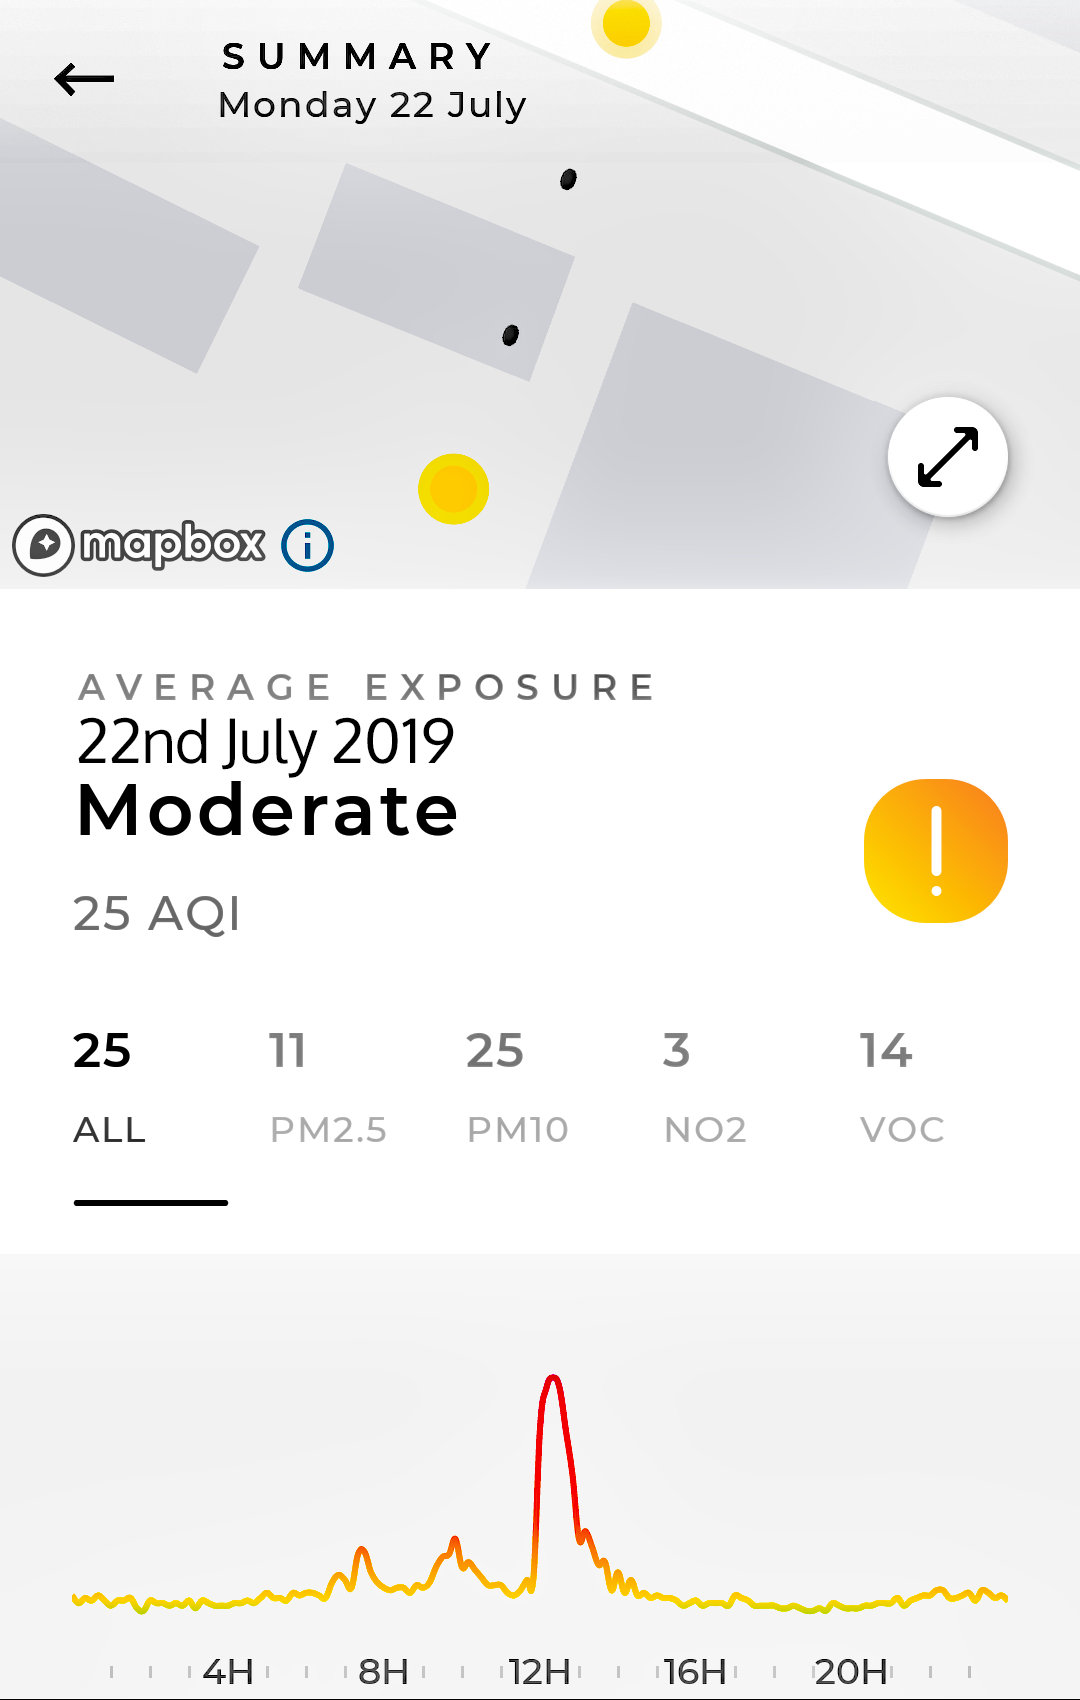
| 22nd July | 11 | 25 | 3 | 14 | MODERATE | Flow 1: Graph: Peak of Very High at midday | ||
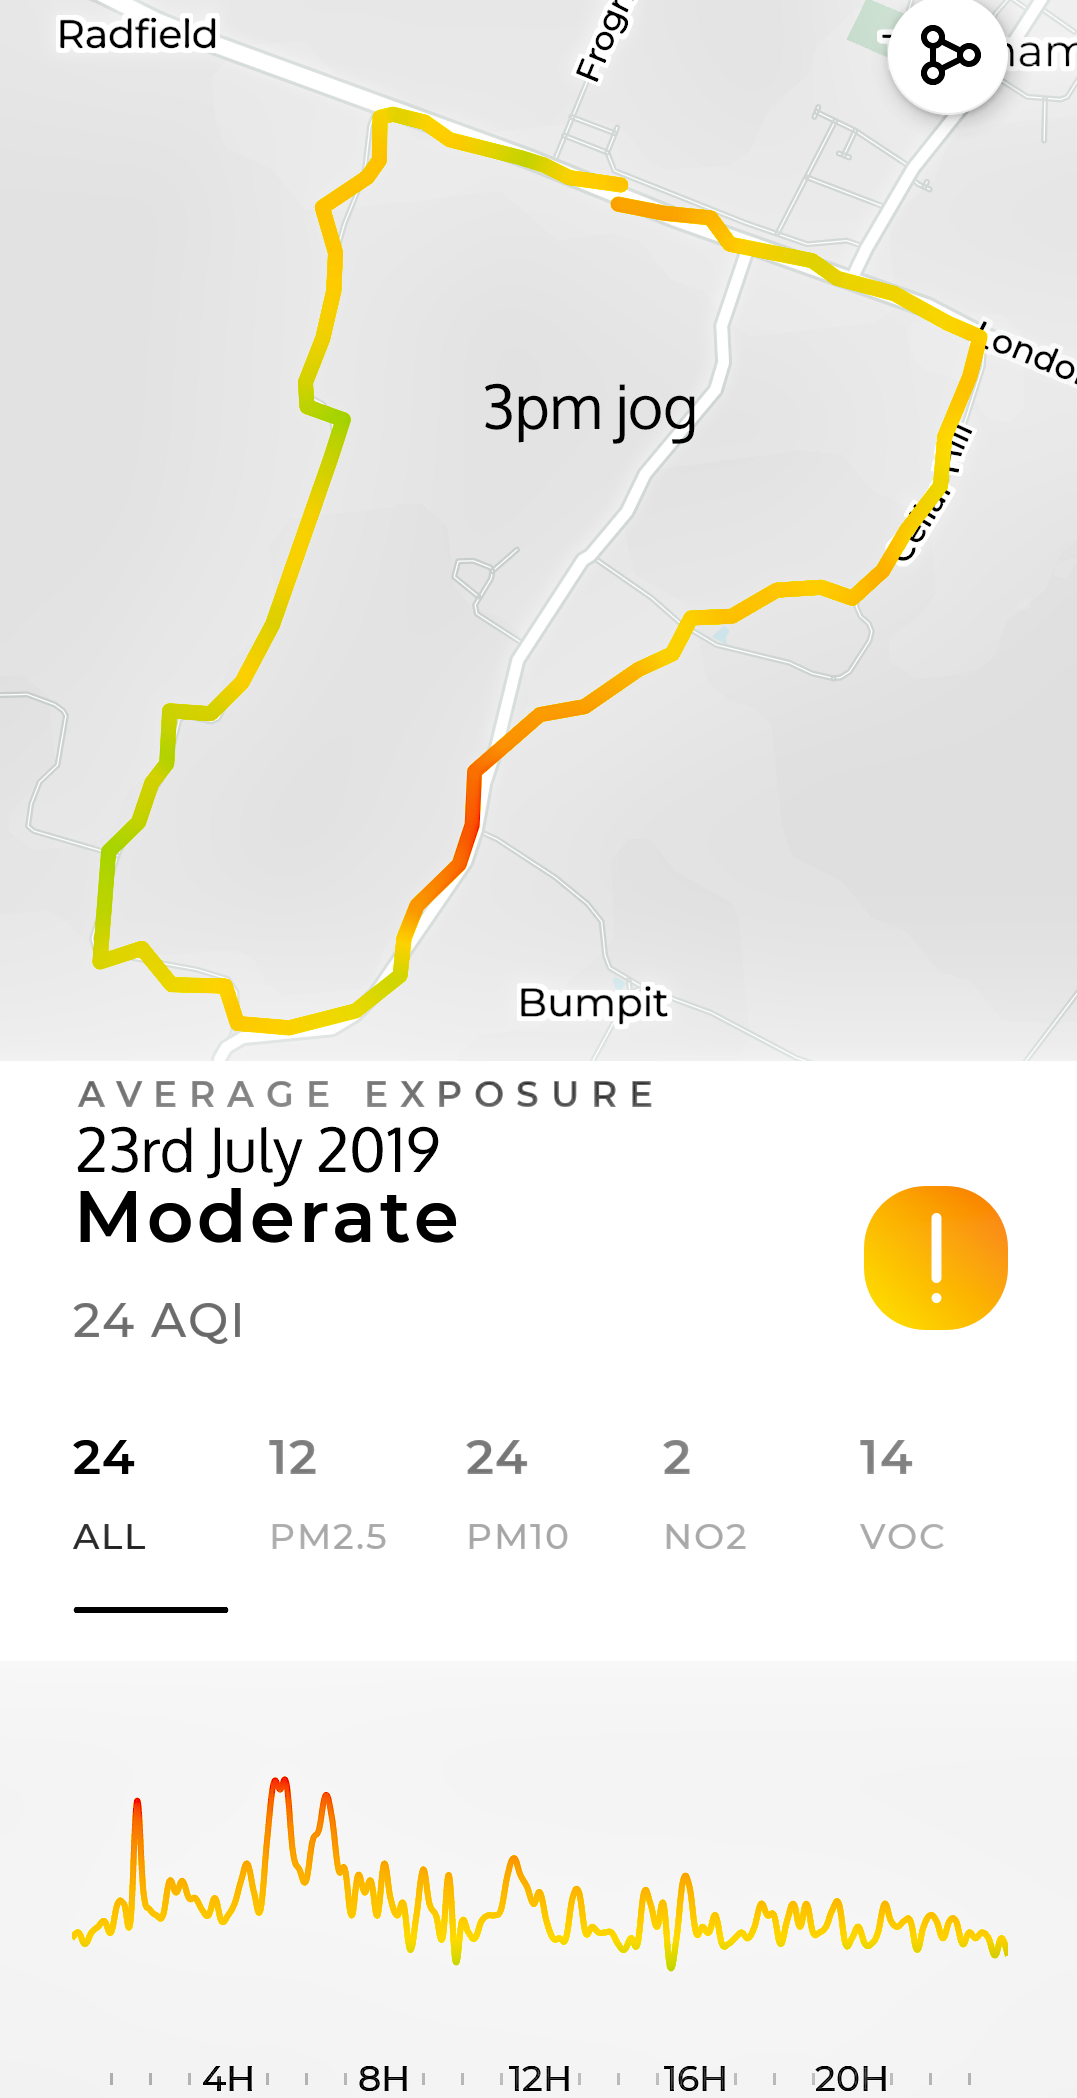
| 23rd July | 12 | 24 | 2 | 14 | MODERATE | Flow 1: Graph & Map: Jog to south of A2. | ||
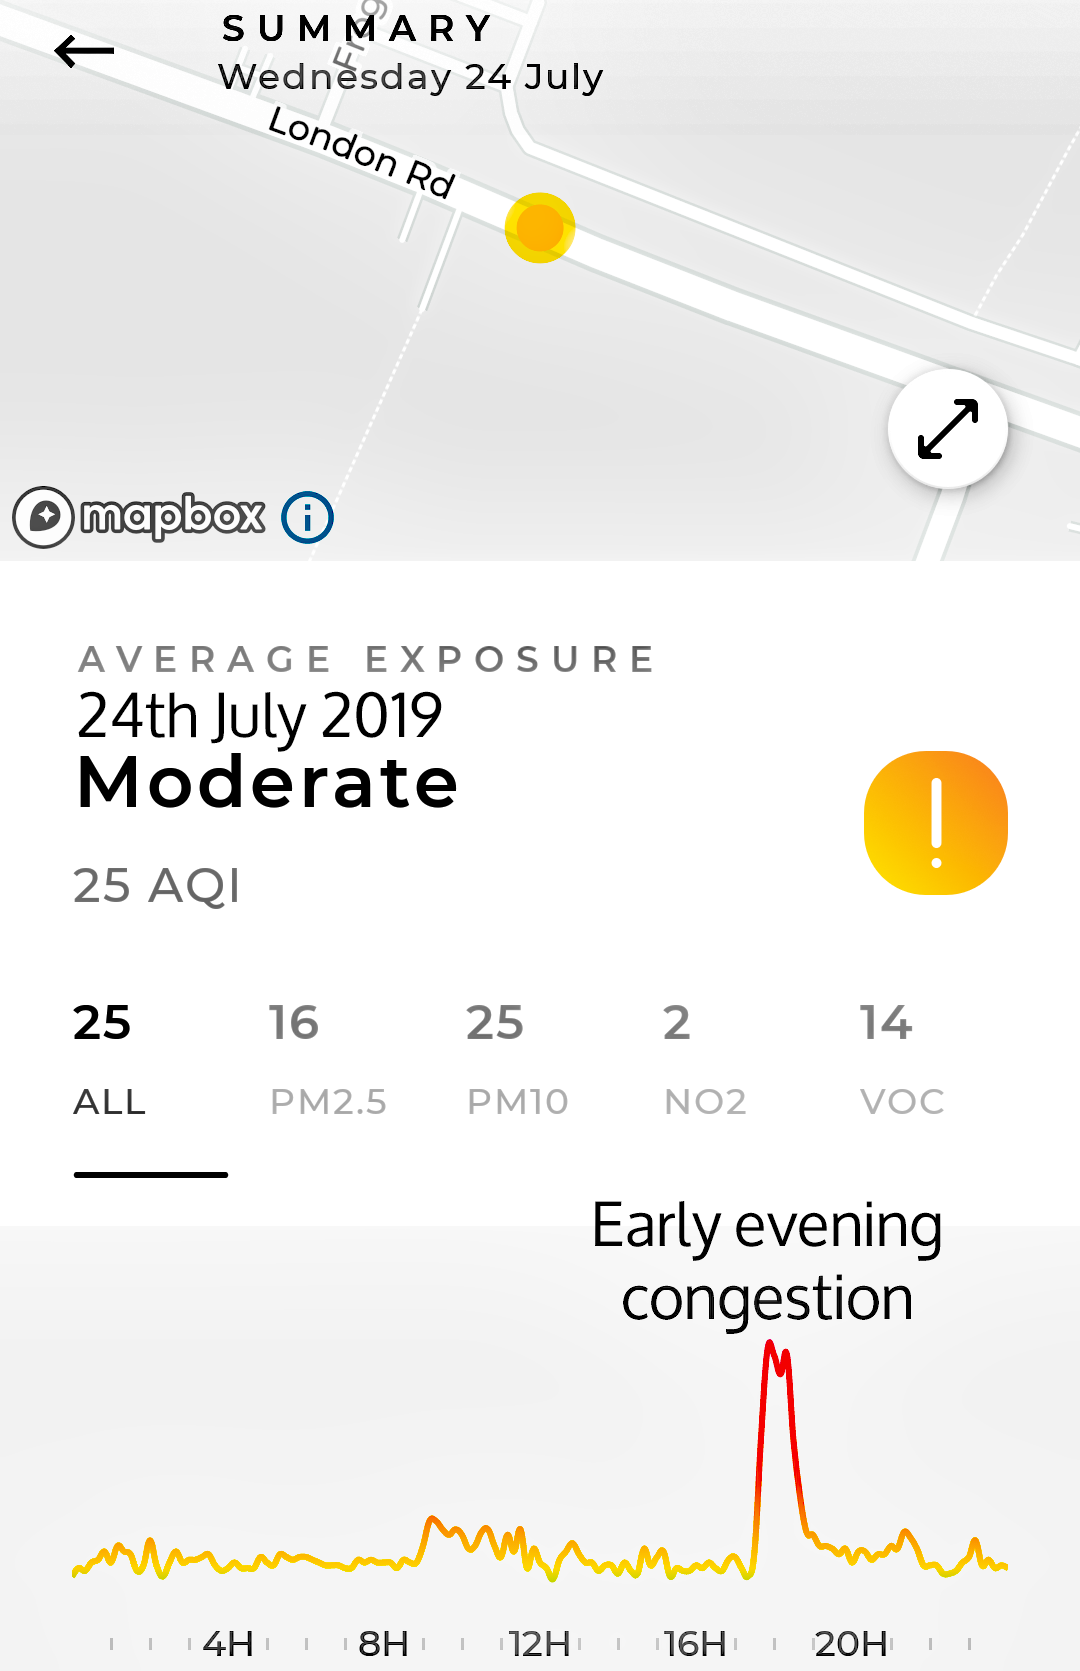
| 24th July | 16 | 25 | 2 | 14 | MODERATE | Flow 1: Graph: High Peak in early evening | ||
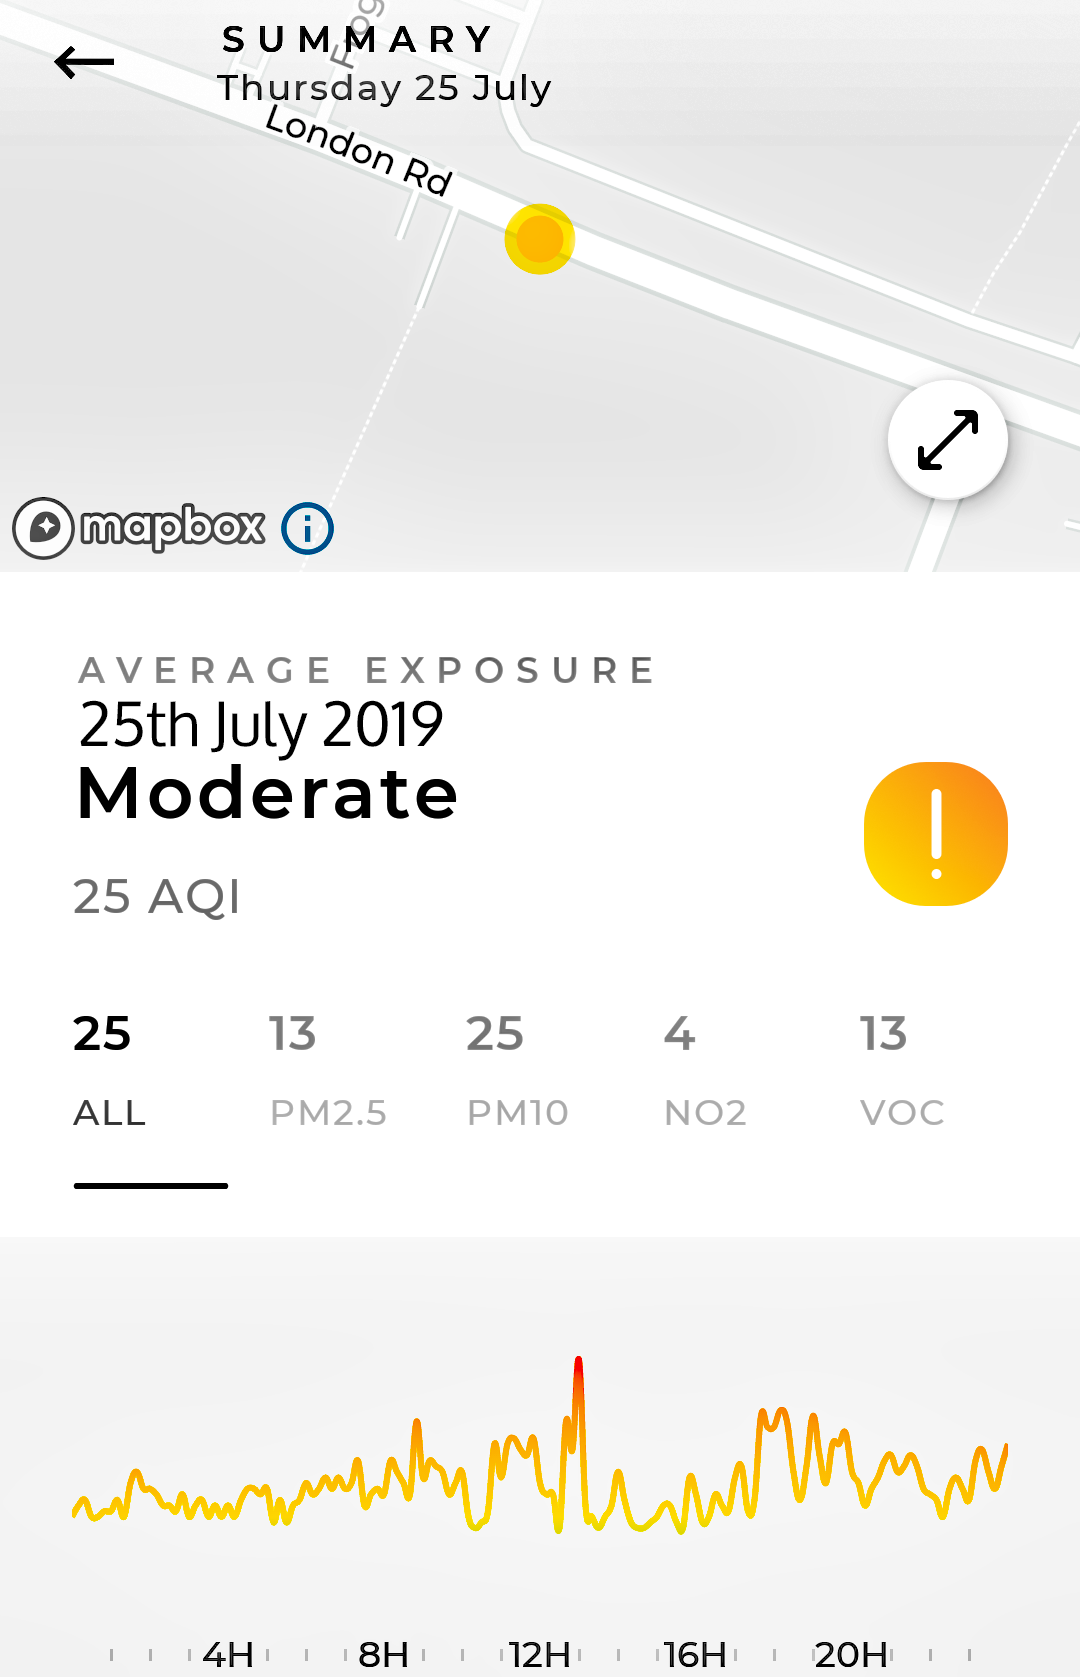
| 25th July | 13 | 25 | 4 | 13 | MODERATE | Flow 1: Graph: Patchy all day. | ||
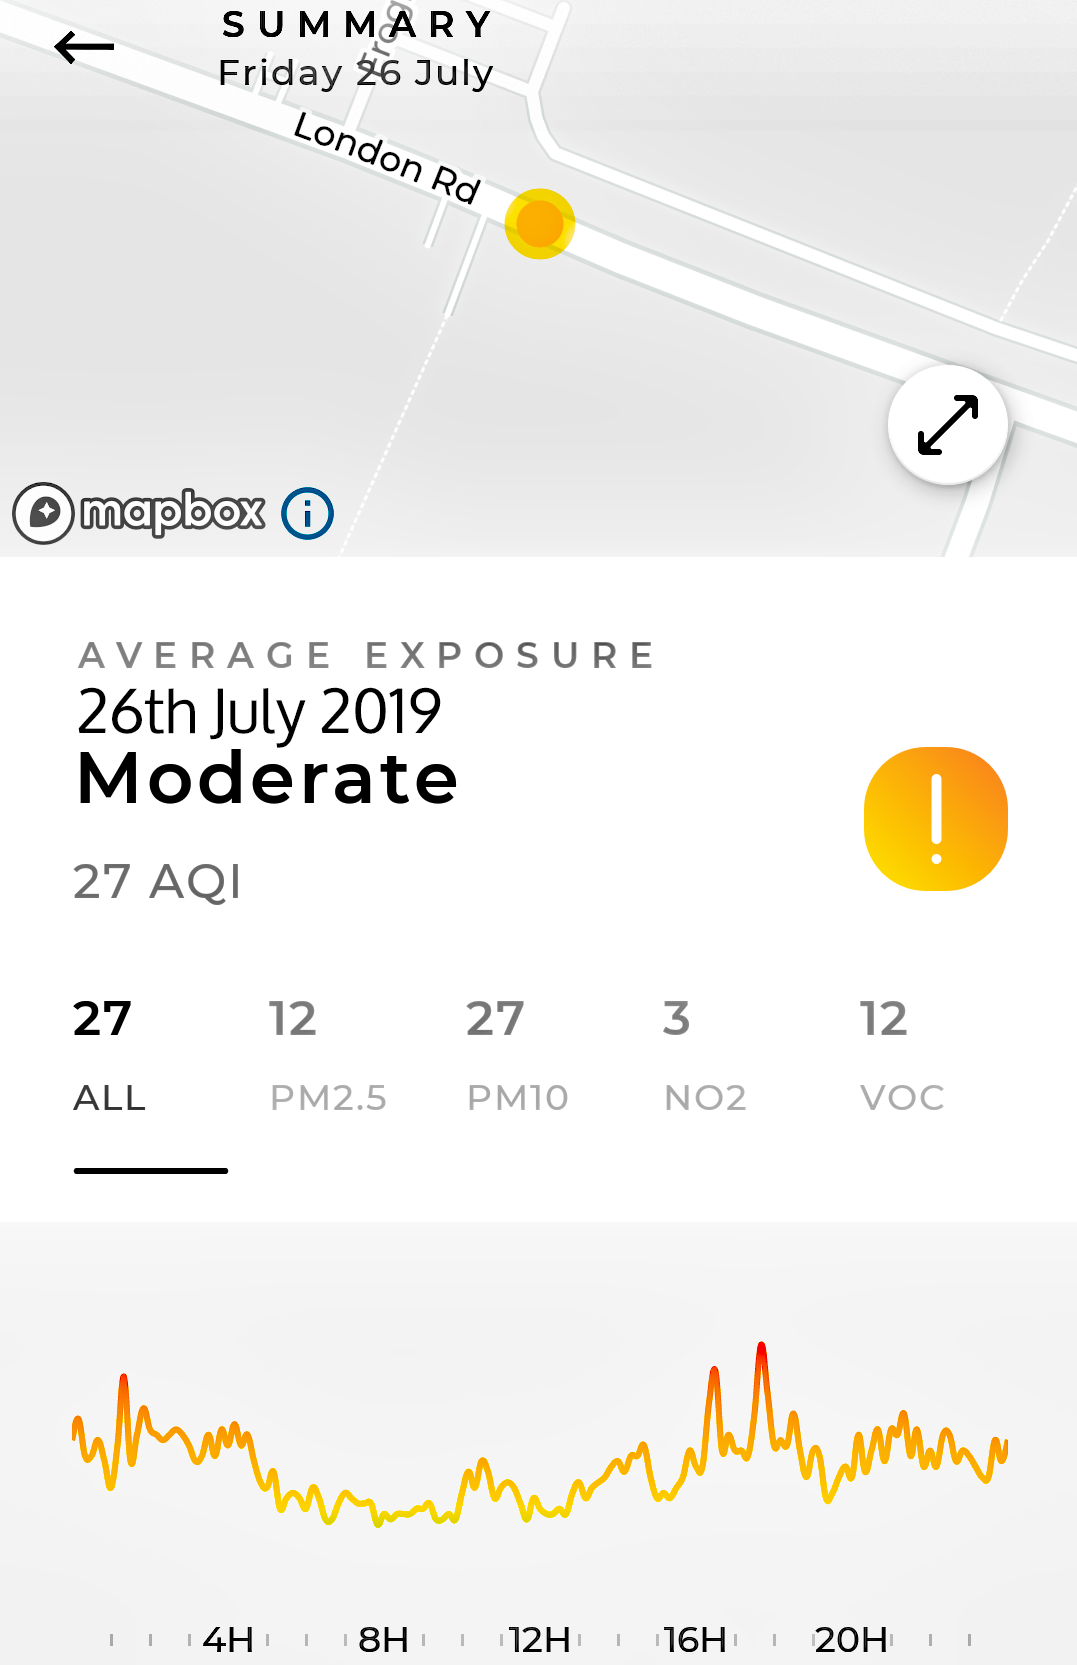
| 26th July | 12 | 27 | 3 | 12 | MODERATE | Flow 1: Graph: Overnight and early evening elevated readings. | ||
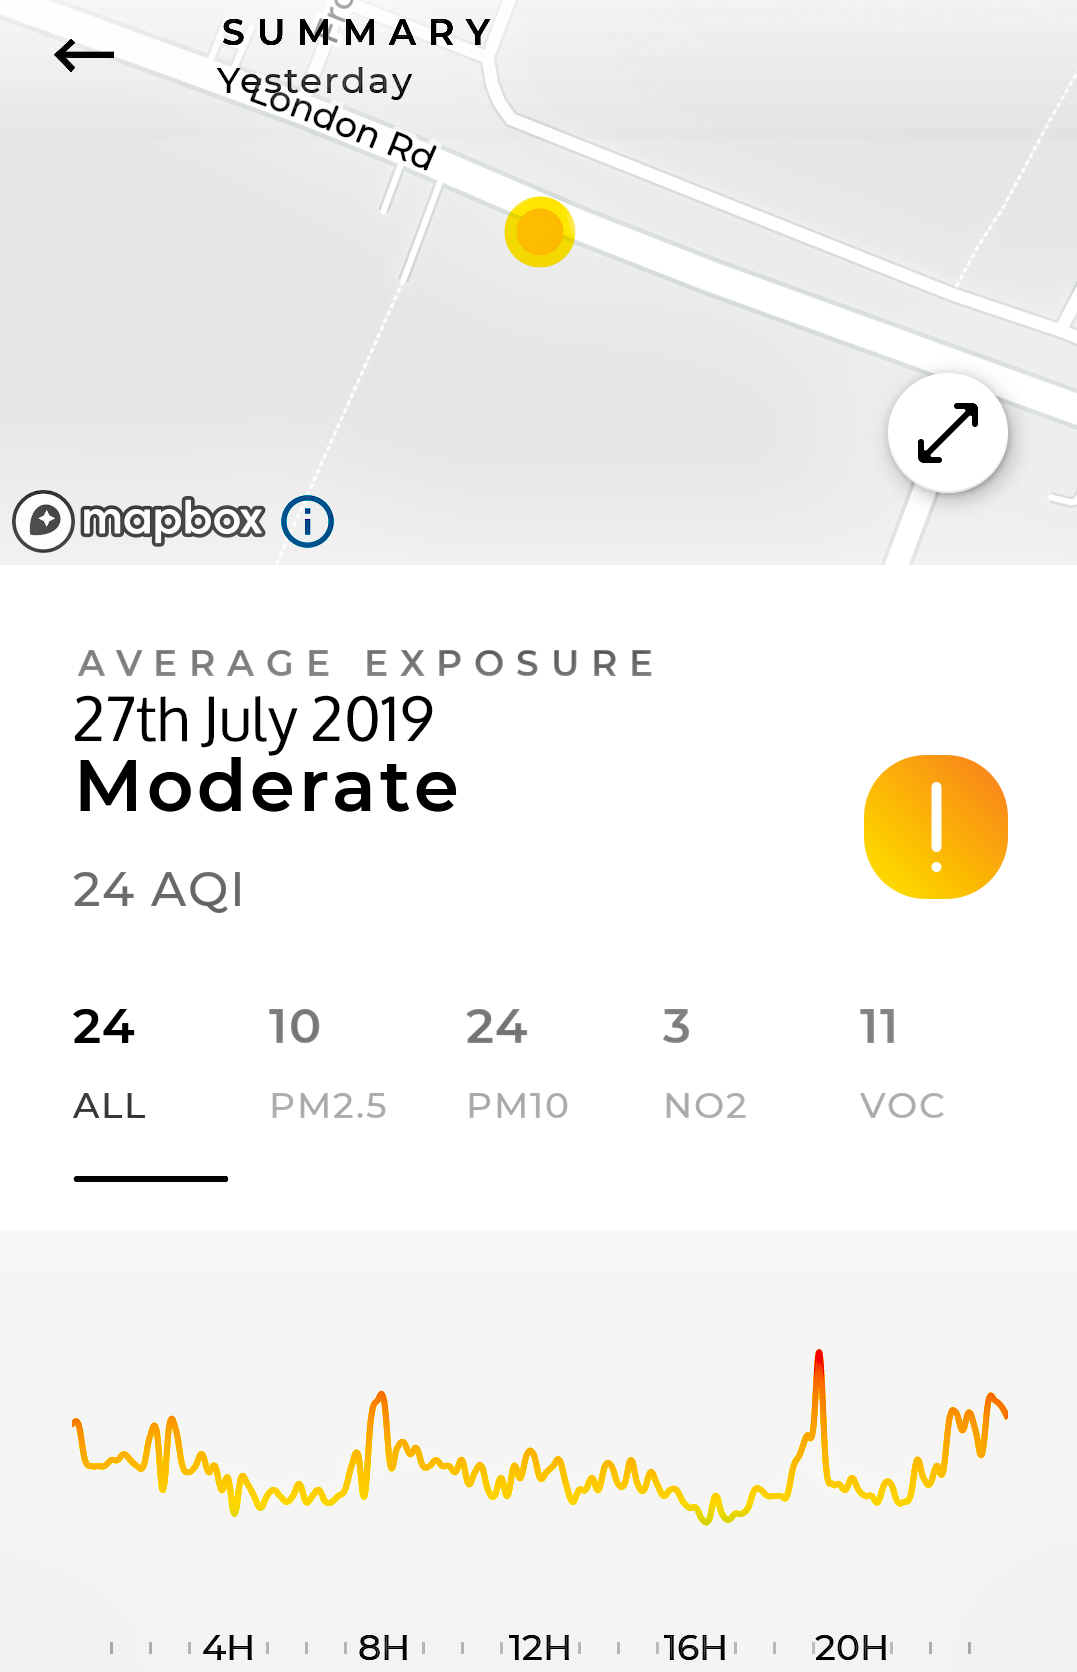
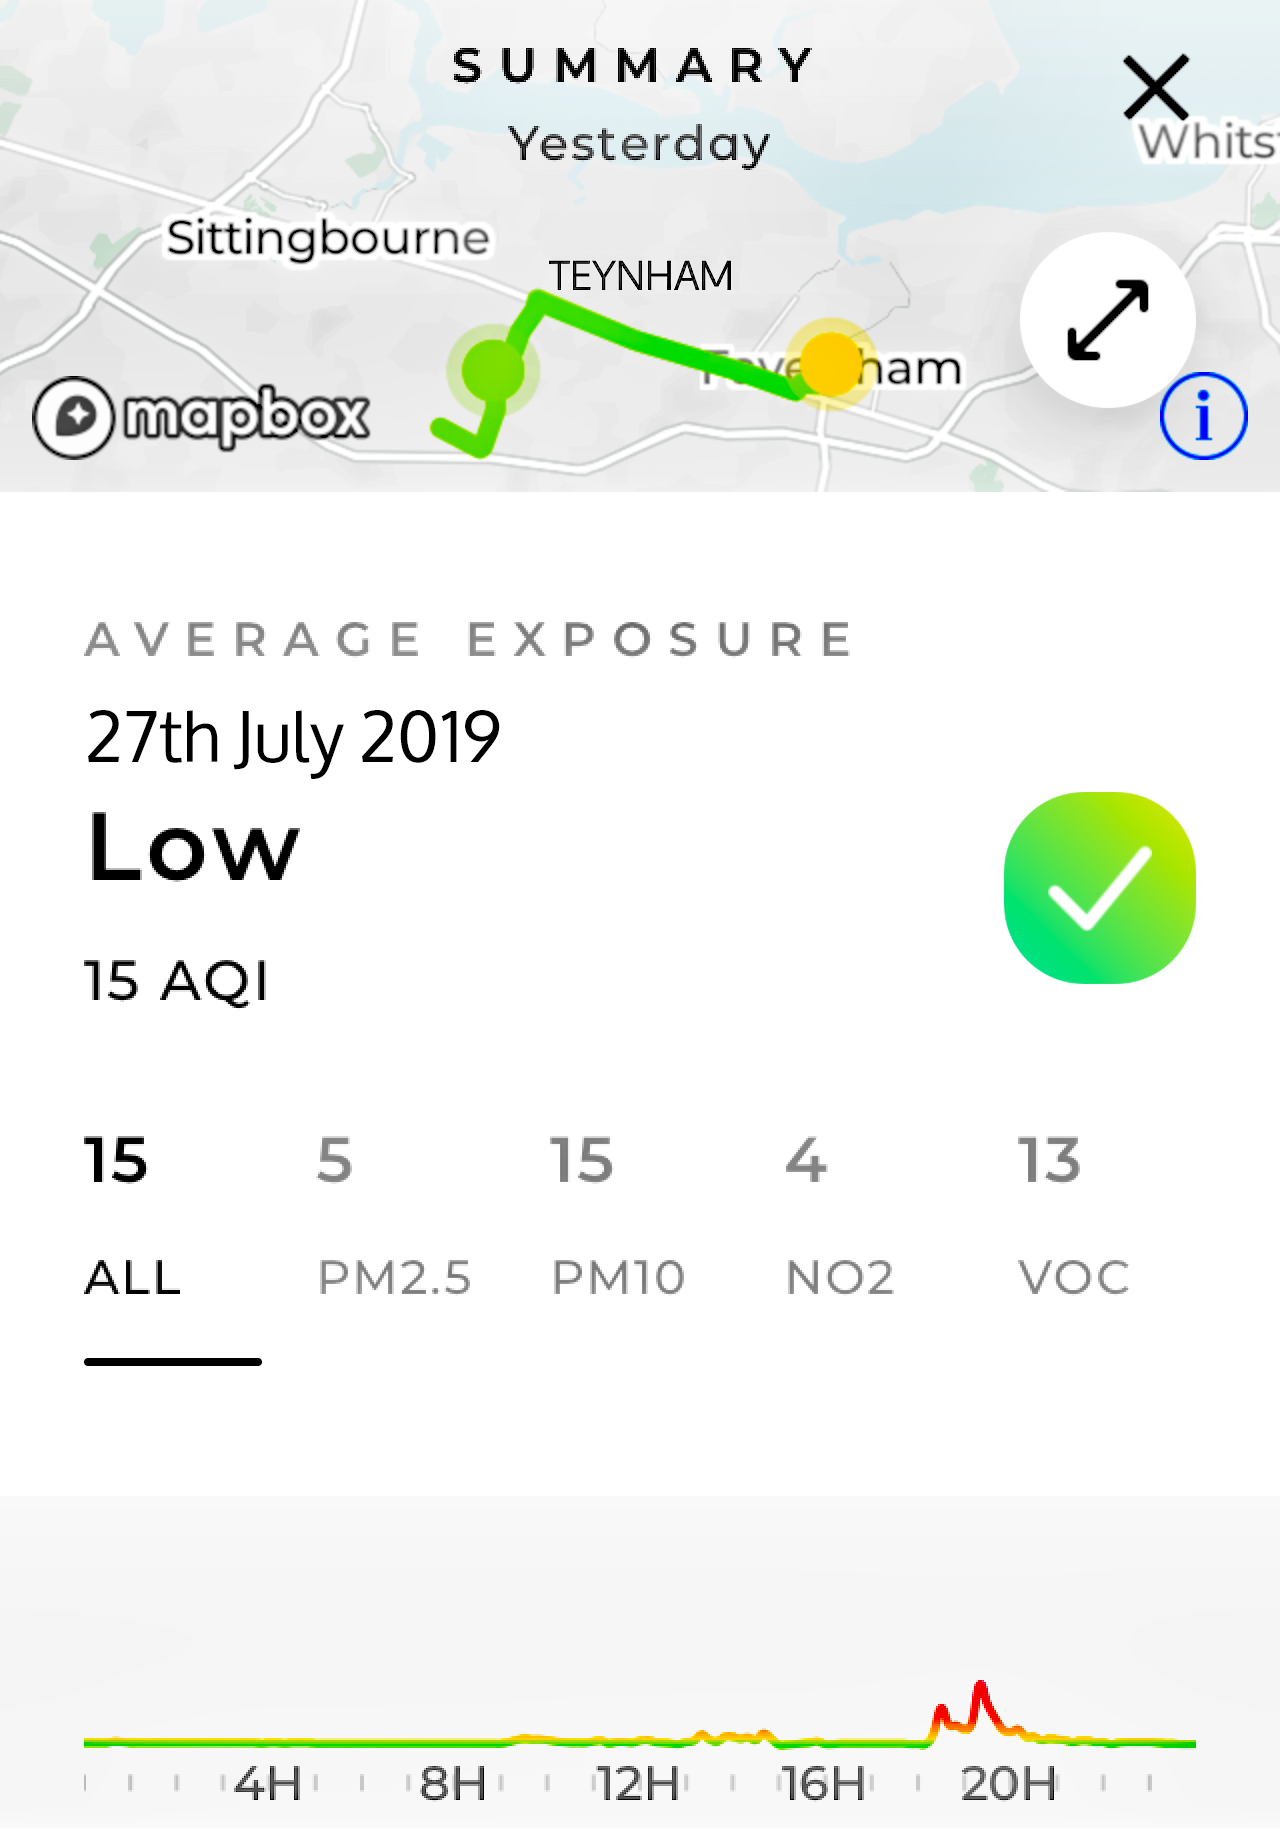
| 27th July Flow 1 Flow 2 |
10 | 24 | 3 | 11 | MODERATE | Flow 1: Graph: Rained on, early evening and overnight. | ||
| 5 | 15 | 4 | 13 | LOW | Flow 2: Graph & Map: Green from Kingsdown to Faversham! Excellent news! | |||
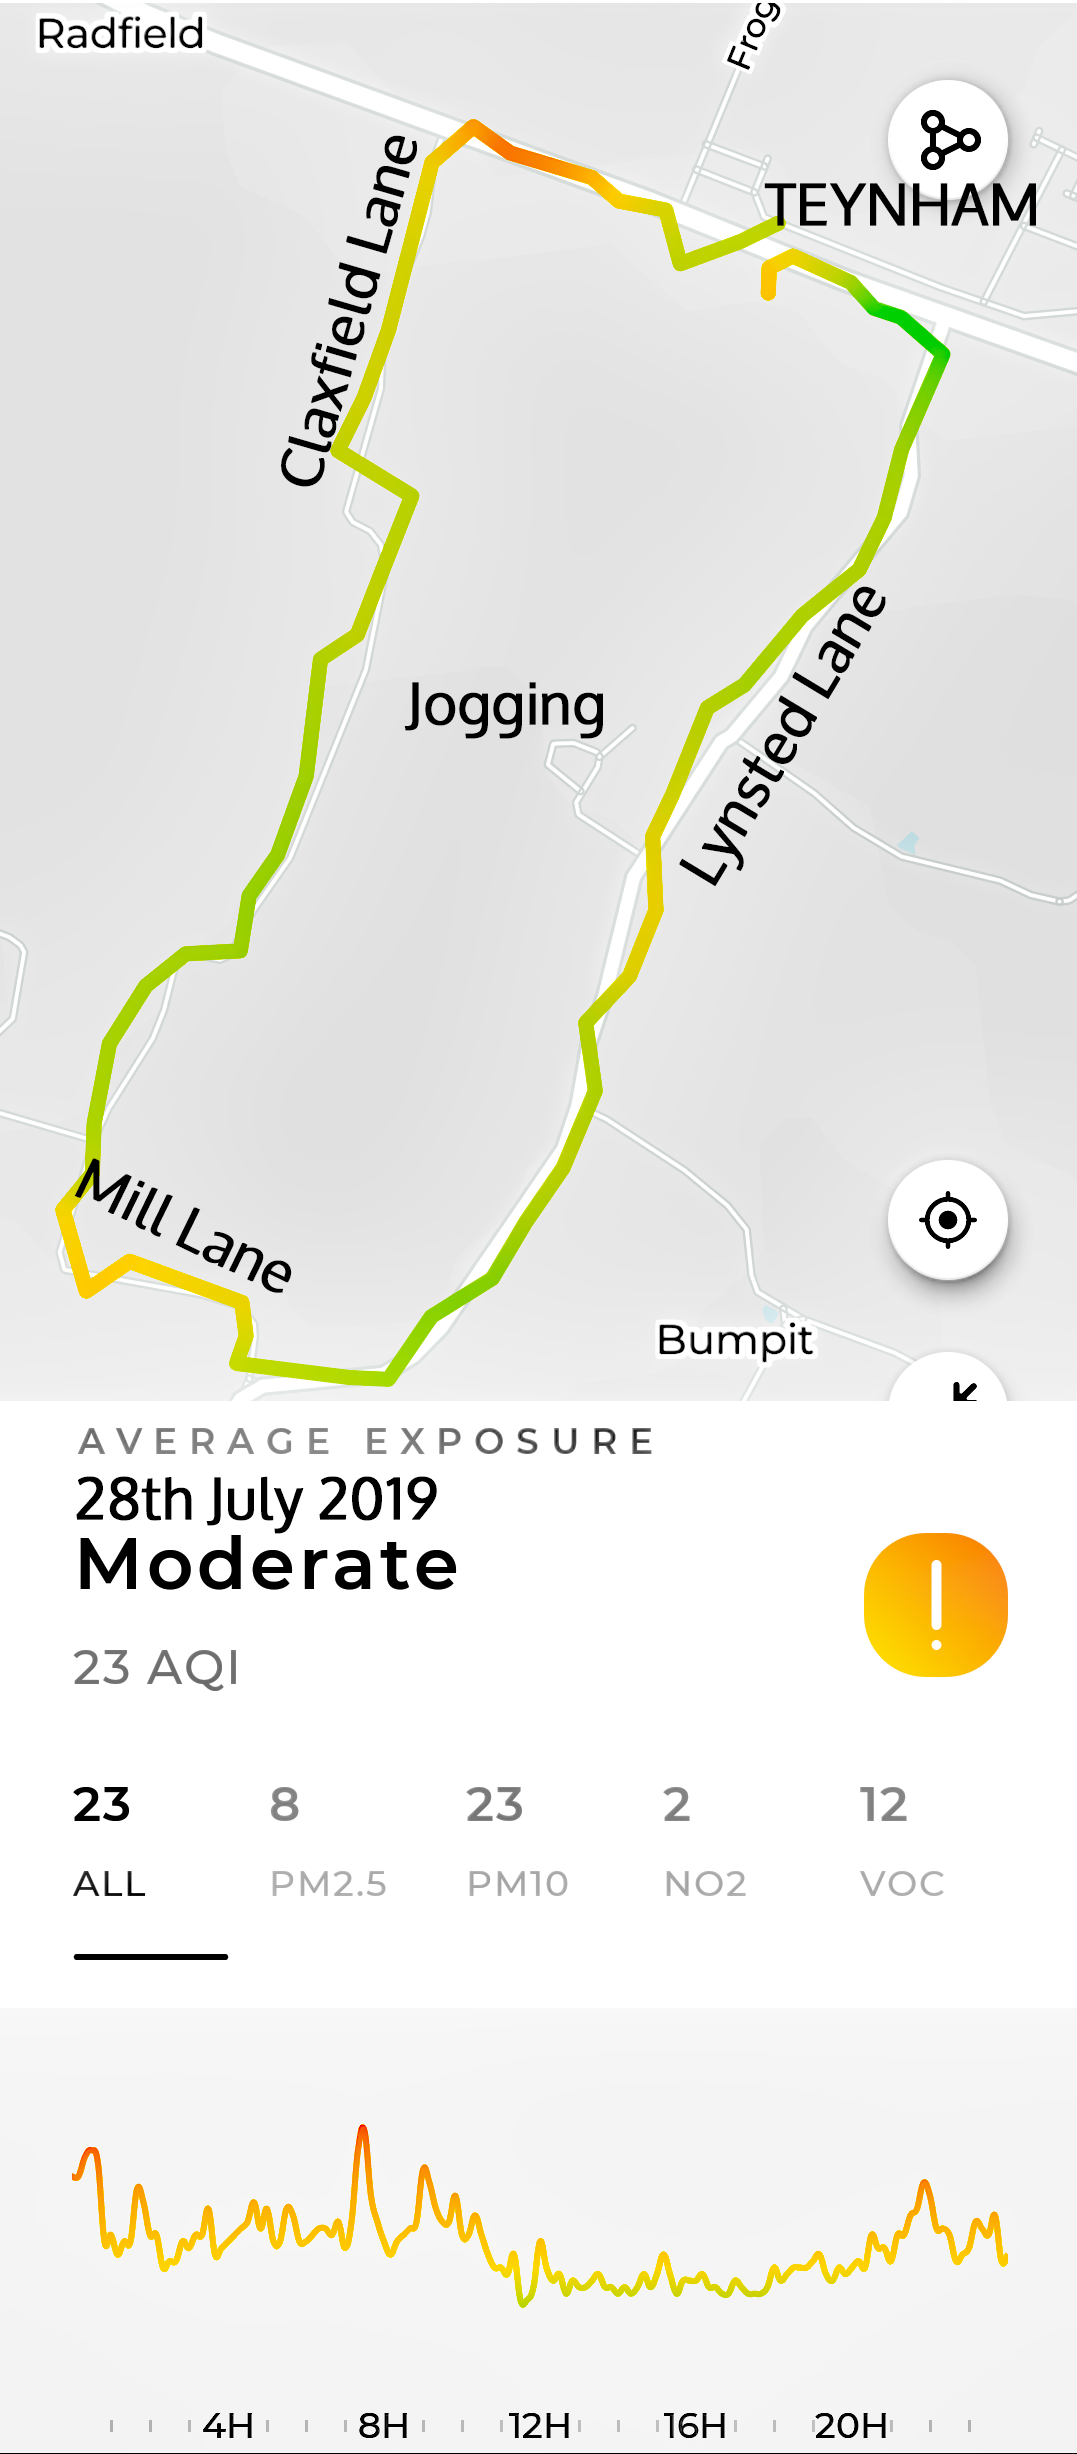
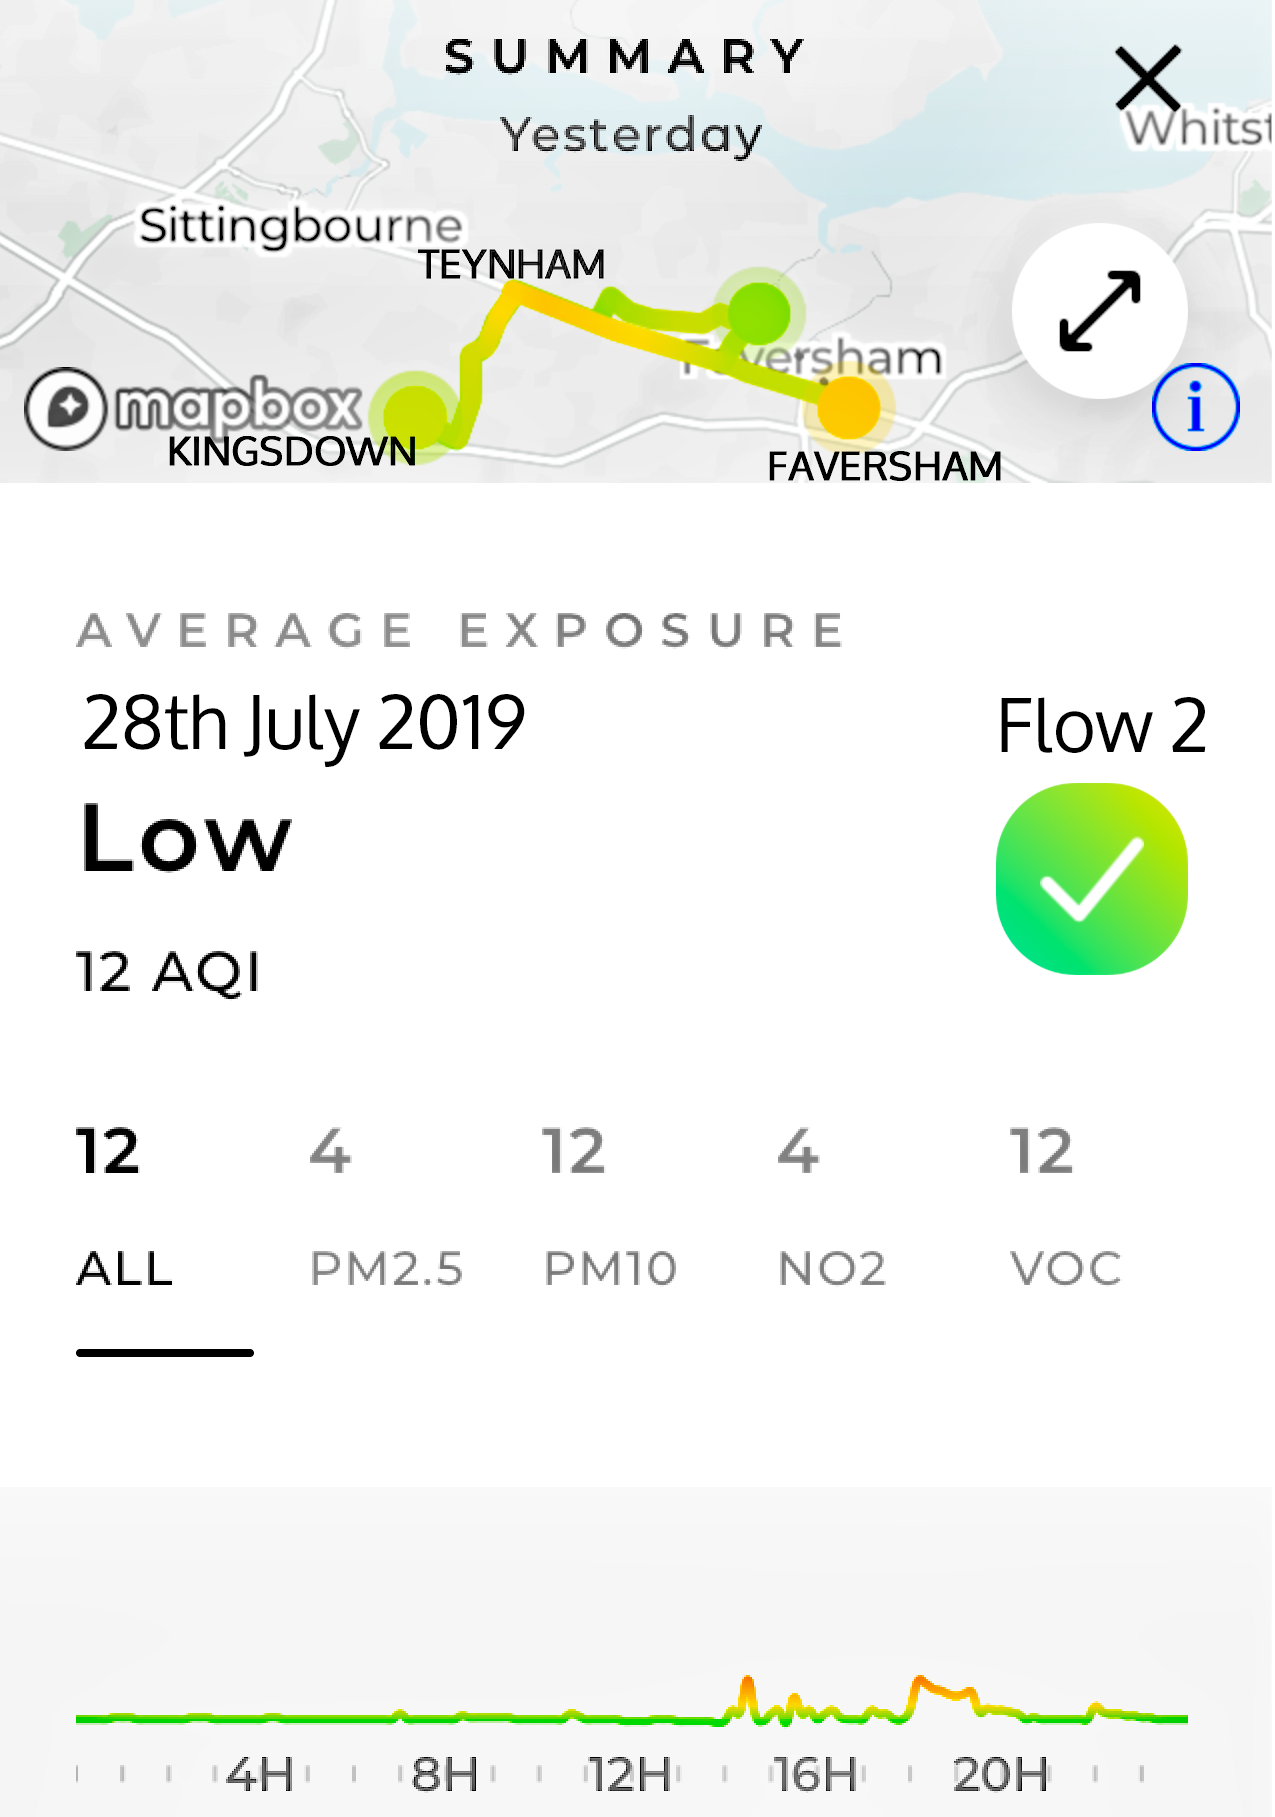
| 28th July Flow 1 Flow 2 |
8 | 23 | 2 | 12 | MODERATE | Flow 1: Graph and Map: Hot spot towards Claxfield Lane. | ||
| 4 | 12 | 4 | 12 | LOW | Flow 2: Graph and Map - A2 at Teynham MODERATE. | |||
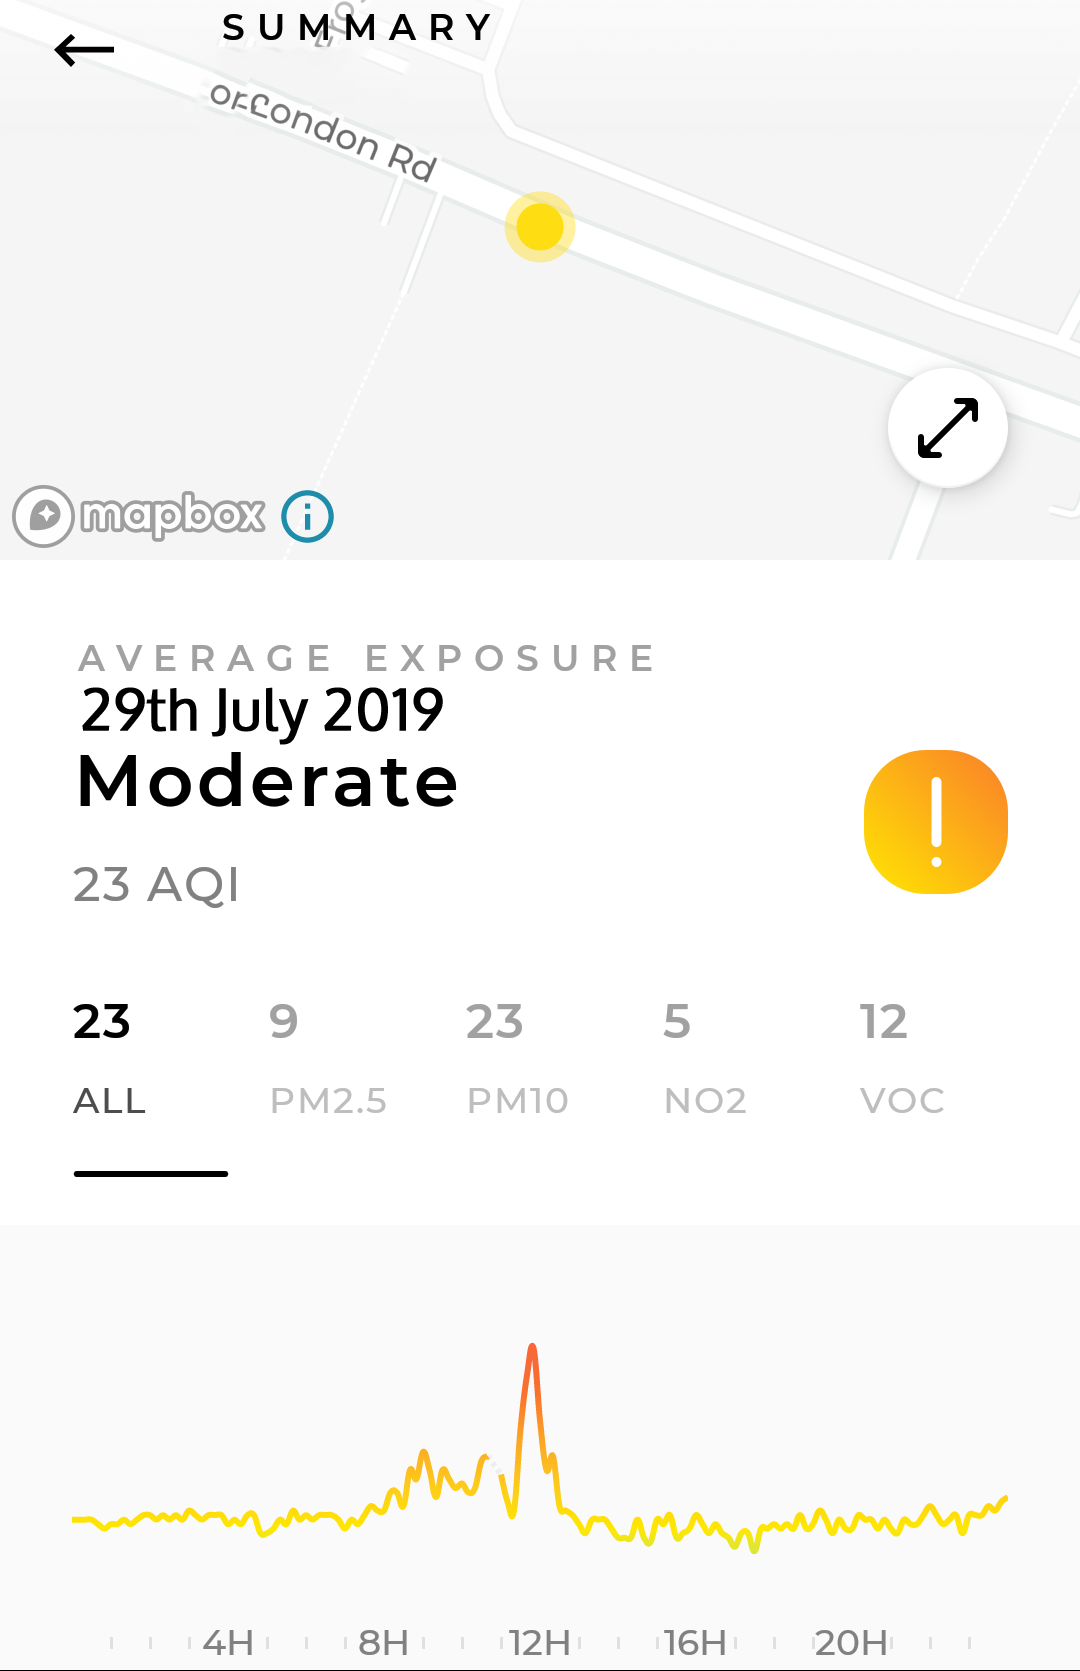
| 29th July | 9 | 23 | 5 | 12 | MODERATE | Flow 1: Graph. Midday Peak | ||
| 30th July | 11 | 28 | 3 | 13 | MODERATE | Flow 1: 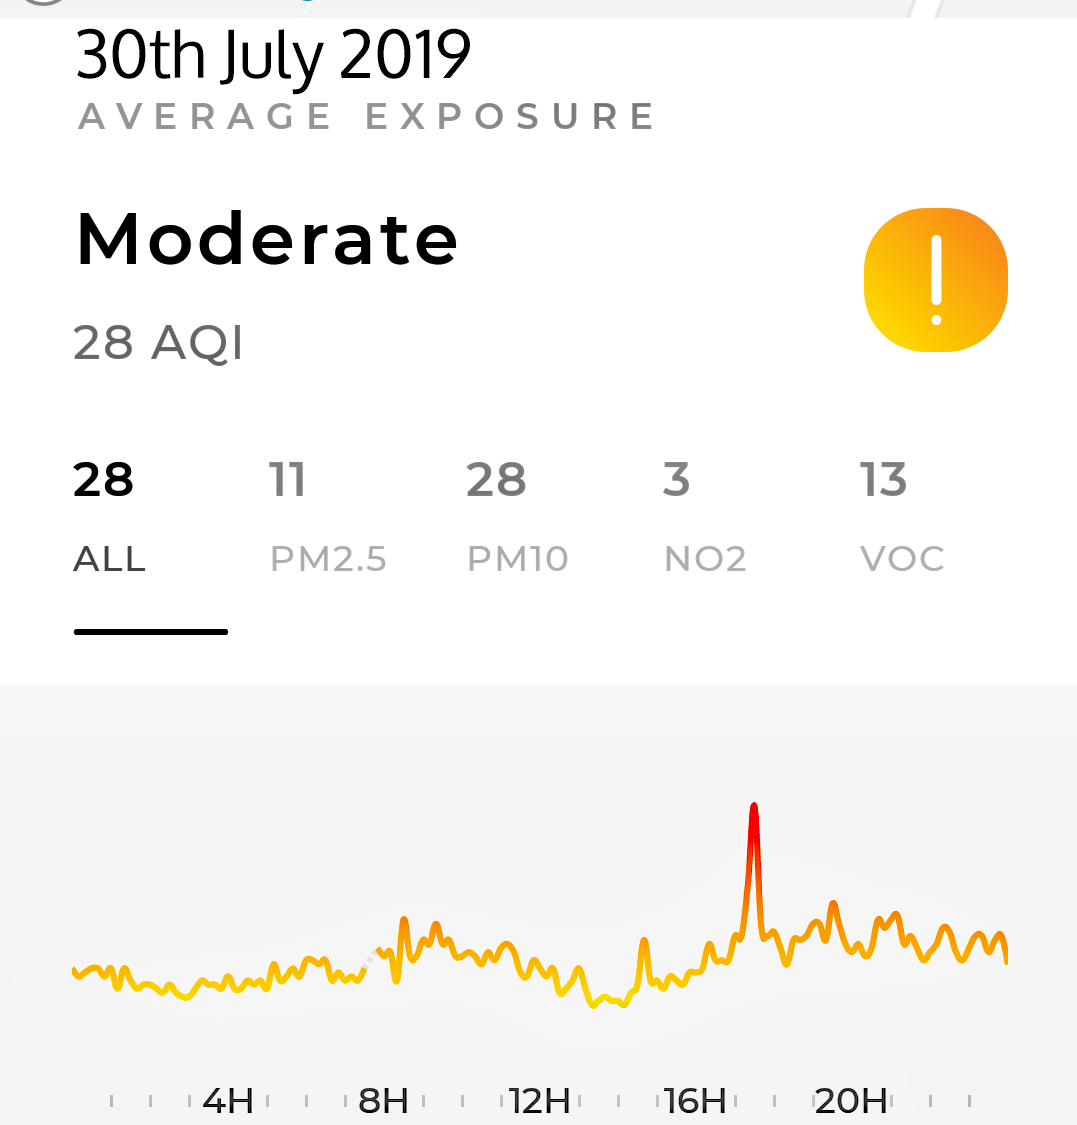 |
||
| 31st July | 9 | 25 | 2 | 12 | MODERATE | Flow 1: 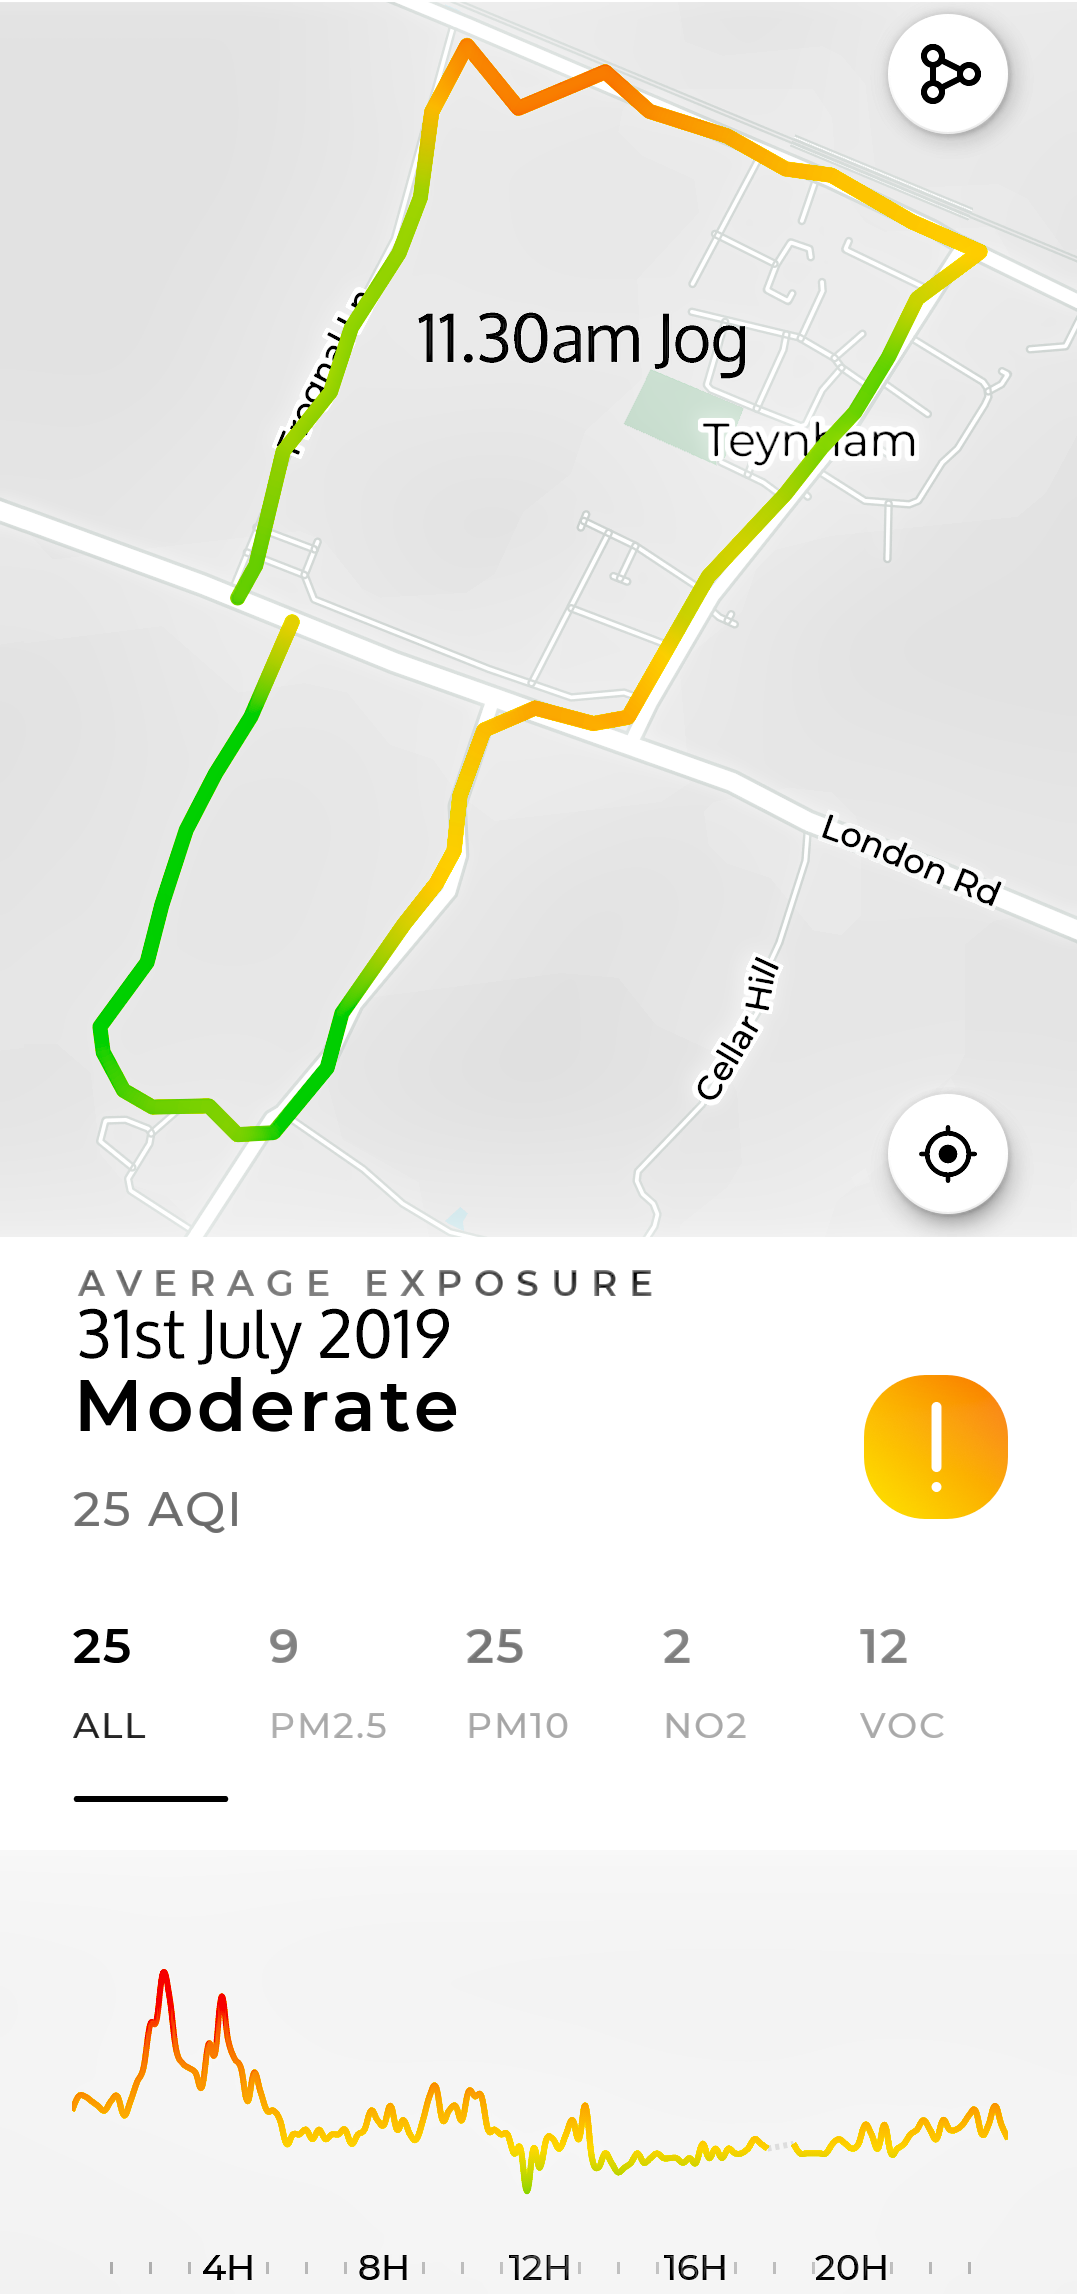 |
||
| AUGUST 2019 | ||||||||
| 1st August | 19 | 32 | 3 | 14 | MODERATE | Flow 1: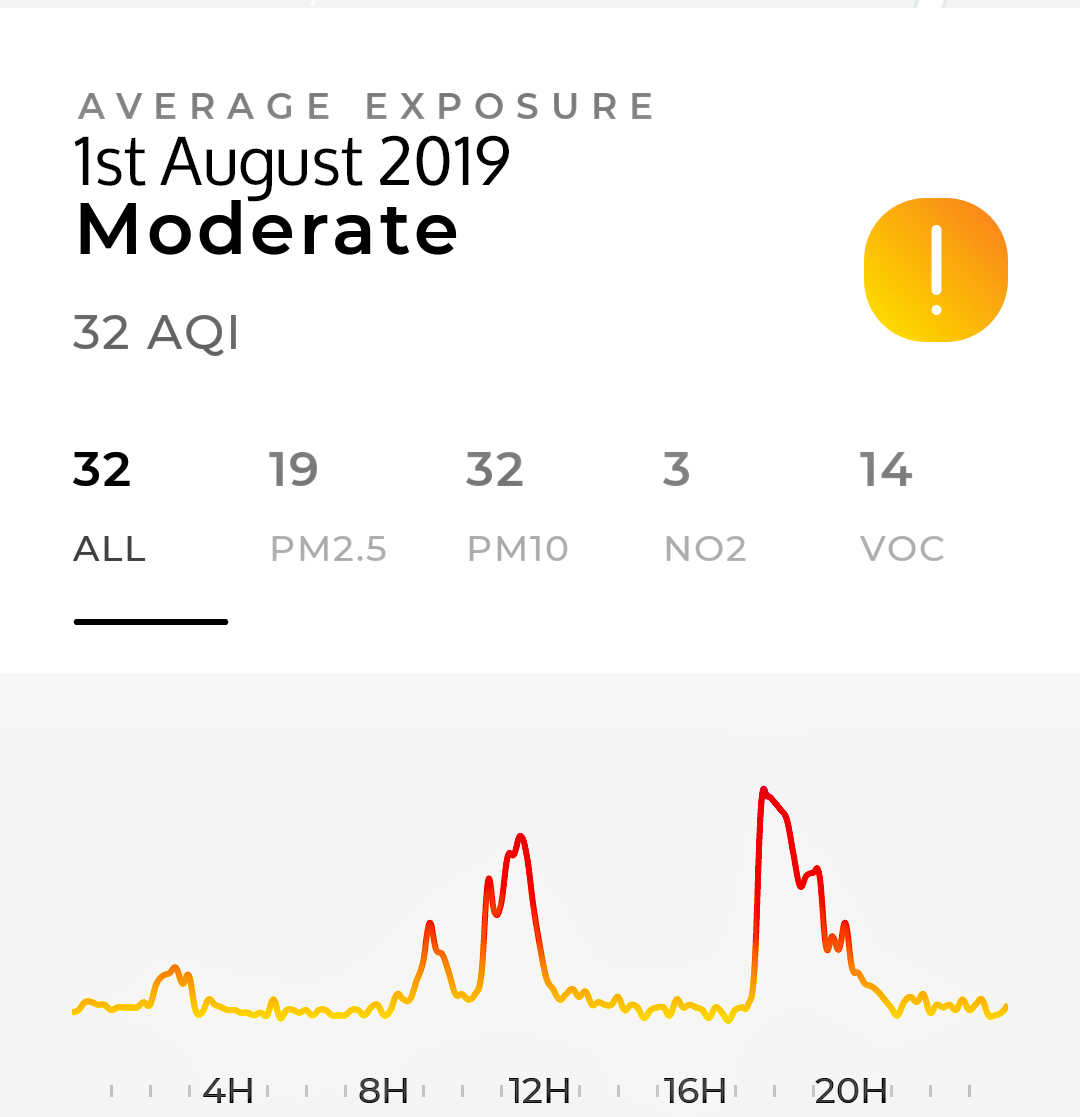 Traffic Lights in Place - off Frognal Lane Traffic Lights in Place - off Frognal Lane |
||
| 2nd August | - | 29 | - | - | MODERATE | Flow 1: 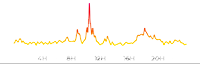 |
||
| 3rd August | - | 27 | - | - | MODERATE | Background Pollution | ||
| 4th August | - | 27 | - | - | MODERATE | Background Pollution | ||
| 5th August | - | 29 | - | - | MODERATE | Background Pollution | ||
| 6th August | - | 28 | - | - | MODERATE | Background Pollution | ||
| 7th August | - | 28 | - | - | MODERATE | Background Pollution | ||
| 8th August | - | 27 | - | - | MODERATE | Background Pollution | ||
| 9th August | - | 34 | - | - | MODERATE | Background Pollution | ||
| 10th August | 20 | 50 | 17 | 12 | HIGH | Exceedance | Flow 1: Just tipping into exceedance/marginal. |
|
| 11th August | 13 | 34 | 2 | 12 | MODERATE | Flow 1: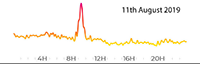 |
||
| 12th August | 10 | 25 | 4 | 11 | MODERATE | Flow 1: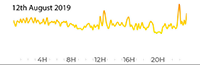 |
||
| 13th August | 11 | 25 | 3 | 11 | MODERATE | Flow 1: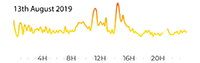 |
||
| 14th August | 9 | 23 | 2 | 13 | MODERATE | Flow 1: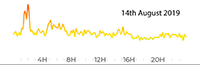 |
||
| 15th August | 9 | 23 | 1 | 13 | MODERATE | Flow 1: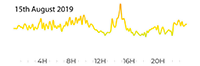 |
||
| 16th August | 9 | 23 | 4 | 11 | MODERATE | Flow 1: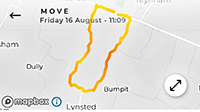 |
||
| 17th August | 9 | 24 | 2 | 13 | MODERATE | Flow 1: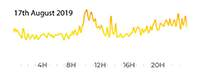 |
||
| 18th August | 9 | 26 | 2 | 12 | MODERATE | Flow 1: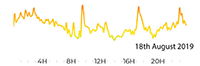 |
||
| 19th August | 10 | 27 | 1 | 12 | MODERATE | Flow 1: From this date we see a worsening position for PM2.5 through the month of August.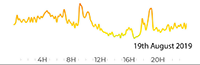 |
||
| 20th August | 11 | 26 | 3 | 11 | MODERATE | Flow 1: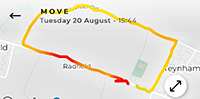 |
||
| 21st August | 14 | 26 | 3 | 15 | MODERATE | Flow 1: |
||
| 22nd Aug | 14 | 26 | 3 | 13 | MODERATE | Flow 1: |
||
| 23rd Aug | 11 | 25 | 4 | 12 | MODERATE | Flow 1: |
||
| 24th Aug | 20 | 23 | 2 | 14 | MODERATE | Flow 1: |
||
| 25th August | 15 | 17 | 4 | 15 | LOW |
Flow 1: |
||
| 26th August | 19 | 15 | 3 | 12 | LOW |
Flow 1: |
||
| 27th August | 26 | 18 | 2 | 15 | MODERATE | Flow 1: |
||
| 28th August | 21 | 19 | 3 | 13 | MODERATE | Flow 1: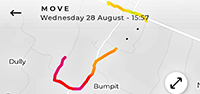 Power interrupted Power interrupted |
||
| 29th August | 15 | 18 | 4 | 10 | LOW | Flow 1: |
||
| 30th August | 33 | 22 | 3 | 12 | MODERATE | Flow 1: Power interrupted Power interrupted |
||
| 31st August | 20 | 19 | 3 | 15 | MODERATE | Flow 1: |
||
| 1st September | 31 | 21 | 5 | 11 | MODERATE | |||
| 2nd September | 20 | 20 | 5 | 25 | MODERATE | |||
| 3rd September | 13 | 16 | 0 | 19 | MODERATE | |||
| 4th September | 11 | 16 | 1 | 16 | LOW |
|||
| 5th September | 12 | 20 | 4 | 12 | MODERATE | |||
| 6th September | 11 | 23 | 2 | 16 | MODERATE | |||
| 7th September | 10 | 25 | 4 | 10 | MODERATE | |||
| 8th September | 10 | 23 | 4 | 11 | MODERATE | |||
| 9th September | 9 | 23 | 4 | 14 | MODERATE | |||
| 10th September | 10 | 24 | 2 | 14 | MODERATE | |||
| 11th September | 8 | 22 | 1 | 15 | MODERATE | |||
| 12th September | 7 | 20 | 1 | 14 | MODERATE | |||
| 13th September | 8 | 20 | 4 | 11 | MODERATE | |||
| 14th September | 11 | 27 | 5 | 9 | MODERATE | |||
| 15th September | 11 | 24 | 1 | 13 | MODERATE | |||
| 16th September | 9 | 21 | 3 | 13 | MODERATE | |||
| 17th September | 9 | 23 | 4 | 12 | MODERATE | |||
| 18th September | 12 | 30 | 3 | 15 | MODERATE | |||
| 19th September | 12 | 28 | 3 | 14 | MODERATE | |||
| 20th September | 9 | 24 | 4 | 13 | MODERATE | |||
| 21st September | 13 | 29 | 3 | 15 | MODERATE | |||
| 22nd September | 10 | 23 | 1 | 20 | MODERATE | |||
| 23rd September | 8 | 22 | 2 | 17 | MODERATE | |||
| 24th September | 10 | 26 | 0 | 16 | MODERATE | |||
| 25th September | 8 | 23 | 2 | 14 | MODERATE | |||
| 26th September | 9 | 24 | 1 | 13 | MODERATE | |||
| 27th September | 13 | 31 | 2 | 11 | MODERATE | |||
| 28th September | 10 | 25 | 0 | 12 | MODERATE | |||
NO MEASUREMENTS MADE IN AQMA5 between 28th September and 18th October |
||||||||
| 18th October | 18 | 23 | 2 | 13 | MODERATE | |||
| 19th October | 11 | 23 | 2 | 13 | MODERATE | 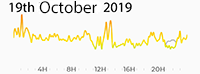 PM10 was the dominant fraction throughout. PM10 was the dominant fraction throughout. |
||
| 20th October | 14 | 31 | 6 | 8 | MODERATE | 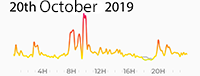 PM10 was the dominant pollution fraction with raised PM2.5 during the morning peaks. PM10 was the dominant pollution fraction with raised PM2.5 during the morning peaks. |
||
| 21st October | 11 | 28 | 14 | 10 | MODERATE | EXCEEDANCE [20.00-21.20pm] |
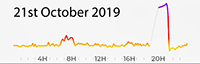 NO2 peak of "Very High" Exceedance in the evening. The period quoted only covers the period with evidential data (there was a break in power that is excluded from the calculation) NO2 peak of "Very High" Exceedance in the evening. The period quoted only covers the period with evidential data (there was a break in power that is excluded from the calculation) |
|
| 22nd October | 20 | 30 | 14 | 13 | MODERATE |  PM10 dominant fraction with the exception of the "very high" peak of NO2 - the last peak of the day. PM10 dominant fraction with the exception of the "very high" peak of NO2 - the last peak of the day. |
||
| 23rd October | 20 | 26 | 5 | 12 | MODERATE | 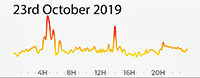 PM10 pollution fractions dominated all day with slightly elevated PM2.5 in the evening. PM10 pollution fractions dominated all day with slightly elevated PM2.5 in the evening. |
||
| 24th October | 16 | 19 | 3 | 17 | LOW |
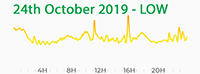 A good day. PM2.5 highest in morning; Afternoon a wider spread of pollutant fractions also at low levels. The figure is at the margin for "Low". A good day. PM2.5 highest in morning; Afternoon a wider spread of pollutant fractions also at low levels. The figure is at the margin for "Low". |
||
| 25th October | 11 | 26 | 3 | 15 | MODERATE | 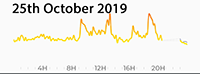 PM10 makes up nearly all the pollution fractions PM10 makes up nearly all the pollution fractions |
||
| 26th October | 13 | 28 | 2 | 13 | MODERATE | 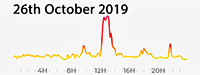 PM10 makes up nearly all the pollution fractions. PM10 makes up nearly all the pollution fractions. |
||
| 27th October | 16 | 22 | 5 | 10 | MODERATE | 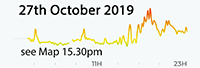 This Map link illustrates spread of pollution south over the lanes.. This Map link illustrates spread of pollution south over the lanes.. |
||
| 28th October | 41 | 27 | 28 | 5 | MODERATE | 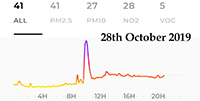 "Very High" (173) [9.47-10.23am] when heavy machinery movement was stuck. Congestion remained for a while afterwards. "Very High" (173) [9.47-10.23am] when heavy machinery movement was stuck. Congestion remained for a while afterwards. |
||
| 29th October | 66 | 35 | 8 | 10 | HIGH | EXCEEDANCE | 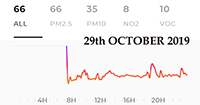 Incomplete data. Although it appears there was a "Very High" peak of NO2 - this cannot be confirmed - battery ran out. Incomplete data. Although it appears there was a "Very High" peak of NO2 - this cannot be confirmed - battery ran out. |
|
| 30th October | 62 | 32 | 4 | 11 | HIGH | EXCEEDANCE | 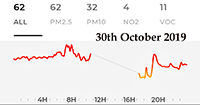 The pollution was very strongly dominated by PM2.5 throughout the day. The pollution was very strongly dominated by PM2.5 throughout the day. |
|
| 31st October | 61 | 40 | 33 | 15 | HIGH | EXCEEDANCE |
EXCEEDANCE |
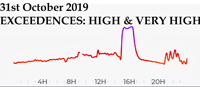 Interestingly the "Very High" measurement was dominated by NO2, the bulk of pollution over the 24-hour period was, however mainly PM2.5 pollutants. Interestingly the "Very High" measurement was dominated by NO2, the bulk of pollution over the 24-hour period was, however mainly PM2.5 pollutants. |
| NOVEMBER 2019 | ||||||||
| 1st November | 23 | 21 | 2 | 26 | MODERATE | 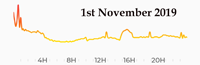 The peaks to the right were made up mostly by PM10 pollutants The peaks to the right were made up mostly by PM10 pollutants |
||
| 2nd November | 22 | 22 | 2 | 25 | MODERATE | 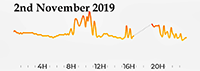 The main components of pollution were in the PM2.5 and PM10 fractions of pollutants measured. The main components of pollution were in the PM2.5 and PM10 fractions of pollutants measured. |
||
| 3rd November | 33 | 23 | 10 | 18 | MODERATE | 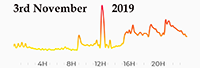 The sharp peak at midday was dominated by the NO2 fraction of pollutants. The sharp peak at midday was dominated by the NO2 fraction of pollutants. |
||
| 4th November | 35 | 22 | 2 | 15 | MODERATE | 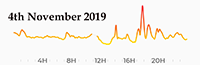 The tallest peak was generated by PM10 fraction of pollutants. The tallest peak was generated by PM10 fraction of pollutants. |
||
| 5th November | 41 | 24 | 5 | 13 | MODERATE | 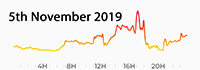 The main peak is dominated by PM2.5, although the last peak in that series was dominated by PM10. The main peak is dominated by PM2.5, although the last peak in that series was dominated by PM10. |
||
| 6th November | 54 | 29 | 8 | 12 | HIGH | EXCEEDANCE |
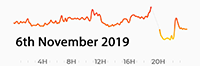 The density of traffic here is increasing now that the roadworks in Faversham have cleared and drivers are no longer driving the 'long way round' to Sittingbourne and beyond. The dominant pollutant was from the PM2.5 fraction. The density of traffic here is increasing now that the roadworks in Faversham have cleared and drivers are no longer driving the 'long way round' to Sittingbourne and beyond. The dominant pollutant was from the PM2.5 fraction. |
|
| 7th November | 58 | 30 | 6 | 15 | HIGH | EXCEEDANCE |
 The density of traffic here is increasing now that the roadworks in Faversham have cleared and drivers are no longer driving the 'long way round' to Sittingbourne and beyond. Both Exceedances were from the NO2 fraction of Pollutants The density of traffic here is increasing now that the roadworks in Faversham have cleared and drivers are no longer driving the 'long way round' to Sittingbourne and beyond. Both Exceedances were from the NO2 fraction of Pollutants |
|
| 8th November | 66 | 35 | 32 | 10 | HIGH | EXCEEDANCE |
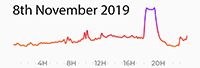 Traffic levels are noticeably higher than in recent weeks - heavy traffic well into the evenings. The high pollution is a reasonable measure of what is "normal" for us in Teynham and Lynsted. But once we see Traffic throttling by Drain Repairs (starting January 2020) it will be interesting to see what happens to the mix of pollutants. The Exceedance was from the NO2 fraction of pollutants. Traffic levels are noticeably higher than in recent weeks - heavy traffic well into the evenings. The high pollution is a reasonable measure of what is "normal" for us in Teynham and Lynsted. But once we see Traffic throttling by Drain Repairs (starting January 2020) it will be interesting to see what happens to the mix of pollutants. The Exceedance was from the NO2 fraction of pollutants. |
|
| 9th November | 74 | 38 | 33 | 10 | HIGH | EXCEEDANCE |
EXCEEDANCE [12.01 - 13.11pm] |
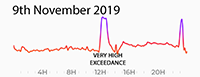 Both peaks were from the PM2.5 fraction - only the first peak was an "exceedance" at "Very High" levels. Both peaks were from the PM2.5 fraction - only the first peak was an "exceedance" at "Very High" levels. |
| 10th November | 66 | 36 | 15 | 13 | HIGH | EXCEEDANCE |
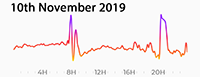 The "Very High" peaks were in the NO2 pollution fraction. These measurements were not an Exceedance at "Very High" levels as the periods were less than one hour continuous - 7.04-8.03am & 20.16-21.12pm). The "Very High" peaks were in the NO2 pollution fraction. These measurements were not an Exceedance at "Very High" levels as the periods were less than one hour continuous - 7.04-8.03am & 20.16-21.12pm). |
|
| 11th November | 49 | 29 | 15 | 15 | MODERATE (see comment) |
 This PM2.5 measurement is right at the margin, so I have placed it into "MODERATE" even though the App data identifies it as "HIGH". The dominant pollution was NO2. This PM2.5 measurement is right at the margin, so I have placed it into "MODERATE" even though the App data identifies it as "HIGH". The dominant pollution was NO2. |
||
| 12th November | 46 | 25 | 34 | 14 | MODERATE | EXCEEDANCE [13.55-16.10pm] |
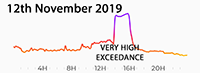 Exceedance was in the NO2 pollution fraction Exceedance was in the NO2 pollution fraction |
|
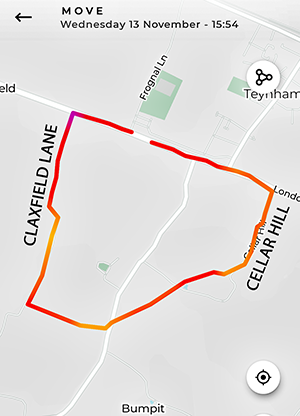
| 13th November | 31 | 21 | 21 | 12 | MODERATE | EXCEEDANCE [12.20-14.05pm] |
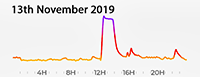 The principle pollutant was in the PM2.5 fraction of Particulate Matter (very fine and most damaging). Map south of A2. However, the exceedance was in the NO2 fraction of pollutants (156 score).. The principle pollutant was in the PM2.5 fraction of Particulate Matter (very fine and most damaging). Map south of A2. However, the exceedance was in the NO2 fraction of pollutants (156 score).. |
|
| 14th November | 21 | 20 | 24 | 13 | MODERATE | EXCEEDANCE [8.30-10.30pm] |
 Exceedance was in the NO2 fraction. Otherwise the pollution was at the lower end of MODERATE. Exceedance was in the NO2 fraction. Otherwise the pollution was at the lower end of MODERATE. |
|
| 15th November | 21 | 24 | 4 | 9 | MODERATE | The anomylous spike was NO2; other polutants are mainly PM2.5 and PM10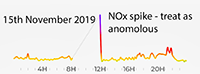 |
||
| 16th November | 38 | 24 | 28 | 14 | MODERATE | EXCEEDANCE 14.26-15.40 and 21.40-22.50 |
Two VERY HIGH NOx episodes of more than one hour = harmful. Map of jogging.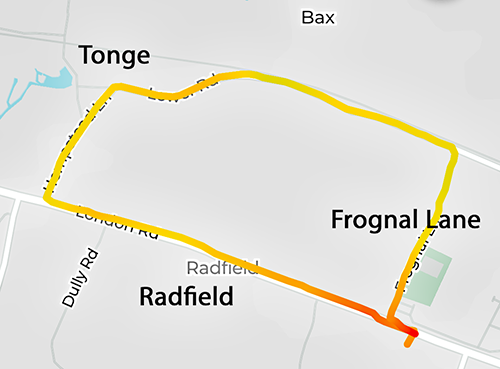 |
|
| 17th November | 57 | 32 | 14 | 13 | HIGH | EXCEEDANCE | Five minutes short of EXCEEDANCE at "VERY HIGH" for NOx. The whole day measured as "HIGH" for 24 hours (Exceedance)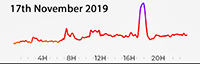 |
|
| 18th November | 54 | 29 | 36 | 14 | HIGH | EXCEEDANCE | EXCEEDANCE 10.20-11.35 - second spike only |
The first NOx spike did not last an hour; the second did.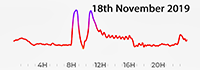 |
| 19th November | 77 | 40 | 17 | 9 | HIGH | EXCEEDANCE | . |
For Information: NOx was raised in the afternoon but th main pollutant was PM2.5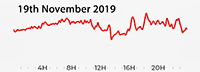 |
| 20th November | 72 | 37 | 17 | 11 | HIGH | EXCEEDANCE | EXCEEDANCE 22.47- 23.52 . |
NOx Spike was an exceedance of 65 minutes - this is at the margins but still registers as "Exceedance". |
| 21st November | 84 | 44 | 28 | 12 | HIGH | EXCEEDANCE | Almost uniform HIGH levels of pollution all day. |
|
| 22nd November | 81 | 42 | 14 | 20 | HIGH | EXCEEDANCE | Map of jog south of A2 - HIGH pollution throughout. 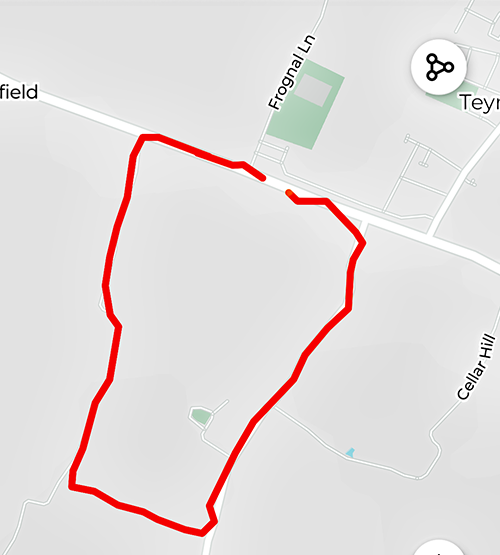 |
|
| 23rd November | 54 | 33 | 9 | 21 | HIGH | EXCEEDANCE | The midday peak (PM10) coincided with peaks of PM2.5 and NOx . 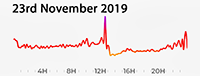 |
|
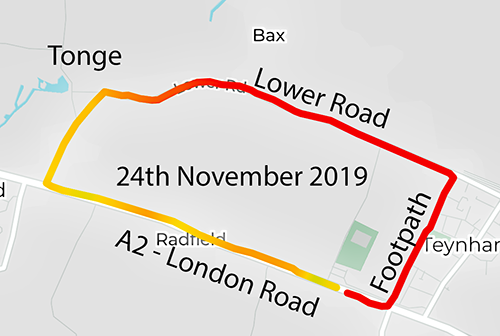
| 24th November | 35 | 27 | 5 | 21 | MODERATE | 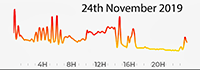 PM2.5 component dropped during the afternoon after high levels earlier. Also mapped jogging. |
||
| 25th November | 24 | 24 | 2 | 20 | MODERATE | 8am 5-vehicle pile-up on M2 Junction 5 (A249).. This accounts for earlier pulses of high pollution.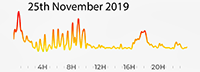 |
||
| 26th November | 16 | 20 | 0 | 19 | MODERATE | Right at the margins with "LOW" PM2.5 and VOCs. . 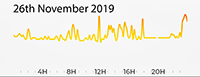 |
||
| 27th November | 14 | 18 | 1 | 17 | LOW |
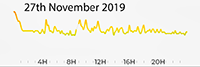 |
||
| 28th November | 14 | 19 | 1 | 15 | LOW |
Right at the margin with "MODERATE"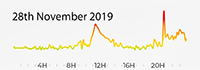 |
||
| 29th November | 23 | 30 | 1 | 6 | MODERATE | 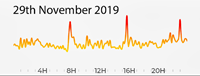 Mapped Jog South of the A2. Mapped Jog South of the A2. |
||
| 30th November | 33 | 25 | 9 | 4 | MODERATE | 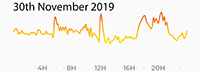 |
||
| 1st December | 18 | 24 | 22 | 5 | MODERATE | 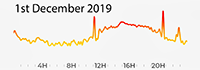 Mapped jog along Lower Road. Mapped jog along Lower Road. |
||
| 2nd December | 34 | 24 | 11 | 6 | MODERATE | 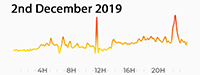 |
||
| 3rd December | 31 | 22 | 25 | 8 | MODERATE | 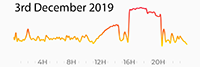 Also mapped jog to Deerton Street Also mapped jog to Deerton Street |
||
| 4th December | 41 | 29 | 17 | 9 | MODERATE | 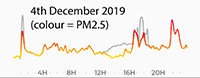 Showing PM2.5 in colour; the grey line is total with PM10 giving the sharp peaks. Showing PM2.5 in colour; the grey line is total with PM10 giving the sharp peaks. |
||
| 5th December | 28 | 25 | 10 | 15 | MODERATE | 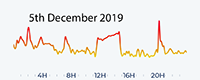 |
||
| 6th December | 11 | 27 | 3 | 31 | MODERATE | 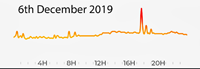 Unusually high for VOCs (solvents, incomplete combustion, chemical reactions in damp, etc) Unusually high for VOCs (solvents, incomplete combustion, chemical reactions in damp, etc) |
||
| 7th December | 11 | 24 | 2 | 27 | MODERATE | 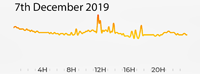 Unusually high VOCs. Unusually high VOCs. |
||
| 8th December | 12 | 27 | 0 | 23 | MODERATE | 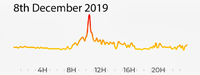 High pollution (PM10 & PM2.5) during run along A2, Tonge Lane and Lower Road to Teynham again. Mapped run from 10.15am.. High pollution (PM10 & PM2.5) during run along A2, Tonge Lane and Lower Road to Teynham again. Mapped run from 10.15am.. |
||
| 9th December | 16 | 31 | 3 | 11 | MODERATE | 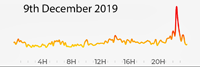 PM10 dominant. PM10 dominant. |
||
| 10th December | 21 | 38 | 25 | 16 | MODERATE | EXCEEDANCE 10.50-12.25 . |
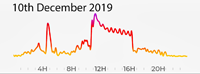 VERY HIGH episode = EXCEEDANCE in NOx!! NOx peaked in particular between 10am to 4pm. VERY HIGH episode = EXCEEDANCE in NOx!! NOx peaked in particular between 10am to 4pm. |
|
| 11th December | 15 | 30 | 2 | 14 | MODERATE | 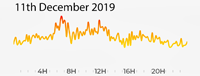 |
||
| 12th December | 17 | 29 | 22 | 12 | MODERATE | 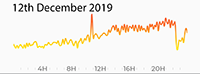 Pollution levels increased throughout the day. The 'pulses' of pollution may be linked with traffic control systems and weight of traffic (accident on M2??) Pollution levels increased throughout the day. The 'pulses' of pollution may be linked with traffic control systems and weight of traffic (accident on M2??) |
||
| 13th December | 14 | 34 | 5 | 13 | MODERATE | 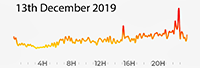 Strongly dominated by PM10 again. Strongly dominated by PM10 again. |
||
| 14th December | 15 | 35 | 3 | 13 | MODERATE | 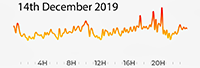 |
||
| 15th December | 13 | 31 | 1 | 12 | MODERATE | 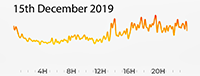 Another day characterised by 'pulsing' peaks throughout the day. Map run to Tonge Lane starting at 13.26pm. Another day characterised by 'pulsing' peaks throughout the day. Map run to Tonge Lane starting at 13.26pm. |
||
| 16th December | 16 | 29 | 2 | 11 | MODERATE | 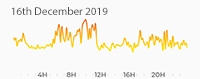 Small NOx peak in early afternoon, otherwise very much dominated by PM10 Small NOx peak in early afternoon, otherwise very much dominated by PM10 |
||
| 17th December | 19 | 26 | 1 | 11 | MODERATE | 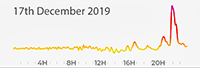 PM2.5 rose significantly from 4pm until 11pm. PM2.5 rose significantly from 4pm until 11pm. |
||
| 18th December | 20 | 30 | 4 | 13 | MODERATE | 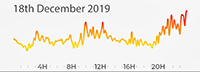 Underlying PM2.5 peaked from 8am-midday and again in late evening Underlying PM2.5 peaked from 8am-midday and again in late evening |
||
| 19th December | 19 | 37 | 0 | 19 | MODERATE | 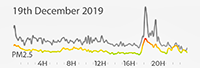 PM2.5 levels mirrored PM2.5 throughout the day. PM2.5 levels mirrored PM2.5 throughout the day. |
||
| 20th December | 11 | 23 | 1 | 17 | MODERATE | 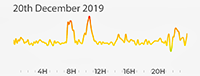 PM2.5 mostly paralleled PM10 until 9pm when the registered peak was made up of PM2.5 overnight. PM2.5 mostly paralleled PM10 until 9pm when the registered peak was made up of PM2.5 overnight. |
||
| 21st December | 16 | 30 | 1 | 13 | MODERATE | 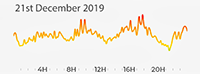 Figures strongly dominated by PM10. The overnight peaks of PM2.5 returned to previous levels by 2am. Figures strongly dominated by PM10. The overnight peaks of PM2.5 returned to previous levels by 2am. |
||
| 22nd December | 12 | 26 | 1 | 12 | MODERATE | 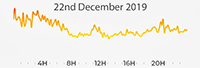 PM2.5 ran parallel below PM10 throughout the day. PM2.5 ran parallel below PM10 throughout the day. |
||
| 23rd December | 14 | 32 | 1 | 11 | MODERATE | 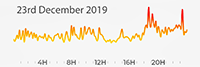 PM2.5 ran parallel below PM10 throughout the day. PM2.5 ran parallel below PM10 throughout the day. |
||
| 24th December | 15 | 34 | 19 | 20 | MODERATE | 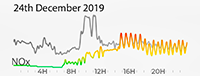 Sudden change in balance! NOx peaks make up most of the pollution from 3pm to the end of the day. The graph picks this out for information. Could this be the pre-Christmas travel? Sudden change in balance! NOx peaks make up most of the pollution from 3pm to the end of the day. The graph picks this out for information. Could this be the pre-Christmas travel? |
||
| 25th December | 24 | 37 | 5 | 8 | MODERATE | 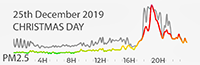 Hopefully most people travelling arrived safely. 6pm sees major peaks including bursts of "Very High" levels of both PM2.5 and PM10. PM2.5 highlighted in graph. Hopefully most people travelling arrived safely. 6pm sees major peaks including bursts of "Very High" levels of both PM2.5 and PM10. PM2.5 highlighted in graph. |
||
| 26th December | 20 | 32 | 11 | 13 | MODERATE | 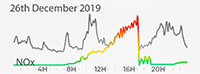 Dominated by PM10 except for a period from 1pm to 5pm when NOx created the large block of peaks. Perhaps people returning home after Christmas? NOx peaks highlighted in graph. Dominated by PM10 except for a period from 1pm to 5pm when NOx created the large block of peaks. Perhaps people returning home after Christmas? NOx peaks highlighted in graph. |
||
| 27th December | 29 | 29 | 4 | 11 | MODERATE | 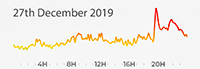 Both PM2.5 and PM10 were almost exactly the same throughout the day. Both PM2.5 and PM10 were almost exactly the same throughout the day. |
||
| 28th December | 34 | 31 | 5 | 12 | MODERATE | 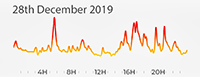 Both PM2.5 and PM10 were almost exactly the same throughout the day. Both PM2.5 and PM10 were almost exactly the same throughout the day. |
||
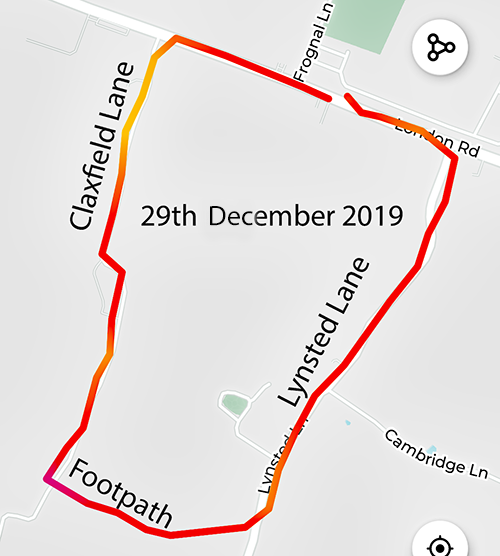
| 29th December | 27 | 24 | 6 | 11 | MODERATE | 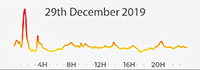 PM2.5 and PM10 were the same except the early morning peak (2am) which was PM10. PM2.5 and PM10 were the same except the early morning peak (2am) which was PM10. |
||
| 30th December | 23 | 19 | 3 | 12 | MODERATE | 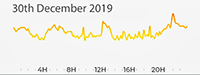 PM2.5 dominated by a slim margin over PM10. PM2.5 dominated by a slim margin over PM10. |
||
| 31st December | 35 | 33 | 4 | 10 | MODERATE | 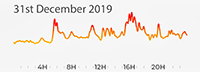 PM2.5 and PM10 mirrored eachother except the "High" peaks were PM10. PM2.5 and PM10 mirrored eachother except the "High" peaks were PM10. |
||
| 2020 | ||||||||
| 1st January | 44 | 35 | 11 | 10 | MODERATE | 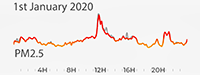 PM2.5 accounts for the shape and peaks/troughs of the whole graph. PM2.5 accounts for the shape and peaks/troughs of the whole graph. |
||
| 2nd January | 20 | 27 | 21 | 17 | MODERATE | 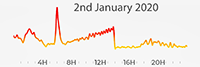 Elevated levels across all four pollution fractions. NOx dominated between 7am-2pm; the sharp "High" peak at 6am was PM10 and PM2.5. The A2 drain-works did not materialise on this 'due date.' Rapid cycles in traffic impacted by flow through Bapchild - the worst of which may halt when Greenstreet roadworks come on stream. Elevated levels across all four pollution fractions. NOx dominated between 7am-2pm; the sharp "High" peak at 6am was PM10 and PM2.5. The A2 drain-works did not materialise on this 'due date.' Rapid cycles in traffic impacted by flow through Bapchild - the worst of which may halt when Greenstreet roadworks come on stream. |
||
| 3rd January | 14 | 30 | 5 | 16 | MODERATE | 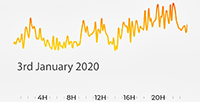 Evenly spread polution levels - PM10 dominated. Evenly spread polution levels - PM10 dominated. |
||
| 4th January | 11 | 26 | 3 | 13 | MODERATE | 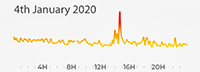 PM10 dominated again. PM10 dominated again. |
||
| 5th January | 13 | 27 | 1 | 12 | MODERATE | 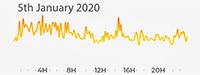 Rapid peaks and troughs of PM10; also of PM2.5. Rapid peaks and troughs of PM10; also of PM2.5. |
||
| 6th January | 14 | 28 | 6 | 13 | MODERATE | 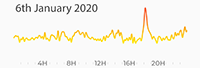 Rapid peaks and troughs of PM10; also of PM2.5. Rapid peaks and troughs of PM10; also of PM2.5. |
||
| LONDON ROAD (A2) - GREENSTREET - DRAIN RENEWAL (traffic pulsing through) --- Avoidance Tactics in Evidence but Local Construction Traffic Heavier --- |
||||||||
| 7th January | 16 | 38 | 2 | 14 | MODERATE | 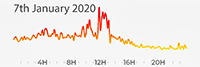 Rapid peaks and troughs in PM10 (and PM2.5) Rapid peaks and troughs in PM10 (and PM2.5) |
||
| 8th January | 15 | 31 | 1 | 16 | MODERATE | 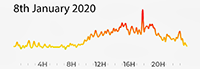 Rapid peaks and troughs with parallel tracking of PM2.5 and PM10. Rapid peaks and troughs with parallel tracking of PM2.5 and PM10. |
||
| 9th January | 11 | 26 | 0 | 14 | MODERATE | 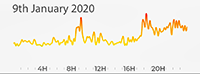 Pulses of PM10 dominating the measures of overall pollution. Reports of traffic in byways/'rat runs' starting to have an impact locally. Pulses of PM10 dominating the measures of overall pollution. Reports of traffic in byways/'rat runs' starting to have an impact locally. |
||
| 10th January | 14 | 23 | 4 | 7 | MODERATE | 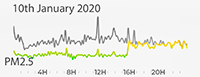 PM10 dominates until PM2.5 increases to equal levels from 4pm into the night. Pulses of traffic governed by new traffic lights at Station Road. PM10 dominates until PM2.5 increases to equal levels from 4pm into the night. Pulses of traffic governed by new traffic lights at Station Road. |
||
| 11th January | 14 | 29 | 1 | 11 | MODERATE | 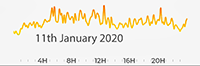 PM10 dominates, PM2.5 parallel at lower levels. Pulses of traffic. PM10 dominates, PM2.5 parallel at lower levels. Pulses of traffic. |
||
| 12th January | 12 | 28 | 2 | 13 | MODERATE | 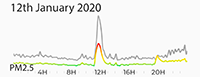 PM10 dominates, PM2.5 tracks the same pattern. Graph highlights PM2.5. Single peak at midday - HIGH. PM10 dominates, PM2.5 tracks the same pattern. Graph highlights PM2.5. Single peak at midday - HIGH. |
||
| 13th January | 14 | 34 | 1 | 11 | MODERATE | 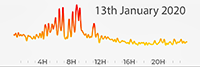 PM10 dominates, PM2.5 tracks the same pattern. Graph highlights PM2.5. Pollution HIGH between 4am-9am - multiple peaks. PM10 is parallel to PM2.5. PM10 dominates, PM2.5 tracks the same pattern. Graph highlights PM2.5. Pollution HIGH between 4am-9am - multiple peaks. PM10 is parallel to PM2.5. |
||
| 14th January | 15 | 37 | 1 | 14 | MODERATE | 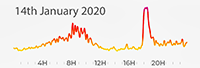 Rapid pulses dominated by PM10, mirrored by PM2.5. HIGH from 7.45am to 10am. Rapid pulses dominated by PM10, mirrored by PM2.5. HIGH from 7.45am to 10am. |
||
| 15th January | 13 | 30 | 2 | 12 | MODERATE | 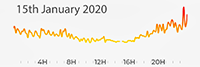 Pulsing throughout, growing to HIGH in late evening. Pulsing throughout, growing to HIGH in late evening. |
||
| 16th January | 14 | 29 | 1 | 11 | MODERATE | 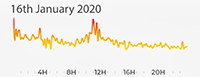 Pulsing dominated by PM10; PM2.5 in parallel peaks and troughs. Pulsing dominated by PM10; PM2.5 in parallel peaks and troughs. |
||
| 17th January | 11 | 25 | 2 | 12 | MODERATE | 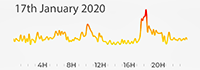 Pulsing throughout of both PMs. HIGH peak at 6pm. Pulsing throughout of both PMs. HIGH peak at 6pm. |
||
| 18th January | 17 | 30 | 5 | 5 | MODERATE | 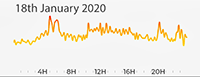 Pulsing throughout of both PMs. Pulsing throughout of both PMs. |
||
| 19th January | 29 | 32 | 11 | 4 | MODERATE | 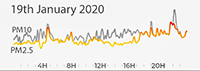 PM10 and PM2.5 pulsing alongside eachother throughout. PM10 and PM2.5 pulsing alongside eachother throughout. |
||
| 20th January | 38 | 28 | 14 | 5 | MODERATE | 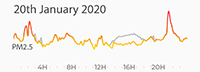 PM2.5 dominates all peaks (PM10 higher between 1pm-6pm. PM2.5 dominates all peaks (PM10 higher between 1pm-6pm. |
||
| 21st January | 37 | 29 | 18 | 5 | MODERATE | 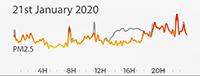 PM2.5 dominates all peaks (PM10 higher between 1pm-6pm. PM2.5 dominates all peaks (PM10 higher between 1pm-6pm. |
||
| 22nd January | 46 | 57 | 29 | 10 | HIGH | EXCEEDANCE |
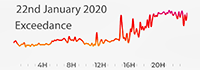 Both PM2.5 and PM10 were high into the evening in multiple peaks. NOx was also higher than usual. Overall, a bad day for breathing! Both PM2.5 and PM10 were high into the evening in multiple peaks. NOx was also higher than usual. Overall, a bad day for breathing! |
|
| 23rd January | 37 | 48 | 3 | 13 | MODERATE | 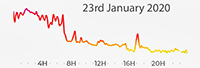 Only just under "HIGH" for PM10 in particular overnight into early morning. Only just under "HIGH" for PM10 in particular overnight into early morning. |
||
| 24th January | 26 | 24 | 2 | 13 | MODERATE | 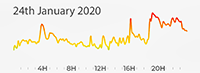 Usual 'saw-toothed' profile. This reflects the continuation of traffic-lights on the A2. Usual 'saw-toothed' profile. This reflects the continuation of traffic-lights on the A2. |
||
| 25th January | 40 | 45 | 1 | 11 | MODERATE | 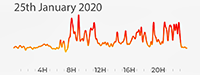 Throughout the day there were serious peaks in Particulate Matter into the evening again. Throughout the day there were serious peaks in Particulate Matter into the evening again. |
||
| 26th January | 22 | 32 | 4 | 16 | MODERATE | 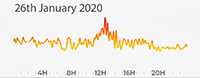 PM10 provides the peaks around midday. Unhealthy levels of PM2.5. PM10 provides the peaks around midday. Unhealthy levels of PM2.5. |
||
| 27th January | 17 | 38 | 1 | 15 | MODERATE | 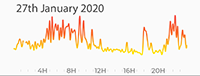 PM2.5 peaked in the evening after 8pm. PM2.5 peaked in the evening after 8pm. |
||
| 28th January | 12 | 29 | 1 | 12 | MODERATE | 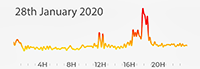 PM10 dominated with a marked peak in the early evening. PM10 dominated with a marked peak in the early evening. |
||
| 29th January | 12 | 30 | 9 | 11 | MODERATE | 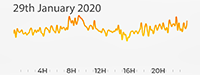 PM10 dominated against. Interestingly NOx was fairly high in the afternoon. PM10 dominated against. Interestingly NOx was fairly high in the afternoon. |
||
| 30th January | 13 | 28 | 6 | 14 | MODERATE | 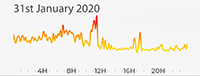 PM10 dominated again. PM10 dominated again. |
||
| 31st January | 7 | 21 | 1 | 16 | MODERATE | 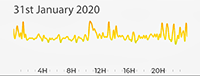 Very nearly a good day. Low pressure descended and wind direction changed. Very nearly a good day. Low pressure descended and wind direction changed. |
||
| FEBRUARY 2020 | ||||||||
| 1st February | 14 | 33 | 0 | 14 | MODERATE | 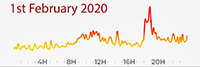 PM2.5 shadowed PM10, including the evening peak PM2.5 shadowed PM10, including the evening peak |
||
| 2nd February | 17 | 39 | 3 | 14 | MODERATE | 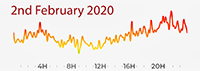 PM2.5 shadowed PM10. PM2.5 shadowed PM10. |
||
| 3rd February | 15 | 34 | 3 | 11 | MODERATE | 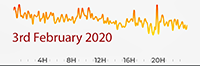 PM2.5 shadowed PM10. PM2.5 shadowed PM10. |
||
| 4th February | 13 | 31 | 2 | 7 | MODERATE | 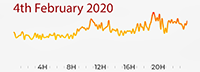 PM2.5 shadowed PM10. PM2.5 shadowed PM10. |
||
| 5th February | 20 | 37 | 2 | 7 | MODERATE | 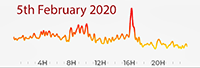 PM2.5 shadowed PM10. PM2.5 shadowed PM10. |
||
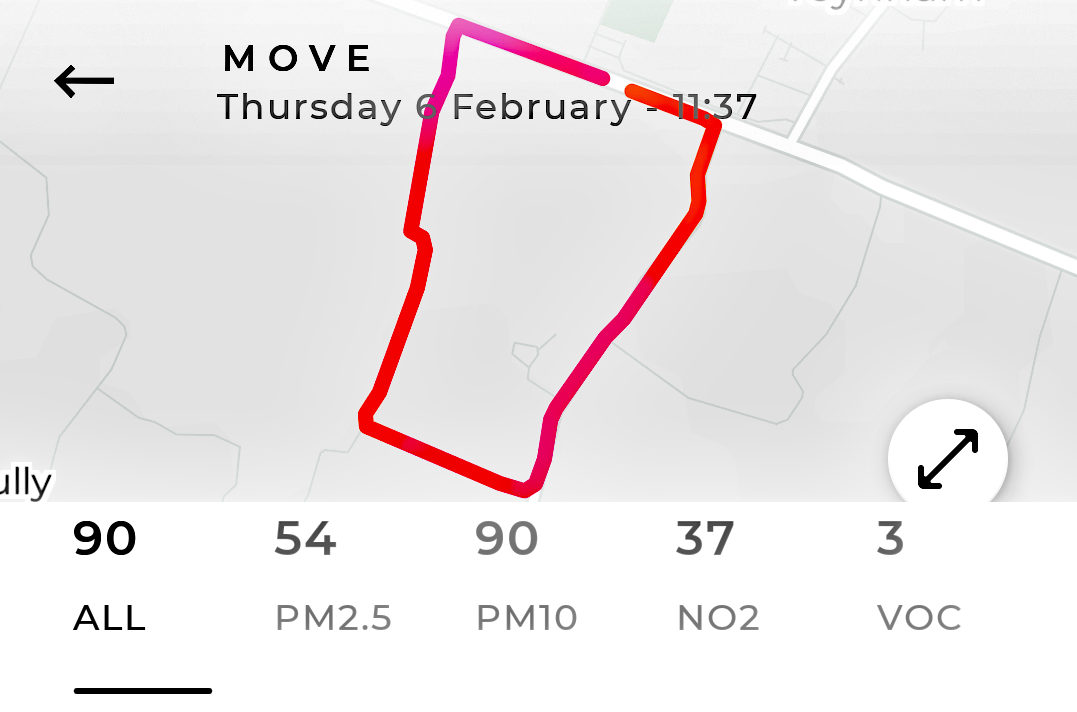
| 6th February | 31 | 33 | 19 | 6 | MODERATE | 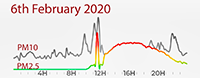 Run at midday was very worrying! 54/90/37/3 figures meaning BOTH PM fractions were "High" and "Very High" Pollution. NOx was higher throughout the afternoon and evening. Run at midday was very worrying! 54/90/37/3 figures meaning BOTH PM fractions were "High" and "Very High" Pollution. NOx was higher throughout the afternoon and evening. |
||
| 7th February | 37 | 29 | 12 | 7 | MODERATE | 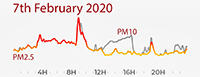 PM2.5 was EQUAL to PM10 until midday but shadowed PM10 therafter. PM2.5 was EQUAL to PM10 until midday but shadowed PM10 therafter. |
||
| 8th February | 18 | 29 | 4 | 17 | MODERATE | 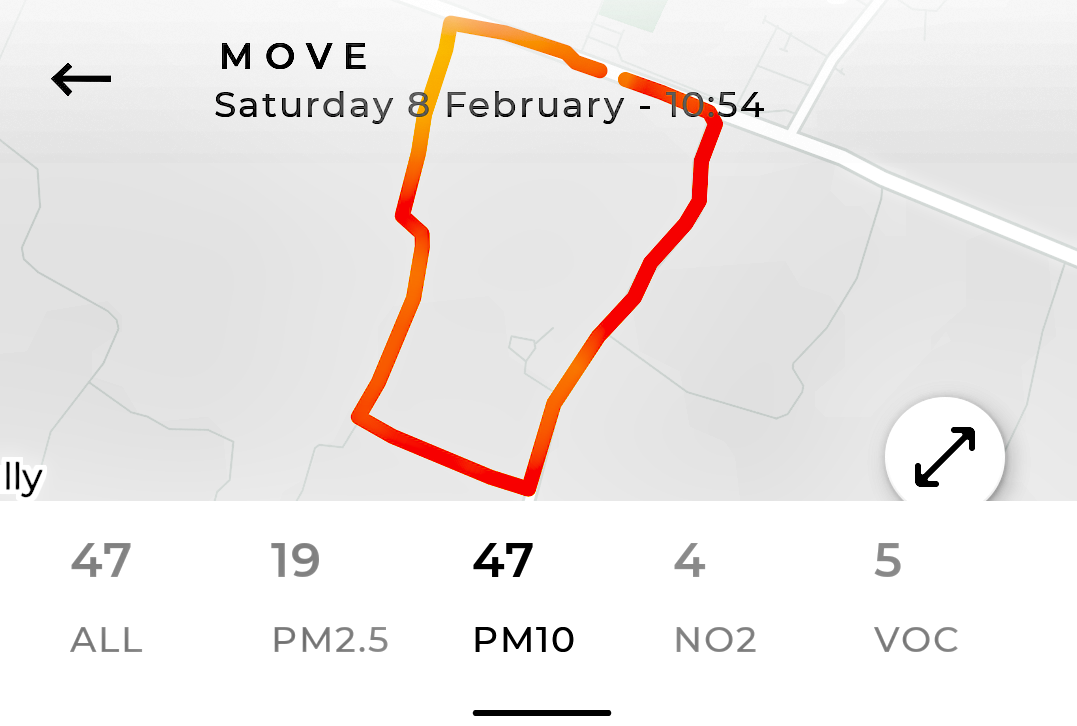 Run at 11am showing spread of pollutants. PM2.5 shadowed PM10 at spot station.. Run at 11am showing spread of pollutants. PM2.5 shadowed PM10 at spot station.. |
||
| 9th February | 17 | 33 | 0 | 17 | MODERATE | 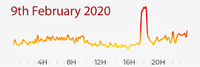 PM2.5 shaddowed PM10. PM2.5 shaddowed PM10. |
||
| 10th February | 12 | 28 | 1 | 13 | MODERATE | 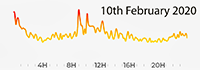 Light Rain (10.1mm). Wind 41-37km/h (gusts to 66km/h) - WSW-W Light Rain (10.1mm). Wind 41-37km/h (gusts to 66km/h) - WSW-W |
||
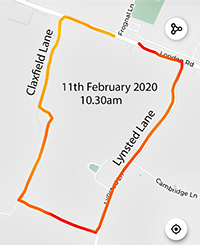
| 11th February | 14 | 30 | 2 | 11 | MODERATE | 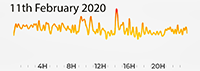 Partly cloudy (0.6mm). Wind 36km/h (gusts to 62km/h) - Westerly. Jogging Map. Partly cloudy (0.6mm). Wind 36km/h (gusts to 62km/h) - Westerly. Jogging Map. |
||
| 12th February | 16 | 29 | 1 | 10 | MODERATE | 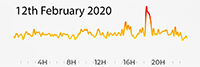 12/2: Overcast. Wind 30-15km/h (gusts to 50km/h) - WSW-W-SW. PM10 dominant. 12/2: Overcast. Wind 30-15km/h (gusts to 50km/h) - WSW-W-SW. PM10 dominant. |
||
| 13th February | 14 | 28 | 2 | 12 | MODERATE | 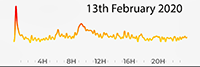 Moderate Rain (21.30mm). Wind 19-51-19km/h (gusts to 77km/h) - S-SW-WNW. PM2.5 peak after midnight. Moderate Rain (21.30mm). Wind 19-51-19km/h (gusts to 77km/h) - S-SW-WNW. PM2.5 peak after midnight. |
||
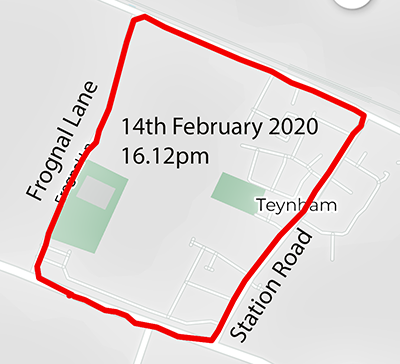
| 14th February | 20 | 38 | 5 | 12 | MODERATE | 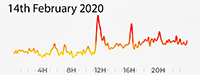 Overcast. Wind 17-28km/h (gusts to 30-49km/h) - WNW-SSW. Run via Lower Lane HIGH Pollution. Most polluted throughout afternoon. PM2.5 & PM10 mirrored throughout. Jogging map. Overcast. Wind 17-28km/h (gusts to 30-49km/h) - WNW-SSW. Run via Lower Lane HIGH Pollution. Most polluted throughout afternoon. PM2.5 & PM10 mirrored throughout. Jogging map. |
||
| 15th February | 14 | 29 | 0 | 18 | MODERATE | 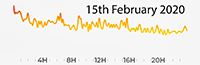 Light Rain (2.80mm). Wind 26-60km/h (gusts to 45-98km/h) - SSW-SW Light Rain (2.80mm). Wind 26-60km/h (gusts to 45-98km/h) - SSW-SW |
||
| 16th February | 10 | 24 | 0 | 16 | MODERATE | 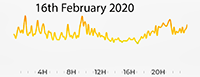 Heavy Rain (32.60mm). Wind 48-62-33km/h (gusts 81-103-59km/h) - South Westerly. PM2.5 & PM10 mirrored throughout. Heavy Rain (32.60mm). Wind 48-62-33km/h (gusts 81-103-59km/h) - South Westerly. PM2.5 & PM10 mirrored throughout. |
||
| 17th February | 17 | 37 | 1 | 12 | MODERATE | EXCEEDANCE 17.50-18.55 . |
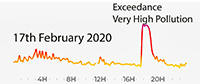 Light Showers (0.80mm). Wind 29-39-30km/h (gusts 53-60-48km/h) - SW-WSW. The exceedance was of PM10 (PM2.5 peak too). Light Showers (0.80mm). Wind 29-39-30km/h (gusts 53-60-48km/h) - SW-WSW. The exceedance was of PM10 (PM2.5 peak too). |
|
| 18th Fabruary | 12 | 26 | 1 | 11 | MODERATE | 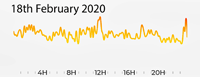 Light Drizzle (1.10mm). Wind 29-34-28km/h (gusts to 46-50-43km/h) - WSW. PM10 dominating; PM2.5 mirroring. Light Drizzle (1.10mm). Wind 29-34-28km/h (gusts to 46-50-43km/h) - WSW. PM10 dominating; PM2.5 mirroring. |
||
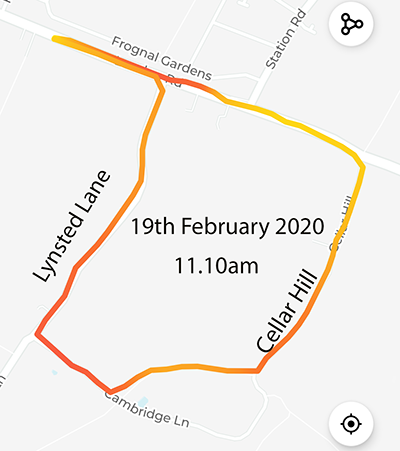
| 19th February | 15 | 31 | 2 | 10 | MODERATE | 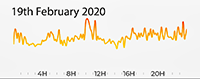 Light Drizzle (1.5mm). Wind 24-27km/h (gusts to 42-45km/h) - WNW-SW. Run on Lynsted Lane and Cellar Hill - Moderately higher pollution South of A2. Jogging Map. Light Drizzle (1.5mm). Wind 24-27km/h (gusts to 42-45km/h) - WNW-SW. Run on Lynsted Lane and Cellar Hill - Moderately higher pollution South of A2. Jogging Map. |
||
| 20th February | 12 | 28 | 1 | 12 | MODERATE | 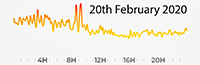 Moderate Rain at Times (5.60mm). Wind 27-51-23km/h (gusts to 47-69-41km/h) - SW-W. Moderate Rain at Times (5.60mm). Wind 27-51-23km/h (gusts to 47-69-41km/h) - SW-W. |
||
| 21st February | 15 | 34 | 1 | 11 | MODERATE | 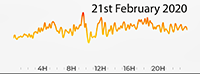 Overcast. Wind 23-42km/h (gusts 43-68km/h) - W-SW. Pulsing traffic as usual ALL DAY (as usual). Overcast. Wind 23-42km/h (gusts 43-68km/h) - W-SW. Pulsing traffic as usual ALL DAY (as usual). |
||
| 22nd February | 14 | 32 | 0 | 13 | MODERATE | 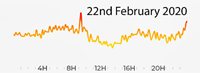 Patchy Rain Possible (0.30mm). Wind 41-28km/h (gusts to 67-75-47km/h) - SW-W-WSW. Patchy Rain Possible (0.30mm). Wind 41-28km/h (gusts to 67-75-47km/h) - SW-W-WSW. |
||
| 23rd February | 11 | 25 | 2 | 12 | MODERATE | 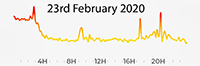 Light Drizzle (4.20mm). Wind 24-50-10km/h (gusts 41-89-16km/h) - WSW-W-NW. HIGHER pollution early morning. Light Drizzle (4.20mm). Wind 24-50-10km/h (gusts 41-89-16km/h) - WSW-W-NW. HIGHER pollution early morning. |
||
| 24th February | 13 | 25 | 1 | 12 | MODERATE | 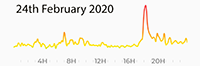 Light Rain (6.10mm). Wind 7-47-30km/h (gusts 11-71-49km/h) - S-SW-W. 6pm peak significant PM2.5 and PM10. Light Rain (6.10mm). Wind 7-47-30km/h (gusts 11-71-49km/h) - S-SW-W. 6pm peak significant PM2.5 and PM10. |
||
| 25th February | 12 | 23 | 3 | 11 | MODERATE | 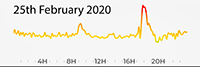 Light Sleet Showers (1.90mm). Wind 23-32 (gusts 39-50km/h) - W-WSW-W. The 6pm peak was dominated by PM2.5. Light Sleet Showers (1.90mm). Wind 23-32 (gusts 39-50km/h) - W-WSW-W. The 6pm peak was dominated by PM2.5. |
||
| 26th February | 13 | 28 | 4 | 6 | MODERATE |  Patchy Rain Possible (0.50mm). Wind 32-18 (gusts 48-31km/h) - W-WNW-WSW. PM2.5 highest between 6pm and 9pm. Patchy Rain Possible (0.50mm). Wind 32-18 (gusts 48-31km/h) - W-WNW-WSW. PM2.5 highest between 6pm and 9pm. |
||
| 27th February | 15 | 25 | 1 | 5 | MODERATE | 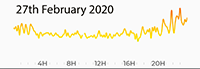 Heavy Snow/Rain (14.40mm). Wind 17-33-18 (gusts 28-44-36km/h) - WSW-S-NNW-WNW. PM2.5 highest early morning and late evening. Heavy Snow/Rain (14.40mm). Wind 17-33-18 (gusts 28-44-36km/h) - WSW-S-NNW-WNW. PM2.5 highest early morning and late evening. |
||
| 28th February | 18 | 29 | 14 | 11 | MODERATE | 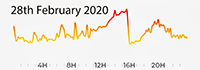 Moderate Rain (12.20mm). Wind 16-43-37km/h (gusts 31-63-62km/h) - W-S-SW. Midday to 4pm peak is NOx. Moderate Rain (12.20mm). Wind 16-43-37km/h (gusts 31-63-62km/h) - W-S-SW. Midday to 4pm peak is NOx. |
||
| 29th February | 17 | 42 | 10 | 17 | MODERATE | 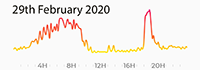 Moderate Rain (11.10mm). Wind 40-47-36km/h (gusts 64-73-58km/h) - SSW-WSW-SW. PM10 dominant. Moderate Rain (11.10mm). Wind 40-47-36km/h (gusts 64-73-58km/h) - SSW-WSW-SW. PM10 dominant. |
||
Note: There are no known lower safety levels for PM2.5 (W.H.O.)
